

School of Engineering and Science - Jacobs University
School of Engineering and Science - Jacobs University
School of Engineering and Science - Jacobs University

You also want an ePaper? Increase the reach of your titles
YUMPU automatically turns print PDFs into web optimized ePapers that Google loves.
Absorbance<br />
0.05<br />
1<br />
2<br />
1600 1400 1200 1000<br />
Wavenumber, cm -1<br />
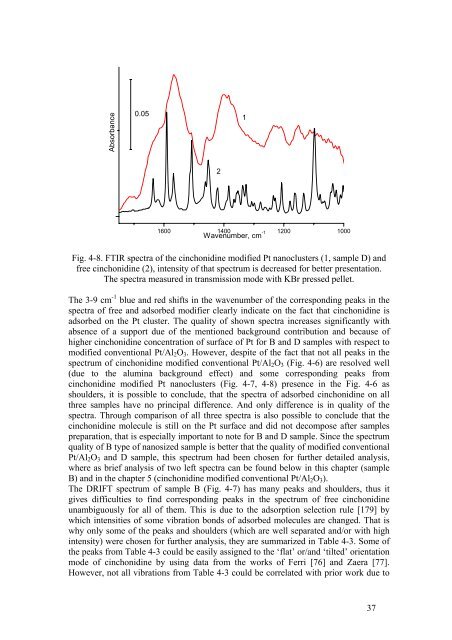
Fig. 4-8. FTIR spectra <strong>of</strong> the cinchonidine modified Pt nanoclusters (1, sample D) <strong>and</strong><br />
free cinchonidine (2), intensity <strong>of</strong> that spectrum is decreased for better presentation.<br />
The spectra measured in transmission mode with KBr pressed pellet.<br />
The 3-9 cm -1 blue <strong>and</strong> red shifts in the wavenumber <strong>of</strong> the corresponding peaks in the<br />
spectra <strong>of</strong> free <strong>and</strong> adsorbed modifier clearly indicate on the fact that cinchonidine is<br />
adsorbed on the Pt cluster. The quality <strong>of</strong> shown spectra increases significantly with<br />
absence <strong>of</strong> a support due <strong>of</strong> the mentioned background contribution <strong>and</strong> because <strong>of</strong><br />
higher cinchonidine concentration <strong>of</strong> surface <strong>of</strong> Pt for B <strong>and</strong> D samples with respect to<br />
modified conventional Pt/Al 2 O 3 . However, despite <strong>of</strong> the fact that not all peaks in the<br />
spectrum <strong>of</strong> cinchonidine modified conventional Pt/Al 2 O 3 (Fig. 4-6) are resolved well<br />
(due to the alumina background effect) <strong>and</strong> some corresponding peaks from<br />
cinchonidine modified Pt nanoclusters (Fig. 4-7, 4-8) presence in the Fig. 4-6 as<br />
shoulders, it is possible to conclude, that the spectra <strong>of</strong> adsorbed cinchonidine on all<br />
three samples have no principal difference. And only difference is in quality <strong>of</strong> the<br />
spectra. Through comparison <strong>of</strong> all three spectra is also possible to conclude that the<br />
cinchonidine molecule is still on the Pt surface <strong>and</strong> did not decompose after samples<br />
preparation, that is especially important to note for B <strong>and</strong> D sample. Since the spectrum<br />
quality <strong>of</strong> B type <strong>of</strong> nanosized sample is better that the quality <strong>of</strong> modified conventional<br />
Pt/Al 2 O 3 <strong>and</strong> D sample, this spectrum had been chosen for further detailed analysis,<br />
where as brief analysis <strong>of</strong> two left spectra can be found below in this chapter (sample<br />
B) <strong>and</strong> in the chapter 5 (cinchonidine modified conventional Pt/Al 2 O 3 ).<br />
The DRIFT spectrum <strong>of</strong> sample B (Fig. 4-7) has many peaks <strong>and</strong> shoulders, thus it<br />
gives difficulties to find corresponding peaks in the spectrum <strong>of</strong> free cinchonidine<br />
unambiguously for all <strong>of</strong> them. This is due to the adsorption selection rule [179] by<br />
which intensities <strong>of</strong> some vibration bonds <strong>of</strong> adsorbed molecules are changed. That is<br />
why only some <strong>of</strong> the peaks <strong>and</strong> shoulders (which are well separated <strong>and</strong>/or with high<br />
intensity) were chosen for further analysis, they are summarized in Table 4-3. Some <strong>of</strong><br />
the peaks from Table 4-3 could be easily assigned to the ‘flat’ or/<strong>and</strong> ‘tilted’ orientation<br />
mode <strong>of</strong> cinchonidine by using data from the works <strong>of</strong> Ferri [76] <strong>and</strong> Zaera [77].<br />
However, not all vibrations from Table 4-3 could be correlated with prior work due to<br />
37


