Whitepaper IBM FSM - Cenit AG Systemhaus
Whitepaper IBM FSM - Cenit AG Systemhaus
Whitepaper IBM FSM - Cenit AG Systemhaus

Create successful ePaper yourself
Turn your PDF publications into a flip-book with our unique Google optimized e-Paper software.
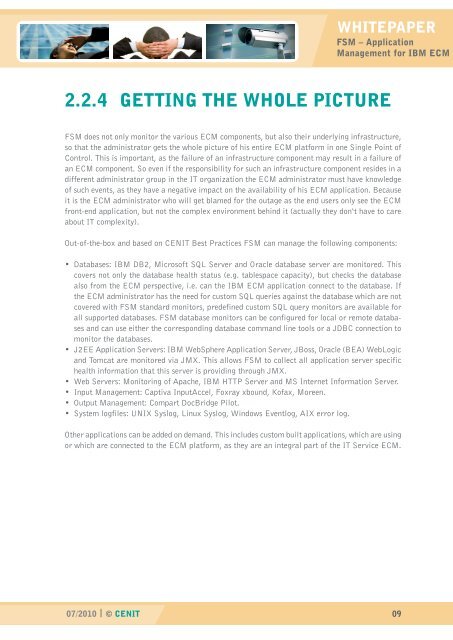
2.2.4 getting the Whole pictuRe<br />
07/2010 | © cenit<br />
WhitepapeR<br />
fsM – application<br />
Management for ibM ecM<br />
<strong>FSM</strong> does not only monitor the various ECM components, but also their underlying infrastructure,<br />
so that the administrator gets the whole picture of his entire ECM platform in one Single Point of<br />
Control. This is important, as the failure of an infrastructure component may result in a failure of<br />
an ECM component. So even if the responsibility for such an infrastructure component resides in a<br />
different administrator group in the IT organization the ECM administrator must have knowledge<br />
of such events, as they have a negative impact on the availability of his ECM application. Because<br />
it is the ECM administrator who will get blamed for the outage as the end users only see the ECM<br />
front-end application, but not the complex environment behind it (actually they don‘t have to care<br />
about IT complexity).<br />
Out-of-the-box and based on CENIT Best Practices <strong>FSM</strong> can manage the following components:<br />
• Databases: <strong>IBM</strong> DB2, Microsoft SQL Server and Oracle database server are monitored. This<br />
covers not only the database health status (e.g. tablespace capacity), but checks the database<br />
also from the ECM perspective, i.e. can the <strong>IBM</strong> ECM application connect to the database. If<br />
the ECM administrator has the need for custom SQL queries against the database which are not<br />
covered with <strong>FSM</strong> standard monitors, predefined custom SQL query monitors are available for<br />
all supported databases. <strong>FSM</strong> database monitors can be configured for local or remote databases<br />
and can use either the corresponding database command line tools or a JDBC connection to<br />
monitor the databases.<br />
• J2EE Application Servers: <strong>IBM</strong> WebSphere Application Server, JBoss, Oracle (BEA) WebLogic<br />
and Tomcat are monitored via JMX. This allows <strong>FSM</strong> to collect all application server specific<br />
health information that this server is providing through JMX.<br />
• Web Servers: Monitoring of Apache, <strong>IBM</strong> HTTP Server and MS Internet Information Server.<br />
• Input Management: Captiva InputAccel, Foxray xbound, Kofax, Moreen.<br />
• Output Management: Compart DocBridge Pilot.<br />
• System logfiles: UNIX Syslog, Linux Syslog, Windows Eventlog, AIX error log.<br />
Other applications can be added on demand. This includes custom built applications, which are using<br />
or which are connected to the ECM platform, as they are an integral part of the IT Service ECM.<br />
09