Ferromagnetic (Ga,Mn)As Layers and ... - OPUS Würzburg
Ferromagnetic (Ga,Mn)As Layers and ... - OPUS Würzburg
Ferromagnetic (Ga,Mn)As Layers and ... - OPUS Würzburg

Create successful ePaper yourself
Turn your PDF publications into a flip-book with our unique Google optimized e-Paper software.
68 5. Local Anisotropy Control by Strain Engineering<br />
6.00<br />
(a)<br />
<strong>Ga</strong><strong>As</strong><br />
(b)<br />
5.98<br />
(<strong>Ga</strong>,<strong>Mn</strong>)<strong>As</strong><br />
[00L]<br />
5.96<br />
(In,<strong>Ga</strong>)<strong>As</strong><br />
5.94<br />
1.98 2.00 2.02<br />
[0H0]<br />
1.98 2.00 2.02<br />
[H00]<br />
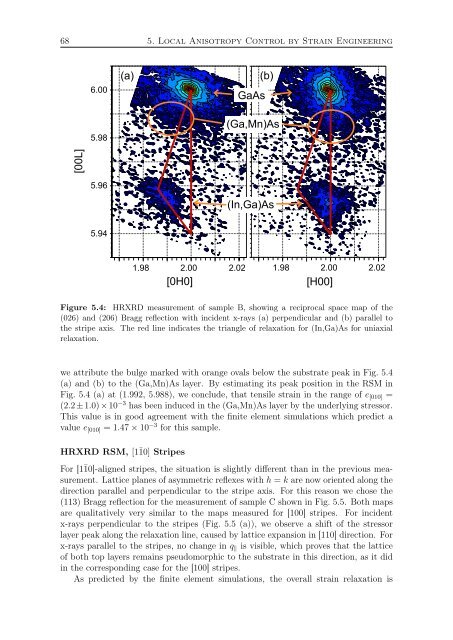
Figure 5.4: HRXRD measurement of sample B, showing a reciprocal space map of the<br />
(026) <strong>and</strong> (206) Bragg reflection with incident x-rays (a) perpendicular <strong>and</strong> (b) parallel to<br />
the stripe axis. The red line indicates the triangle of relaxation for (In,<strong>Ga</strong>)<strong>As</strong> for uniaxial<br />
relaxation.<br />
we attribute the bulge marked with orange ovals below the substrate peak in Fig. 5.4<br />
(a) <strong>and</strong> (b) to the (<strong>Ga</strong>,<strong>Mn</strong>)<strong>As</strong> layer. By estimating its peak position in the RSM in<br />
Fig. 5.4 (a) at (1.992, 5.988), we conclude, that tensile strain in the range of e [010] =<br />
(2.2 ± 1.0) × 10 −3 has been induced in the (<strong>Ga</strong>,<strong>Mn</strong>)<strong>As</strong> layer by the underlying stressor.<br />
This value is in good agreement with the finite element simulations which predict a<br />
value e [010] = 1.47 × 10 −3 for this sample.<br />
HRXRD RSM, [1¯10] Stripes<br />
For [1¯10]-aligned stripes, the situation is slightly different than in the previous measurement.<br />
Lattice planes of asymmetric reflexes with h = k are now oriented along the<br />
direction parallel <strong>and</strong> perpendicular to the stripe axis. For this reason we chose the<br />
(113) Bragg reflection for the measurement of sample C shown in Fig. 5.5. Both maps<br />
are qualitatively very similar to the maps measured for [100] stripes. For incident<br />
x-rays perpendicular to the stripes (Fig. 5.5 (a)), we observe a shift of the stressor<br />
layer peak along the relaxation line, caused by lattice expansion in [110] direction. For<br />
x-rays parallel to the stripes, no change in q ‖ is visible, which proves that the lattice<br />
of both top layers remains pseudomorphic to the substrate in this direction, as it did<br />
in the corresponding case for the [100] stripes.<br />
<strong>As</strong> predicted by the finite element simulations, the overall strain relaxation is