Ferromagnetic (Ga,Mn)As Layers and ... - OPUS Würzburg
Ferromagnetic (Ga,Mn)As Layers and ... - OPUS Würzburg
Ferromagnetic (Ga,Mn)As Layers and ... - OPUS Würzburg

Create successful ePaper yourself
Turn your PDF publications into a flip-book with our unique Google optimized e-Paper software.
76 5. Local Anisotropy Control by Strain Engineering<br />
6 0 0<br />
W id th a t H a lf H e ig h t (m T )<br />
4 0 0<br />
2 0 0<br />
0<br />
-1 0 1 2 3 4 5 6<br />
S tra in e x<br />
(1 0 -3 )<br />
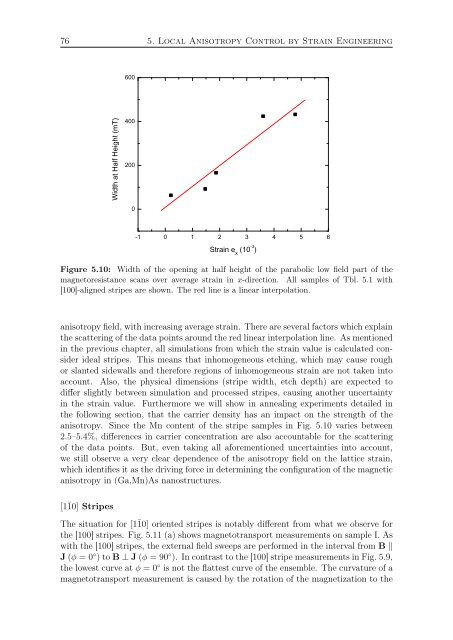
Figure 5.10: Width of the opening at half height of the parabolic low field part of the<br />
magnetoresistance scans over average strain in x-direction. All samples of Tbl. 5.1 with<br />
[100]-aligned stripes are shown. The red line is a linear interpolation.<br />
anisotropy field, with increasing average strain. There are several factors which explain<br />
the scattering of the data points around the red linear interpolation line. <strong>As</strong> mentioned<br />
in the previous chapter, all simulations from which the strain value is calculated consider<br />
ideal stripes. This means that inhomogeneous etching, which may cause rough<br />
or slanted sidewalls <strong>and</strong> therefore regions of inhomogeneous strain are not taken into<br />
account. Also, the physical dimensions (stripe width, etch depth) are expected to<br />
differ slightly between simulation <strong>and</strong> processed stripes, causing another uncertainty<br />
in the strain value. Furthermore we will show in annealing experiments detailed in<br />
the following section, that the carrier density has an impact on the strength of the<br />
anisotropy. Since the <strong>Mn</strong> content of the stripe samples in Fig. 5.10 varies between<br />
2.5–5.4%, differences in carrier concentration are also accountable for the scattering<br />
of the data points. But, even taking all aforementioned uncertainties into account,<br />
we still observe a very clear dependence of the anisotropy field on the lattice strain,<br />
which identifies it as the driving force in determining the configuration of the magnetic<br />
anisotropy in (<strong>Ga</strong>,<strong>Mn</strong>)<strong>As</strong> nanostructures.<br />
[1¯10] Stripes<br />
The situation for [1¯10] oriented stripes is notably different from what we observe for<br />
the [100] stripes. Fig. 5.11 (a) shows magnetotransport measurements on sample I. <strong>As</strong><br />
with the [100] stripes, the external field sweeps are performed in the interval from B ‖<br />
J (φ = 0 ◦ ) to B ⊥ J (φ = 90 ◦ ). In contrast to the [100] stripe measurements in Fig. 5.9,<br />
the lowest curve at φ = 0 ◦ is not the flattest curve of the ensemble. The curvature of a<br />
magnetotransport measurement is caused by the rotation of the magnetization to the