National Survey of Research Commercialisation - Australian ...
National Survey of Research Commercialisation - Australian ...
National Survey of Research Commercialisation - Australian ...

Create successful ePaper yourself
Turn your PDF publications into a flip-book with our unique Google optimized e-Paper software.
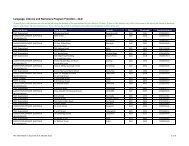
Table 13: Gross income from licences — running royalties, cashed-in equity and all other income, Year 2000<br />
($’000) (for respondents that provided data)<br />
COMMERCIAL ACTIVIT Y<br />
Total Gross<br />
Income<br />
Running<br />
Royalties<br />
Percent<br />
<strong>of</strong> Total<br />
Cashed-In<br />
Equity<br />
Percent<br />
<strong>of</strong> Total<br />
All Other<br />
Income<br />
Universities 79,834 8,702 11 52,342 66 18,790 24<br />
Medical <strong>Research</strong> Institutes 8,071 4,002 50 2,200 27 1,869 23<br />
CSIRO 11,620 5,455 47 600 5 5,565 48<br />
Total 99,525 18,159 18 55,142 55 26,224 26<br />
Percent<br />
<strong>of</strong> Total<br />
CSIRO reported that, <strong>of</strong> the 220 <strong>of</strong> its licences which yielded income in Year 2000, 170<br />
yielded income in the form <strong>of</strong> running royalties and one yielded income in the form <strong>of</strong><br />
cashed-in equity. All others yielded income from other sources, such as licence-issue fees,<br />
payments under options and termination payments.<br />
Of CSIRO’s 220 income producing-licences, six accounted for 55% <strong>of</strong> total gross income<br />
from licences — 21% <strong>of</strong> income-producing licences accounted for almost 90% <strong>of</strong> total<br />
gross income from licences. Some 38% ($4.4 million) <strong>of</strong> gross income from licences was<br />
from overseas.<br />
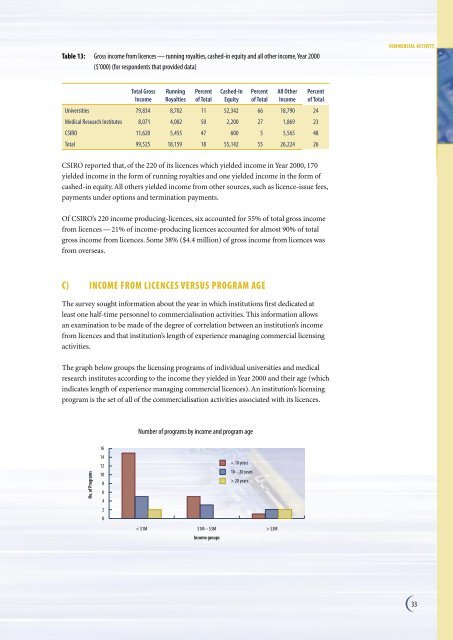
C) INCOME FROM LICENCES VERSUS PROGRAM AGE<br />
The survey sought information about the year in which institutions first dedicated at<br />
least one half-time personnel to commercialisation activities. This information allows<br />
an examination to be made <strong>of</strong> the degree <strong>of</strong> correlation between an institution’s income<br />
from licences and that institution’s length <strong>of</strong> experience managing commercial licensing<br />
activities.<br />
The graph below groups the licensing programs <strong>of</strong> individual universities and medical<br />
research institutes according to the income they yielded in Year 2000 and their age (which<br />
indicates length <strong>of</strong> experience managing commercial licences). An institution’s licensing<br />
program is the set <strong>of</strong> all <strong>of</strong> the commercialisation activities associated with its licences.<br />
Number <strong>of</strong> programs by income and program age<br />
<br />
<br />
<br />
<br />
<br />
<br />
<br />
<br />
<br />
<br />
<br />
<br />
<br />
<br />
<br />
<br />
<br />
33