National Resources Sector Employment Taskforce Technical Paper
National Resources Sector Employment Taskforce Technical Paper
National Resources Sector Employment Taskforce Technical Paper

Create successful ePaper yourself
Turn your PDF publications into a flip-book with our unique Google optimized e-Paper software.
RESOURCING THE FUTURE<br />
<strong>National</strong> <strong>Resources</strong> <strong>Sector</strong><br />
<strong>Employment</strong> <strong>Taskforce</strong><br />
<strong>Technical</strong> <strong>Paper</strong><br />
July 2010
© Commonwealth of Australia 2010<br />
This paper is copyright. You may download, display, print and reproduce this material in unaltered form<br />
only (retaining this notice) for your personal, non commercial uses or use within your organisation.<br />
All other rights are reserved. Requests and inquiries concerning reproduction and rights should be<br />
addressed to the Commonwealth Copyright Administration, Attorney General’s Department, <strong>National</strong><br />
Circuit, Barton ACT 2600 or posted at http://www.ag.gov.au/cca<br />
ISBN 978-0-642-33102-1 [PDF]<br />
ISBN 978-0-642-33103-8 [RTF]<br />
Disclaimer:<br />
The material contained in this paper has been developed by the <strong>National</strong> <strong>Resources</strong> <strong>Sector</strong> <strong>Employment</strong><br />
<strong>Taskforce</strong>. The views and opinions expressed in the materials do not necessarily reflect the view of or<br />
have the endorsement of the Australian Government or of any minister, or indicate the Australian<br />
Government’s commitment to a particular course of action.<br />
The Australian Government and the <strong>National</strong> <strong>Resources</strong> <strong>Sector</strong> <strong>Employment</strong> <strong>Taskforce</strong> accept no<br />
responsibility for the accuracy or completeness of the contents and accept no liability in respect of the<br />
material contained in the paper. The Australian Government recommends that users exercise their own<br />
skill and care in evaluating the accuracy, completeness, and relevance of the paper and where necessary<br />
obtain independent professional advice appropriate to their own particular circumstances.<br />
In addition, the Australian Government and the <strong>National</strong> <strong>Resources</strong> <strong>Sector</strong> <strong>Employment</strong> <strong>Taskforce</strong>, their<br />
members, employees, agents and officers accept no responsibility for any loss or liability (including<br />
reasonable legal costs and expenses) or liability incurred or suffered where such loss or liability was<br />
caused by the infringement of intellectual property rights, including the moral rights, of any third<br />
person.<br />
The paper can be accessed at: www.deewr.gov.au/nrset
Table of Contents<br />
1. Introduction............................................................................................................. 1<br />
1.1 Mapping resources projects......................................................................................................1<br />
1.2 Demand for labour and skills....................................................................................................1<br />
1.3 Supply of labour and skills........................................................................................................1<br />
1.4 Skill gaps..................................................................................................................................2<br />
2. Projects..................................................................................................................... 3<br />
2.1 Projects underway or in the pipeline.........................................................................................3<br />
2.2 Project timing ..........................................................................................................................5<br />
3. Demand for labour and skills .............................................................................. 11<br />
3.1 Trends in demand for resources .............................................................................................12<br />
3.2 Demand for construction labour and skills .............................................................................13<br />
3.3 Modelling outcomes...............................................................................................................14<br />
3.4 Mining production.................................................................................................................18<br />
3.5 Demand for labour and skills in mining operations (excludes gas)...........................................19<br />
3.6 Gas operations.......................................................................................................................21<br />
3.7 Replacement demand.............................................................................................................24<br />
4. Supply of labour and skills................................................................................... 28<br />
4.1 Australia’s existing stock of skills.............................................................................................29<br />
4.2 Unemployment by occupation and by state and territory........................................................30<br />
4.3 New supplies of skills..............................................................................................................31<br />
5. Where are the skills gaps? ................................................................................... 45<br />
5.1 Strong economic growth is likely to increase the competition for skills<br />
and labour from other industries............................................................................................46<br />
5.2 Trends in earnings..................................................................................................................46<br />
5.3 The potential for skills gaps ...................................................................................................47<br />
5.4 Skills demand ........................................................................................................................47<br />
5.5 Supply of skills.......................................................................................................................47<br />
5.6 Supply gaps...........................................................................................................................48<br />
5.7 Competing demands for construction skills sought by the resources sector.............................50<br />
5.8 Skills shortages are limited to date but will increase................................................................53<br />
5.9 Summary...............................................................................................................................56<br />
<strong>National</strong> <strong>Resources</strong> <strong>Sector</strong> <strong>Employment</strong> <strong>Taskforce</strong>: <strong>Technical</strong> <strong>Paper</strong> | ii
Appendix I—<strong>Taskforce</strong> modelling outcomes................................................................. 58<br />
Construction..................................................................................................................................58<br />
Mining...........................................................................................................................................60<br />
Appendix II—Detailed ABARE projections of commodity production 2008–2015 ..... 63<br />
Appendix III—Employed and unemployed by occupation........................................... 65<br />
Appendix IV—Higher education .................................................................................... 67<br />
Linear projection model for higher education data..........................................................................67<br />
Completions and projections in domestic engineering and geoscience undergraduate courses........69<br />
People on their way into the sector ...............................................................................................70<br />
Share of employment by field of study............................................................................................71<br />
Appendix V—DEEWR analysis of skill shortages ......................................................... 72<br />
Skill shortage methodology ...........................................................................................................78<br />
Appendix VI—NRSET Industry Survey........................................................................... 84<br />
Background....................................................................................................................................84<br />
Conducting the survey...................................................................................................................84<br />
Appendix VII—Acronyms.............................................................................................. 101<br />
Appendix VIII—References........................................................................................... 103<br />
Please note: this report uses data available as at 1 June 2010<br />
ii | <strong>National</strong> <strong>Resources</strong> <strong>Sector</strong> <strong>Employment</strong> <strong>Taskforce</strong>: <strong>Technical</strong> <strong>Paper</strong>
List of tables and figures<br />
Tables<br />
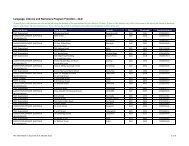
Table 1: Advanced projects, number, cost ($ million), sector and state and territory, April 2010......4<br />
Table 2:<br />
Projected demand for construction skills..........................................................................16<br />
Table 3: Projected employment in mining operations, 2015..........................................................20<br />
Table 4:<br />
Table 5:<br />
Table 6:<br />
Table 7:<br />
Energy Skills Queensland, new jobs growth by occupation,<br />
Queensland, projections to 2015.....................................................................................22<br />
Growth scenarios for Western Australia (4, 6 and 8 trains)..............................................23<br />
Estimates of gross replacement rates for major resources sector occupation....................25<br />
Projected losses from mining sector employment to retirement,<br />
2010 to 2015, by occupation..........................................................................................27<br />
Table 8: Number employed and unemployed for selected occupations, February 2010.................29<br />
Table 9: Unemployment by selected previous occupation, by state and territory, 2010..................30<br />
Table 10: Unemployment in selected areas, March quarter 2010....................................................31<br />
Table 11: Projected growth in skills supply for selected technicians<br />
and tradespeople, 2010 to 2015, best, average and worst case scenarios .......................33<br />
Table 12: Projected new skill formation in the skilled trades, Australia, 2010 to 2015.....................34<br />
Table 13: Projected supply of technicians and tradespeople, by state and territory,<br />
2010 to 2015, by scenario..............................................................................................35<br />
Table 14: Relative share of apprentices employed by the resources sector, by selected<br />
occupations (fair share=100)...........................................................................................38<br />
Table 15: Relative share of apprentices employed by the resources sector,<br />
by industry (fair share=100).............................................................................................39<br />
Table 16: Student commencements in engineering higher education courses,<br />
by citizenship and course level, 2002 to 2008.................................................................40<br />
Table 17: Student commencements in geoscience higher education courses,<br />
by citizenship and course level, 2002 to 2008.................................................................40<br />
Table 18: Number of completions and projected completions in higher education domestic<br />
undergraduate courses for engineering fields of education, 2008 and 2014....................41<br />
Table 19: Number of completions and projected completions in higher education domestic<br />
undergraduate courses for engineering, by state and territory, 2008 and 2014................41<br />
Table 20: Proportion of graduates working in areas related to training,<br />
by field of study, 2008.....................................................................................................42<br />
Table 21: Number and percentage of those with mining engineering and geoscience<br />
qualifications working in mining, 2006............................................................................43<br />
Table 22: Primary visa applications granted by selected occupations, 2008–09...............................44<br />
Table 23: Projected supply of trades versus projected new and replacement jobs ...........................48<br />
Table 24: Projected supply of engineers versus projected new and replacement jobs ......................49<br />
Table 25: Current and emerging skills shortages, 2010 onward......................................................54<br />
<strong>National</strong> <strong>Resources</strong> <strong>Sector</strong> <strong>Employment</strong> <strong>Taskforce</strong>: <strong>Technical</strong> <strong>Paper</strong> | iii
Table 26 Pit Crew Management Consulting Services Pty Ltd, workforce analysis<br />
by ANZCO category, November 2009–November 2013...................................................55<br />
Table 27: Heavy and civil engineering construction projection for technicians and<br />
trades workers and machinery operators and drivers (short term jobs),<br />
2009 to 2016..................................................................................................................58<br />
Table 28: Projections of growth in mining employment (less oil and gas) 2008 to 2015,<br />
by occupation ................................................................................................................60<br />
Table 29: Projected employment growth for mining operations, by state and territory,<br />
2008 to 2015..................................................................................................................62<br />
Table 30: ABARE commodity projections 2008 to 2015..................................................................63<br />
Table 31: Number employed and unemployed for selected professional occupations......................65<br />
Table 32: Number employed and unemployed for selected technician<br />
and tradespeople occupations.........................................................................................66<br />
Table 33: Number employed and unemployed for selected occupations.........................................66<br />
Table 34: Number of completions and projected completions in higher education domestic<br />
undergraduate courses for engineering and geoscience fields of education.....................69<br />
Table 35: Bachelor’s degree graduates available for full-time work and in full-time study as a<br />
proportion of all bachelor’s degree graduates, and of those available for full-time<br />
work, the proportion of those in and seeking full-time employment, 2008......................70<br />
Table 36: The number of people with an engineering and related technology degree<br />
or earth science degree by industry of employment, 2006...............................................71<br />
Table 37: Skill shortages in resources occupations, 2008 to 2010...................................................77<br />
iv | <strong>National</strong> <strong>Resources</strong> <strong>Sector</strong> <strong>Employment</strong> <strong>Taskforce</strong>: <strong>Technical</strong> <strong>Paper</strong>
Figures<br />
Figure 1: Advanced projects by location...........................................................................................4<br />
Figure 2: Less advanced projects–state share Australia, April 2010...................................................5<br />
Figure 3: Scheduling for advanced and less advanced projects ........................................................6<br />
Figure 4: Mining engineering work done, per cent of nominal GDP, 1987–2009............................12<br />
Figure 5: Estimated construction employment by year–three growth scenarios...............................15<br />
Figure 6: Forecast total construction labour demand in Western Australia, 2009–10 to 2015–16...17<br />
Figure 7: 2010 Major projects workforce demand—Queensland, 2009–10 to 2015–16.................18<br />
Figure 8: Age profile of the mining (includes oil and gas extraction)<br />
and construction industries, February 2010.....................................................................26<br />
Figure 9: Number and percentage change in apprentice and trainee completions by state and<br />
territory, 2005–2009.......................................................................................................32<br />
Figure 10: Projected growth in the supply of tradespeople, 2010 to 2015, by state and territory,<br />
average case scenario......................................................................................................34<br />
Figure 11: Projected growth in the supply of tradespeople, 2010 to 2015, by state<br />
and territory, percentage change, average case scenario..................................................36<br />
Figure 12: Projected growth in supply of selected tradespeople, 2010 to 2015, by state<br />
and territory, percentage change, average case scenario..................................................37<br />
Figure 13: Other major infrastructure projects..................................................................................52<br />
Figure 14: Number of suitable applicants per vacancy, engineers, 2007 to 2010..............................73<br />
Figure 15: Vacancies filled, trades groups, 2007 to 2010 (per cent)..................................................74<br />
Figure 16: Number of suitable applicants per vacancy, construction trades, 2007 to 2010................75<br />
Figure 17: Number of suitable applicants per vacancy, metal/engineering trades, 2007 to 2010.......75<br />
Figure 18: Number of suitable applicants per vacancy, electrical<br />
and communications trades, 2007 to 2010.....................................................................76<br />
<strong>National</strong> <strong>Resources</strong> <strong>Sector</strong> <strong>Employment</strong> <strong>Taskforce</strong>: <strong>Technical</strong> <strong>Paper</strong> | v
vi | <strong>National</strong> <strong>Resources</strong> <strong>Sector</strong> <strong>Employment</strong> <strong>Taskforce</strong>: <strong>Technical</strong> <strong>Paper</strong>
1. Introduction<br />
This paper outlines the analysis undertaken to estimate the resources sector’s labour and<br />
skills needs on a national basis over the five years to 2015. The <strong>National</strong> <strong>Resources</strong> <strong>Sector</strong><br />
<strong>Employment</strong> <strong>Taskforce</strong> was asked to:<br />
• examine major resources projects coming online over the next five years<br />
• provide an analysis of the sector’s labour and skills needs on a national basis over the<br />
next five years<br />
• analyse the expected supply of skilled labour from domestic sources and from<br />
migration<br />
• review skills gaps.<br />
1.1 Mapping resources projects<br />
The paper maps the major resources and energy projects that are expected to be built<br />
over the next five years, including their location and estimated construction and operation<br />
commencement dates.<br />
1.2 Demand for labour and skills<br />
The <strong>Taskforce</strong> has:<br />
• modelled three growth scenarios for the construction of resources projects—low,<br />
medium and high, based on the value of construction likely to go ahead<br />
• examined trends in demand for resources, as these influence demand for labour<br />
• estimated employment growth in mining operations<br />
• modelled four growth scenarios for the gas sector for Queensland and three for<br />
Western Australia<br />
• estimated wastage (replacement demand) for the mining operations and gas sectors<br />
• tested the outcomes with stakeholders<br />
• reviewed advice from industry reports and responses through its industry survey,<br />
consultations and from submissions received on the extent of skills demand in the<br />
resources sector.<br />
1.3 Supply of labour and skills<br />
Skills for the resources sector can come from:<br />
• the existing stock of skilled workers in the national labour market—including the<br />
unemployed and the employed<br />
• new supplies of skilled workers or job seekers, including from vocational education and<br />
training, higher education, and temporary and permanent migration.<br />
The <strong>Taskforce</strong> engaged the <strong>National</strong> Centre for Vocational Education Research (NCVER) to<br />
estimate the future supply of trade skills, and the Department of Education, <strong>Employment</strong> and<br />
Workplace Relations (DEEWR) estimated the supply of professionals in skills relevant to the<br />
resources sector. The NCVER report is available at www.deewr.gov.au/nrset.<br />
<strong>National</strong> <strong>Resources</strong> <strong>Sector</strong> <strong>Employment</strong> <strong>Taskforce</strong>: <strong>Technical</strong> <strong>Paper</strong> | 1
1.4 Skills gaps<br />
The <strong>Taskforce</strong> reviewed potential skills gaps for the resources sector, taking into account<br />
the analysis of demand and supply, as well as advice from industry through consultations,<br />
submissions and the <strong>Taskforce</strong>’s industry survey.<br />
In their submissions to the <strong>Taskforce</strong>, both the Maritime Union of Australia and the<br />
Australian Institute for Marine and Power Engineers raised workforce planning issues for<br />
the maritime industry and the current shortage of marine engineers. The <strong>Taskforce</strong> notes<br />
DEEWR is separately addressing the issue of demand for maritime skills through<br />
an industry survey.<br />
2 | <strong>National</strong> <strong>Resources</strong> <strong>Sector</strong> <strong>Employment</strong> <strong>Taskforce</strong>: <strong>Technical</strong> <strong>Paper</strong>
2. Projects<br />
This chapter outlines major resources projects expected to commence construction and/or<br />
come into production over the next five years.<br />
The Australian Bureau of Agricultural and Resource Economics (ABARE) compiles a list of major<br />
minerals and energy projects expected to be built over the following five years or so. Every<br />
six months, ABARE updates this list, using publicly available information from the Australian<br />
Stock Exchange, companies’ financial reports and companies’ websites. Projects included on<br />
the list have a minimum value of $40 million, with $20 million for gold projects. The <strong>Taskforce</strong><br />
used the April 2010 version of the list as a starting point to analyse expected projects. The list<br />
includes 361 projects, comprising:<br />
• 230 new projects<br />
• 121 projects related to the expansion of existing activities<br />
• 10 redevelopments, upgrades or refurbishments (<strong>Taskforce</strong> analysis of<br />
ABARE unpublished data).<br />
Since the most recent release of the ABARE list, there have been some major announcements<br />
not captured in the <strong>Taskforce</strong>’s analysis, including BHP’s potential new $24 billion liquefied<br />
natural gas (LNG) project in Western Australia, announced on 24 May 2010. These and other<br />
announcements will continue to be monitored by ABARE in the preparation of its future<br />
reports on minerals and energy projects.<br />
2.1 Projects underway or in the pipeline<br />
The ABARE list provides a guide to the resources projects that are reasonably certain of going<br />
ahead, although slippages in project timelines occur frequently. At the end of April 2010,<br />
ABARE identified 75 major projects that were at an advanced stage of development, with a<br />
value of $109.6 billion. Projects in this category are either ‘committed’ or ‘under construction’.<br />
The distribution of these projects around Australia is shown in Figure 1.<br />
<strong>National</strong> <strong>Resources</strong> <strong>Sector</strong> <strong>Employment</strong> <strong>Taskforce</strong>: <strong>Technical</strong> <strong>Paper</strong> | 3
Figure 1: Advanced projects by location<br />
Kitan oil<br />
Montara/Skua oil<br />
Darwin<br />
Karara hematite<br />
and magnetite iron ore<br />
Extension Hill DSO iron ore<br />
Dampier–Bunbury<br />
5B gas pipeline<br />
Kwinana Processing Plant<br />
TiO 2 pigment titanium minerals<br />
Worsley Refinery Efficiency &<br />
Growth Project alumina<br />
LEGEND<br />
NWS North Rankin B LNG<br />
NWS CWLH oil<br />
Pluto LNG<br />
Gorgon LNG<br />
Sino Iron Project iron ore<br />
Capital expenditure<br />
$0–100m<br />
$101–500m<br />
$501–1000m<br />
>$1000m<br />
Processing<br />
facility<br />
Mine/<br />
platform<br />
Reindeer gas field,<br />
Devil Creek gas processing plant<br />
Utah Point Berth<br />
iron ore infrastructure<br />
Charters Towers gold<br />
Argyle diamonds<br />
Ernest Henry<br />
underground copper<br />
Abbot Point coal infrastructure<br />
Western Australian<br />
Iron Ore infrastructure<br />
Goonyella to Abbot Point X50 coal infrastructure<br />
Nullagine iron ore<br />
Coppabella to Ingsdon<br />
Boyne Island smelter aluminium<br />
Rapid Growth 5 iron ore<br />
rail duplication coal infrastructure<br />
Chichester hub 55 iron ore<br />
Moranbah Ammonium Nitrate<br />
Integrated Isaac Plains Project coal<br />
Middlemount (stage 1) coal<br />
Nicholas Downs manganese<br />
Clermont coal<br />
Yarwun refinery stage 2 alumina<br />
Brockman 4<br />
Kestrel coal<br />
Rocklands to Kabra rail duplication coal infrastructure<br />
Project iron ore<br />
Talc redesign<br />
South West Queensland Curragh coal Blackwater System<br />
nickel<br />
Pipeline (stages 2 and 3)<br />
Power Upgrade coal infrastructure<br />
Moomba to Sydney gas pipeline<br />
Queensland gas pipeline<br />
Duketon gold<br />
Edna May gold<br />
gas pipeline<br />
Talinga stage 2 coal seam gas<br />
St Ives (Athena underground) gold<br />
Brisbane<br />
Cameby Down coal<br />
Boggabri opencut coal<br />
Mt Weld rare earths<br />
Brisbane coal terminal expansion<br />
Mount Arthur coal<br />
Darling Range Super Pit gold Eucla Basin<br />
Narrabri (stage 1) coal<br />
North DSO<br />
mineral sands Honeymoon Moolarben stage 1 coal<br />
Minimbah Bank Third Rail Line (stage 1)<br />
bauxite Aldiss/Randalls<br />
uranium<br />
Northparkes<br />
coal infrastructure<br />
Perth (phase 1) gold<br />
Snapper E48 copper<br />
Blakefield South coal<br />
mineral<br />
Mangoola coal<br />
Adelaide sands<br />
Sydney Kooragang island coal terminal<br />
Cadia East gold<br />
Canberra expansions<br />
Newcastle export terminal coal infrastructure<br />
Mount Cattlin<br />
lithium<br />
Melbourne<br />
Metropolitan longwall coal<br />
Eastern gas pipeline<br />
BassGas<br />
Turrum gas<br />
(Yolla Mid Life Enhancement)<br />
Kipper (stage 1) gas<br />
natural gas<br />
proposed gas pipeline<br />
capital city<br />
Micro<br />
LNG plant<br />
Hobart<br />
Source: Lampard 2010<br />
As Table 1 shows, Western Australia’s 29 advanced projects account for $86 billion worth of<br />
investment (79 per cent). Projects include Gorgon LNG, Pluto LNG, BHP Billiton’s Rapid Growth<br />
Project 5, North West Shelf North Rankin B, Sino Iron Project, and Worsley Efficiency and<br />
Growth Project. The projects range in value from $2 billion to $43 billion.<br />
Table 1:<br />
Advanced projects, number, cost ($ million), sector and state and territory,<br />
April 2010<br />
Energy projects<br />
No.<br />
Cost<br />
($m)<br />
No.<br />
Mining<br />
Cost<br />
($m)<br />
Minerals<br />
processing<br />
No.<br />
Cost<br />
($m)<br />
No.<br />
Total<br />
Cost<br />
($m)<br />
Western Australia 6 64,111 21 19,688 2 2,620 29 86,419<br />
Queensland* 16 6,807 3 1,646 3 2,860 22 11,313<br />
New South Wales* 13 5,158 3 2,232 0 0 16 7,390<br />
Northern Territory 2 795 0 0 0 0 2 795<br />
South Australia 1 138 1 390 0 0 2 528<br />
Victoria 2 2,670 0 0 0 0 2 2,670<br />
Tasmania 1 345 0 0 1 150 2 495<br />
Australia 41 80,024 28 23,956 6 5,630 75 109,610<br />
Source: <strong>Taskforce</strong> analysis of Lampard 2010<br />
* Some projects cross state borders<br />
4 | <strong>National</strong> <strong>Resources</strong> <strong>Sector</strong> <strong>Employment</strong> <strong>Taskforce</strong>: <strong>Technical</strong> <strong>Paper</strong>
ABARE’s list also identifies 286 less advanced projects with a value of $249.9 billion. Projects<br />
in this category are either undergoing a feasibility study or have not yet been subject to a<br />
Final Investment Decision.<br />
Figure 2 shows less advanced projects are spread more broadly across Australia, although<br />
64 per cent are split between Western Australia and Queensland.<br />
Figure 2: Less advanced projects–state share Australia, April 2010<br />
100<br />
90<br />
80<br />
90<br />
91<br />
Number of projects<br />
70<br />
60<br />
50<br />
40<br />
30<br />
20<br />
51<br />
20<br />
22<br />
10<br />
0<br />
8<br />
4<br />
Western Australia Queensland * New South Wales* Northern Territory South Australia Victoria<br />
Tasmania<br />
States and territories<br />
* some projects cross state borders<br />
Source: <strong>Taskforce</strong> analysis of ABARE unpublished data<br />
2.2 Project timing<br />
The ABARE list contains an expected operations commencement date but not a construction<br />
commencement date. For the purpose of this section the <strong>Taskforce</strong> relied on additional sources<br />
(including companies, state governments and submissions) and made some assumptions<br />
about the length of time required for particular activities. The <strong>Taskforce</strong> has assumed the<br />
construction of a LNG train takes three years and construction of mining operations takes<br />
18 months.<br />
Figure 3 shows when the advanced and less advanced projects identified by ABARE are likely<br />
to commence construction and the expected construction duration. Production is assumed to<br />
commence immediately upon completion of construction.<br />
<strong>National</strong> <strong>Resources</strong> <strong>Sector</strong> <strong>Employment</strong> <strong>Taskforce</strong>: <strong>Technical</strong> <strong>Paper</strong> | 5
Appendix IV—Schedule of advanced and less<br />
advanced projects by state<br />
Figure 3: Scheduling for advanced and less advanced projects<br />
Pluto (train 1) - WA<br />
WA<br />
NWS CWLH - WA<br />
QLD<br />
Reindeer gas field/Devil Creek gas processing plant (phase 1) - WA<br />
Mt Cattlin - WA<br />
NSW<br />
Duketon Gold Project - WA<br />
NT<br />
Edna May - WA<br />
SA<br />
Karara hematite mine - WA<br />
Kwinana TiO2 pigment plant (stage 1) - WA<br />
VIC<br />
Nicholas Downs - WA<br />
TAS<br />
Nullagine iron ore project - WA<br />
Super Pit - WA<br />
Mt Weld - WA<br />
Hamersley Iron Brockman 4 project (Phase A) - WA<br />
Dampier–Bunbury gas pipeline (DBNGP) expansion (Stage 5B) - WA<br />
Aldiss/Randalls (phase 1) - WA<br />
Darling Range North DSO - WA<br />
Utah Point Berth Project - WA<br />
Chichester Hub 55 - WA<br />
Karara magnetite mine - WA<br />
Sino Iron Project - WA<br />
Extension Hill Direct Shipping Ore (DSO) project - WA<br />
NWS North Rankin B - WA<br />
St Ives (Athena underground) - WA<br />
Talc Redesign Project (Mount Keith) - WA<br />
Western Australian Iron Ore infrastructure - WA<br />
Western Australian Iron Ore Rapid Growth Project 5 (RGP5) - WA<br />
Worsley refinery Efficiency and Growth project (Worsley Alumina Development Capital Projects) - WA<br />
Gorgon LNG - WA<br />
Argyle underground development (diamonds) - WA<br />
Halyard - WA<br />
Coniston / Novaro (tie back to Van Gogh) - WA<br />
Pluto (train 2 and 3) - WA<br />
Abydos iron ore project - WA<br />
Brunello / Julimar (supply for Wheatstone LNG project) - WA<br />
Macedon - WA<br />
Scarborough Gas - WA<br />
South Laverton (Stage 2) - WA<br />
Windimurra vanadium project - WA<br />
Yilgarn iron ore project stage 1 (Carina) - WA<br />
Dongara - WA<br />
Bundarra - WA<br />
Koongie Zinc Copper Project - WA<br />
Leonora Gold project - WA<br />
Norseman Gold project - WA<br />
Paddington (Enterprise) - WA<br />
Parker Range iron ore project - WA<br />
Phillips River - WA<br />
Railway Iron Ore Project - WA<br />
Lennard Shelf - WA<br />
Murchison - WA<br />
Murrin Murrin Heap Leach Expansion project - WA<br />
Keysbrook - WA<br />
Nullagine Gold project - WA<br />
Balla Balla project (Phase I) - WA<br />
Balmoral South magnetite project (stage 1) - WA<br />
Yilgarn rail project - WA<br />
Barrambie vanadium project - WA<br />
Bill Hill - WA<br />
Canegrass - WA<br />
Cosmos Project (includes Alec Mairs 2 deposits) - WA<br />
Darling Range South DSO - WA<br />
Extension Hill magnetite project - WA<br />
Spotted Quoll (underground) - WA<br />
Gullewa (Deflector gold- copper project) - WA<br />
Jack Hills project (stage 2) - WA<br />
Browse LNG development - WA<br />
Anketell Point port - WA<br />
Burrup ammonium nitrate plant - WA<br />
Canning Basin project - WA<br />
Chichester Hub 95 - WA<br />
Marillana - WA<br />
Lake Maitland / JAURD / Itochu - WA<br />
Ichthys gasfield (incl Darwin LNG plant) - WA<br />
NiWest Nickel Laterite Heap Leach project - WA<br />
Panorama (Sulphur Springs) zinc-copper open cut - WA<br />
Perseverance Deeps - WA<br />
Port Hedland - WA<br />
Roy Hill (includes mine, rail and port) - WA<br />
Southdown Magnetite iron ore project - WA<br />
Tropicana Joint Venture Project - WA<br />
Weld Range - WA<br />
West Pilbara - WA<br />
Western Australian Iron Ore Rapid Growth Project 6 (RGP6) - WA<br />
Wiluna Uranium Project - WA<br />
Yalgoo Iron Project - WA<br />
6 | <strong>National</strong> <strong>Resources</strong> <strong>Sector</strong> <strong>Employment</strong> <strong>Taskforce</strong>: <strong>Technical</strong> <strong>Paper</strong><br />
2010 2014 2018
Marillana - WA<br />
Lake Maitland / JAURD / Itochu - WA<br />
Ichthys gasfield (incl Darwin LNG plant) - WA<br />
NiWest Nickel Laterite Heap Leach project - WA<br />
Panorama (Sulphur Springs) zinc-copper open cut - WA<br />
Perseverance Deeps - WA<br />
Port Hedland - WA<br />
Roy Hill (includes mine, rail and port) - WA<br />
Southdown Magnetite iron ore project - WA<br />
Tropicana Joint Venture Project - WA<br />
Weld Range - WA<br />
West Pilbara - WA<br />
Western Australian Iron Ore Rapid Growth Project 6 (RGP6) - WA<br />
Wiluna Uranium Project - WA<br />
Yalgoo Iron Project - WA<br />
Dampier Nitrogen project (ammonia/urea/ ammonium nitrate) - WA<br />
East Pilbara Project (Robertson Range and Davidson Creek) - WA<br />
Kemerton alumina refinery - WA<br />
Oakajee Port & Rail infrastructure - WA<br />
Yeelirrie - WA<br />
Prelude (floating LNG) - WA<br />
Wheatstone LNG - WA<br />
Admiral Bay - WA<br />
Great Northern Pipeline - WA<br />
Hardey - WA<br />
Lindsays, Brilliant, Kalpini - WA<br />
Nullagine (Blue Spec) - WA<br />
Spinifex Ridge molybdenum/copper project - WA<br />
Wingellina - WA<br />
Balla Balla project (Phase II) - WA<br />
Cape Lambert port expansion - WA<br />
Hamersley Iron Brockman 4 project (Phase B) - WA<br />
Sherlock Bay - WA<br />
Solomon Hub (Stage II) - WA<br />
Sorby Hills - WA<br />
Wiluna West (stage 1) - WA<br />
Coburn - WA<br />
Kalgoorlie Nickel project - WA<br />
Ridley Magnetite project - WA<br />
Swan River (Kerrigan) kaolin project - WA<br />
Yerilla - WA<br />
Dampier–Bunbury gas pipeline (DBNGP) expansion (stage 5C) - WA<br />
Diggers South - WA<br />
Cape Lambert iron ore project - WA<br />
Solomon Hub (Stage I) - WA<br />
Western Turner Syncline - WA<br />
Balmoral South magnetite project (stage 2) - WA<br />
New Morning/ Daybreak - WA<br />
Wagerup refinery expansion – Unit 3 - WA<br />
Clermont opencut - QLD<br />
Brisbane Coal Terminal expansion - QLD<br />
Coppabella to Ingsdon rail duplication - QLD<br />
Boyne Island Smelter - QLD<br />
Queensland Gas Pipeline - QLD<br />
Talinga Stage 2 - QLD<br />
Cameby Downs - QLD<br />
Intergrated Isaac Plains Project - QLD<br />
Boyne Island Smelter - QLD<br />
Middlemount (stage 1) - QLD<br />
Abbot Point Coal Terminal X50 expansion - QLD<br />
Abbot Point Coal Terminal yard refurbishment - QLD<br />
Curragh Mine - QLD<br />
Blackwater System Power upgrade - QLD<br />
Rocklands to Kabra rail duplication - QLD<br />
Goonyella to Abbot Pt (rail) (X50) - QLD<br />
Kestrel - QLD<br />
Moranbah Ammonium Nitrate Project - QLD<br />
South West Queensland pipeline (stage 2 and 3) - QLD<br />
Charters Towers - QLD<br />
Ernest Henry underground - QLD<br />
Yarwun alumina refinery expansion (CAR Stage 2) - QLD<br />
Dingo to Walton rail duplication - QLD<br />
Fisherman's Landing LNG project - QLD<br />
Anduramba Molybdenum - QLD<br />
Aurukun bauxite mine - QLD<br />
Black Star Open Cut Deeps - QLD<br />
Daunia - QLD<br />
Westmoreland - QLD<br />
Lucky Break - QLD<br />
Micro LNG plant - QLD<br />
Olive Downs North - QLD<br />
Rocklands Copper project - QLD<br />
Middlemount (stage 2) - QLD<br />
Mt Garnet - QLD<br />
North Queensland nickel-cobalt project (Nornico - stage 1) - QLD<br />
Roseby Copper project (phase 1) - QLD<br />
Lions Way pipeline - QLD<br />
Ensham bord and pillar underground mine - QLD<br />
Agate Creek - QLD<br />
Einasleigh Copper project - QLD<br />
Curtis LNG project - QLD<br />
Gladstone LNG project - QLD<br />
Shell Australia LNG - QLD<br />
Cloncurry Copper project - QLD<br />
Drake Coal project - QLD<br />
Surat Basin Rail (Southern Missing Link) - QLD<br />
Surat Gas Project - QLD<br />
Washpool coal project - QLD<br />
<strong>National</strong> <strong>Resources</strong> <strong>Sector</strong> <strong>Employment</strong> <strong>Taskforce</strong>: <strong>Technical</strong> <strong>Paper</strong> | 7
North Queensland nickel-cobalt project (Nornico - stage 1) - QLD<br />
Roseby Copper project (phase 1) - QLD<br />
Lions Way pipeline - QLD<br />
Ensham bord and pillar underground mine - QLD<br />
Agate Creek - QLD<br />
Einasleigh Copper project - QLD<br />
Curtis LNG project - QLD<br />
Gladstone LNG project - QLD<br />
Shell Australia LNG - QLD<br />
Cloncurry Copper project - QLD<br />
Drake Coal project - QLD<br />
Surat Basin Rail (Southern Missing Link) - QLD<br />
Surat Gas Project - QLD<br />
Washpool coal project - QLD<br />
Mount Morgan tailings project - QLD<br />
Valhalla - QLD<br />
China First Coal project (Waratah Galilee) - QLD<br />
George Fisher - QLD<br />
Grosvenor underground - QLD<br />
Hail Creek expansion - QLD<br />
Byerwen Coal Project - QLD<br />
Abbot Point Coal Terminal X110 expansion - QLD<br />
Alpha Coal Project - QLD<br />
Australian Iron and Steel Project (stage 1) - QLD<br />
CHALCO alumina refinery (linked to Aurukun bauxite mine) - QLD<br />
Caval Ridge (Peak Downs expansion) - QLD<br />
Dugald River - QLD<br />
Lady Loretta - QLD<br />
Lake Vermont - QLD<br />
Moura Link - Aldoga Rail - QLD<br />
Fisherman's Landing LNG project - QLD<br />
Kevin's Corner - QLD<br />
Marborough Heap Leach project - QLD<br />
Mount Carbine - QLD<br />
Roseby Copper project (phase 2) - QLD<br />
Surat Basin to Gladstone pipeline - QLD<br />
Walloon gas field - QLD<br />
Weipa - QLD<br />
Wiggins Island Coal Terminal (stage 1) - QLD<br />
Wilkie Creek - QLD<br />
Wonbindi - QLD<br />
Woori - QLD<br />
Australia Pacific LNG - QLD<br />
Balaclava Island coal terminal - QLD<br />
Eagle Downs (Peak Downs East underground) - QLD<br />
Hay Point Coal Terminal Phase 3 - QLD<br />
Jellinbah East - QLD<br />
Moranbah South project - QLD<br />
New Acland (stage 4) - QLD<br />
North Queensland nickel-cobalt project (Nornico - stage 2) - QLD<br />
QAL refinery expansion - QLD<br />
Red Hill underground - QLD<br />
Sarum - QLD<br />
Wandoan opencut - QLD<br />
Australian Iron and Steel Project (stage 2) - QLD<br />
Codrilla - QLD<br />
Ellensfield coal mine project - QLD<br />
Monto coal mine (stage 1) - QLD<br />
Pisolite Hills - QLD<br />
Abbot Point Coal Terminal X80 expansion - QLD<br />
Gladstone Nickel project (stage 1) - QLD<br />
Georgina Basin Phosphate project - QLD<br />
Kunioon - QLD<br />
Mt Carlton (Silver Hill) - QLD<br />
Watershed Tungsten project - QLD<br />
Belvedere underground - QLD<br />
Millennium expansion - QLD<br />
Wiggins Island Coal Terminal (stage 2) - QLD<br />
Mungana & Red Dome - QLD<br />
Vermont East/Wilunga - QLD<br />
Winchester South - QLD<br />
Central Queensland gas pipeline - QLD<br />
Gladstone Nickel project (stage 2) - QLD<br />
Dawson South (stage 2) - QLD<br />
Ensham Central longwall underground - QLD<br />
Goonyella Riverside Expansion - QLD<br />
Monto coal mine (stage 2) - QLD<br />
Wiggins Island Coal Terminal (stage 3) - QLD<br />
Minimbah Bank Third Rail Line (stage 1) - NSW<br />
Moolarben stage 1 - NSW<br />
Eastern Gas Pipeline* - NSW<br />
Kooragang Island coal terminal expansion - NSW<br />
Moomba to Sydney* - NSW<br />
Narrabri Coal Project (stage 1) - NSW<br />
NCIG export terminal (Newcastle Coal Infrastructure Group) - NSW<br />
Northparkes (E48 development) - NSW<br />
Snapper (stage 2 of Pooncarie mineral sands project) - NSW<br />
Blakefield South - NSW<br />
Mount Arthur opencut (MAC20) - NSW<br />
Kooragang Island coal terminal expansion - NSW<br />
Mangoola (Anvil Hill opencut) - NSW<br />
Metropolitan longwall - NSW<br />
Cadia East - NSW<br />
Boggabri opencut - NSW<br />
8 | <strong>National</strong> <strong>Resources</strong> <strong>Sector</strong> <strong>Employment</strong> <strong>Taskforce</strong>: <strong>Technical</strong> <strong>Paper</strong><br />
Bickham opencut - NSW<br />
Hera - NSW<br />
Hunter Valley Operations Expansion - NSW<br />
Camden Gas Project stage 3 (coal seam gas) - NSW
NCIG export terminal (Newcastle Coal Infrastructure Group) - NSW<br />
Northparkes (E48 development) - NSW<br />
Snapper (stage 2 of Pooncarie mineral sands project) - NSW<br />
Blakefield South - NSW<br />
Mount Arthur opencut (MAC20) - NSW<br />
Kooragang Island coal terminal expansion - NSW<br />
Mangoola (Anvil Hill opencut) - NSW<br />
Metropolitan longwall - NSW<br />
Cadia East - NSW<br />
Boggabri opencut - NSW<br />
Bickham opencut - NSW<br />
Hera - NSW<br />
Hunter Valley Operations Expansion - NSW<br />
Camden Gas Project stage 3 (coal seam gas) - NSW<br />
Minimbah Bank Third Rail Line (stage 2) - NSW<br />
Cowal - NSW<br />
ERMS synthetic rutile plant - NSW<br />
Gloucester Coal Seam gas project - NSW<br />
South East opencut - NSW<br />
Kooragang Island ammonium nitrate facility - NSW<br />
Majors Creek - NSW<br />
Mount Arthur North underground - NSW<br />
Narrabri Coal Project (stage 2) - NSW<br />
Rasp mine project - NSW<br />
Tomingley (Wyoming) gold project - NSW<br />
Gloucester Coal Seam Gas pipeline - NSW<br />
2 Export Terminal Arrival Tracks - NSW<br />
Nundah Bank 3rd Road (rail) - NSW<br />
Camden Gas Project stage 2 (coal seam gas) - NSW<br />
Drayton mine extension - NSW<br />
Dubbo Zirconia project - NSW<br />
Kempfield - NSW<br />
Ulan West - NSW<br />
Western Rail Coal Unloader - NSW<br />
Wongawilli Colliery - NSW<br />
Maules Creek - NSW<br />
Austar underground (Stage 3) - NSW<br />
Bowden’s silver project - NSW<br />
Casino project - NSW<br />
Newstead to Bulla Park* - NSW<br />
Prungle (Karra) - NSW<br />
Queensland–Hunter gas pipeline* - NSW<br />
Twelve Mile - NSW<br />
Woodlawn tailings retreatment project - NSW<br />
Woodlawn underground redevelopment - NSW<br />
Liverpool Range rail project - NSW<br />
Mount Pleasant Project - NSW<br />
Ravensworth North - NSW<br />
Wallarah underground longwall - NSW<br />
Kingsgate Molybdenum-Bismuth project - NSW<br />
Moorilda (McPhillamys) - NSW<br />
North Mine Deeps - NSW<br />
Saddler's Creek underground and opencut - NSW<br />
Copper Hill project - NSW<br />
Duralie Extension project - NSW<br />
NRE No. 1 Colliery - NSW<br />
Warkworth extension - NSW<br />
NRE No. 1 Colliery (preliminary works project) - NSW<br />
Potosi (stages 2 and 3) - NSW<br />
Wellington Power Station Pipeline - NSW<br />
Moolarben (stage 2) - NSW<br />
Kitan - NT<br />
Montara/Skua oilfield - NT<br />
Puffin oil field - NT<br />
Talbot oil field - NT<br />
Condensate processing facility - NT<br />
Crux liquids project - NT<br />
Central Tanami - NT<br />
Molyhil (tungsten) - NT<br />
Wonarah Phosphate Rock Project - NT<br />
Ranger pit extension - NT<br />
Nolans project - NT<br />
Redbank Copper project - NT<br />
Bigrlyi - NT<br />
Timor Sea LNG project - NT<br />
Darwin iron ore berth - NT<br />
Sunrise Gas project - NT<br />
Bonaparte LNG (floating) - NT<br />
Tassie Shoal methanol project - NT<br />
Browns Sulphide project (expansion of Browns Oxide project) - NT<br />
Ranger heap leach facility - NT<br />
Tanami project - NT<br />
Mt Todd - NT<br />
Eucla Basin (Jacinth and Ambrosia deposits) - SA<br />
Honeymoon - SA<br />
Crocker Well and Mount Victoria - SA<br />
Kanmantoo - SA<br />
Four Mile - SA<br />
Kalkaroo - SA<br />
Oban ISR operation - SA<br />
Willcherry Hill (Stage 1) - SA<br />
Peculiar Knob - SA<br />
Port Bonython Fuel storage - SA<br />
Port Lincoln - SA<br />
Port Bonython - SA<br />
Cairn Hill iron ore copper gold project - SA<br />
Willcherry Hill (Stage 2) - SA<br />
Mutooroo - SA<br />
<strong>National</strong> <strong>Resources</strong> <strong>Sector</strong> <strong>Employment</strong> <strong>Taskforce</strong>: <strong>Technical</strong> <strong>Paper</strong> | 9
Honeymoon - SA<br />
Crocker Well and Mount Victoria - SA<br />
Kanmantoo - SA<br />
Four Mile - SA<br />
Kalkaroo - SA<br />
Oban ISR operation - SA<br />
Willcherry Hill (Stage 1) - SA<br />
Peculiar Knob - SA<br />
Port Bonython Fuel storage - SA<br />
Port Lincoln - SA<br />
Port Bonython - SA<br />
Cairn Hill iron ore copper gold project - SA<br />
Willcherry Hill (Stage 2) - SA<br />
Mutooroo - SA<br />
Mt Gee - SA<br />
Mt Gunson - SA<br />
Reliance deposit - SA<br />
Hawks Nest Magnetite Project - SA<br />
Olympic Dam expansion stage 1 - SA<br />
Olympic Dam expansion stage 2 - SA<br />
Olympic Dam optimisation - SA<br />
Olympic Dam Smelter expansion - SA<br />
Olympic Dam expansion stage 3 - SA<br />
Kipper gas project (stage 1) - VIC<br />
Turrum - VIC<br />
West Seahorse - VIC<br />
Donald - VIC<br />
Latrobe magnesium project - VIC<br />
Monash Energy project - VIC<br />
Kipper gas project (stage 2) - VIC<br />
Basker, Manta and Gummy oil development - VIC<br />
Basker, Manta and Gummy gas development - VIC<br />
WIM 150 zircon/ titanium project - VIC<br />
Micro LNG plant - TAS<br />
BassGas (Yolla Mid Life Enhancement) - TAS<br />
Barnes Hill - TAS<br />
King Island Scheelite mine redevelopment - TAS<br />
Mt Lindsay - TAS<br />
Renison Expansion Project (Rentails) - TAS<br />
Source: <strong>Taskforce</strong> analysis of ABARE unpublished data<br />
10 | <strong>National</strong> <strong>Resources</strong> <strong>Sector</strong> <strong>Employment</strong> <strong>Taskforce</strong>: <strong>Technical</strong> <strong>Paper</strong>
3. Demand for labour and skills<br />
The <strong>Taskforce</strong> was asked to undertake an analysis of the resources sector’s labour and skills<br />
needs on a national basis over the next five years. Acknowledging that the number and scale<br />
of projects and the uncertainty of timing can affect projections, the <strong>Taskforce</strong> has:<br />
• modelled three growth scenarios for construction of resources projects—low, medium<br />
and high, based on the value of construction likely to go ahead<br />
• examined trends in demand for resources, as this will be a key influence on demand<br />
for skills, in the construction and operations phases of resources sector projects<br />
• modelled four growth scenarios for the gas sector—based on six, 10, 14 or 16 trains<br />
being built<br />
• estimated labour wastage (replacement demand) for the mining operations and<br />
gas sectors at 10 per cent per annum, noting it is estimated retirements will account<br />
for 2 per cent per annum. The <strong>Taskforce</strong> did not model replacement demand for<br />
the construction sector, noting the average employment in the four quarters to<br />
February 2010 in the construction workforce is 981,800 (ABS 2010a) and the resources<br />
construction workforce is a small portion of this overall workforce<br />
• tested the outcomes with the Western Australian and Queensland state governments<br />
and industry associations<br />
• reviewed advice from industry reports, its industry survey, consultations and<br />
submissions about the extent of skills demand.<br />
The modelling suggests the:<br />
• number of short-term construction jobs is likely to peak at around 45,000 during<br />
2012 and 2013, with strong jobs growth for technicians, tradespeople and machinery<br />
operators and drivers<br />
• number of new jobs in mining operations is expected to increase by 4.9 per cent per<br />
annum, creating around 61,500 new jobs by 2015<br />
• replacement demand in mining operations could be around 16,000 people per annum,<br />
including approximately 3,000 people retiring per year<br />
• the number of new jobs in gas operations will be between 1,800 and 3,200. There will<br />
be strong jobs growth for drillers (Queensland only), operators, electrical trades and<br />
mechanical technicians<br />
• replacement demand in gas operations could be around 2,000 people per annum,<br />
including approximately 500 people retiring per year.<br />
Modelling outcomes were discussed with the Western Australian Department of Training and<br />
Workforce Development on 19 May 2010, and the Queensland Department of <strong>Employment</strong>,<br />
Economic Development and Innovation, and the Queensland Department of Education and<br />
Training, on 25 May 2010. Both states supported the methodology used and considered the<br />
modelling outcomes broadly consistent with their own analysis.<br />
<strong>National</strong> <strong>Resources</strong> <strong>Sector</strong> <strong>Employment</strong> <strong>Taskforce</strong>: <strong>Technical</strong> <strong>Paper</strong> | 11
3.1 Trends in demand for resources<br />
Demand for labour in the resources sector depends on the demand for resources. There<br />
are two distinct elements: demand for labour for the construction phase and for the<br />
operation phase.<br />
Much of the demand for resources comes from export markets, so developments in those<br />
markets have a major influence on demand and, in turn, demand for skills. The Reserve Bank<br />
of Australia (RBA) and the Australian Treasury have recently drawn attention to strong current,<br />
and likely future, overseas demand for resources sector products.<br />
In its May 2010 Statement on Monetary Policy, the RBA noted mining investment has been at<br />
record levels as a share of GDP, with further increases expected:<br />
…outlook for mining sector investment has strengthened over the past year,<br />
underpinned by further large increases in bulk commodity prices and an expectation<br />
that demand for raw materials from China and other emerging economies will grow<br />
solidly in the medium term. Mining investment is at a historically high level, well above<br />
the peaks of previous mining booms in the early 1980s and the late 1960s and early<br />
1970s, supported by large projects in the oil and gas, coal and minerals sectors.<br />
Figure 4 shows the growth of mining investment as illustrated by the value of mining<br />
engineering done over the past 20 years.<br />
RBA, 2010<br />
Figure 4: Mining engineering work done, per cent of nominal GDP, 1987–2009<br />
1<br />
0.8<br />
0.6<br />
0.4<br />
0.2<br />
0<br />
Jun-87<br />
Jun-89<br />
Jun-91<br />
(per cent)<br />
Jun-93<br />
Jun-95<br />
Jun-97<br />
Jun-99<br />
Jun-01<br />
Jun-03<br />
Jun-05<br />
Jun-07<br />
Jun-09<br />
Date<br />
Coal Oil and gas Minerals<br />
Sources: RBA analysis of ABS; RBA 2010<br />
12 | <strong>National</strong> <strong>Resources</strong> <strong>Sector</strong> <strong>Employment</strong> <strong>Taskforce</strong>: <strong>Technical</strong> <strong>Paper</strong>
The RBA suggested this large pipeline of work would result in a further substantial increase<br />
in mining investment over coming years. For its part, Treasury forecast new business<br />
investment will rise by 7 per cent in 2010–11, and by 12.5 per cent in 2011–12. Investment in<br />
machinery and equipment, and in engineering construction is expected to drive the recovery<br />
in business investment. Treasury noted mining-related investment is expected to drive this<br />
investment in engineering construction, with extremely robust growth of 19 per cent forecast<br />
in 2010–11 and 20.5 per cent in 2011–12. With strong growth expected in the LNG sector, and<br />
further major resource projects in the pipeline, Treasury anticipates engineering construction<br />
investment will continue to grow significantly as a share of total business investment over<br />
coming years (RBA 2010).<br />
Treasury further noted there are currently around a dozen large-scale LNG projects under<br />
construction, or active consideration in Australia, which have the potential to increase<br />
Australia’s LNG production capacity fourfold – although it should be noted that Australia has<br />
never before supported construction of more than two gas trains concurrently and such an<br />
expansion has never occurred anywhere in the world beyond Qatar.<br />
3.2 Demand for construction labour and skills<br />
3.2.1 Modelling approach<br />
DEEWR prepares annual updates of employment projections for industries for each five-year<br />
period, the latest being to 2014–15. The projections are an annual average for the five years.<br />
These are based in part on economic models, including models by Access Economics and the<br />
Monash model developed by the Centre of Policy Studies at Monash University, but also take<br />
into account recent employment trends and prospective industry developments. In the five<br />
years to 2014–2015, projections show employment in the construction industry growing at an<br />
average rate of 2.4 per cent per year. This compares with an average annual growth rate of<br />
1.8 per cent across all industries over the same period (DEEWR 2010a).<br />
However, the scale of investment in resources projects has grown dramatically in recent<br />
years. As noted by Richardson (2010), in real terms the volume of engineering construction in<br />
Australia increased from $9.5 billion in 2000–01 to $47.6 billion in 2008–09. The anticipated<br />
scale of resources sector project construction in the next five years identified by ABARE and<br />
considered by the RBA in its May 2010 statement on monetary policy and by Treasury in the<br />
2010–11 Budget papers is unprecedented.<br />
This suggests using employment projections for the whole construction sector, to estimate<br />
potential growth in resources construction, would be inappropriate.<br />
The <strong>Taskforce</strong> has therefore modelled an alternative approach to estimating the demand for<br />
labour over the next five years. It involved using a typical construction industry occupational<br />
profile for a given value of construction and then applying it to the expected value of major<br />
resources project construction activity as identified by ABARE. The latest data suggests 958<br />
employees are required per $1 billion expenditure on heavy engineering construction.<br />
<strong>National</strong> <strong>Resources</strong> <strong>Sector</strong> <strong>Employment</strong> <strong>Taskforce</strong>: <strong>Technical</strong> <strong>Paper</strong> | 13
Three growth scenarios were modelled for construction employment—low, medium and high<br />
based on the known value of construction (283 projects have a value and 78 projects have<br />
no value attributed to them). The <strong>Taskforce</strong> considers projects with no listed value may not<br />
commence construction by 2015 (ABARE unpublished data):<br />
• The low-growth scenario is based on all advanced projects proceeding (75 projects).<br />
• The medium-growth scenario is based on all advanced projects plus 27 per cent of the<br />
value of less advanced projects (ie 50 per cent of the value of all projects on the ABARE<br />
database) proceeding.<br />
• The high-growth scenario is based on all advanced projects plus 63.5 per cent of the<br />
value of less advanced projects (ie 75 per cent of the value of all projects on the ABARE<br />
database) proceeding.<br />
The <strong>Taskforce</strong> then projected on this basis against the anticipated value of major resources<br />
projects and assumed demand for skills, at an occupational level (see Appendix I), that mirrors<br />
recent overall employment in engineering construction. Modelling includes the small number<br />
of projects likely to commence construction in 2016.<br />
3.3 Modelling outcomes<br />
It is important to note construction jobs on resources projects can last from a few months to a<br />
few years, and over the period 2010–2016 construction workers are likely to have a number of<br />
jobs as they move from project to project. Overall projections for employment are as follows:<br />
• low-growth scenario with a peak of around 30,000 jobs during 2010 and 2011 and<br />
102,000 short-term project jobs over the period 2010 to 2016<br />
• medium-growth scenario with a peak of around 45,000 jobs during 2012 and 2013 and<br />
170,000 short-term project jobs over the period 2010 to 2016<br />
• high-growth scenario with a peak of around 70,000 jobs during 2012 and 2013 and<br />
255,000 short-term project jobs over the period 2010 to 2016.<br />
14 | <strong>National</strong> <strong>Resources</strong> <strong>Sector</strong> <strong>Employment</strong> <strong>Taskforce</strong>: <strong>Technical</strong> <strong>Paper</strong>
Demand for labour by year for project construction<br />
Figure 5 gives estimates of the potential number of construction workers required by the<br />
resources sector by year according to planned project capital expenditure over 2010 to 2015.<br />
For each of the projects the <strong>Taskforce</strong> estimated the construction periods using both known<br />
and estimated dates of operation and number of construction workers by capital expenditure.<br />
The <strong>Taskforce</strong> suggests the medium-growth scenario is most likely. It notes 60 of the 75<br />
advanced projects are already under construction, and the remaining 15 are committed and<br />
generally expected to commence construction within the next two years. In terms of the<br />
less advanced projects, history indicates many are delayed as they go through the various<br />
approvals processes leading to a Final Investment Decision. Under this scenario, employment<br />
will gather momentum and peak in 2012 and 2013 possibly at around 45,000 jobs. The decline<br />
in estimated construction employment from 2014 is a result of uncertainty surrounding<br />
forward project activity and not necessarily indicative that construction activity will slow<br />
dramatically.<br />
Figure 5: Estimated construction employment by year–three growth scenarios<br />
100 000<br />
90 000<br />
80 000<br />
Number of jobs<br />
70 000<br />
60 000<br />
50 000<br />
40 000<br />
30 000<br />
20 000<br />
10 000<br />
0<br />
2010 2011 2012 2013 2014 2015<br />
Year<br />
Low growth scenario Medium growth scenario High growth scenario<br />
Source: <strong>Taskforce</strong> estimates based on ABARE unpublished data<br />
Projections by occupation—construction skills<br />
Projections by occupation are shown in Table 2. The <strong>Taskforce</strong> notes most construction jobs<br />
will be short term and workers may move from job to job. Under each scenario, most<br />
additional demand for construction skills is projected to be for technicians and tradespeople,<br />
machinery operators and drivers and labourers. The projections were modelled from a base<br />
year of 2009, the latest year where a known value of construction engineering work and a<br />
known workforce by occupation is available (ABS 2010a; ABS 2010b).<br />
<strong>National</strong> <strong>Resources</strong> <strong>Sector</strong> <strong>Employment</strong> <strong>Taskforce</strong>: <strong>Technical</strong> <strong>Paper</strong> | 15
Table 2:<br />
Projected demand for construction skills<br />
Projected short tem construction jobs<br />
over the period 2009–2016<br />
Occupation<br />
Low Medium High<br />
Managers 10,485 17,329 25,994<br />
Professionals 10,137 16,755 25,133<br />
Technicians and tradespeople 23,664 39,112 58,668<br />
Community and personal service workers 234 386 579<br />
Clerical and administrative workers 12,596 20,819 31,229<br />
Sales workers 842 1,391 2,086<br />
Machinery operators and drivers 21,892 36,184 54,275<br />
Labourers 21,452 35,456 53,184<br />
Other 1,679 2,776 4,163<br />
TOTAL 102,981 170,209 255,313<br />
Sources: <strong>Taskforce</strong> analysis of ABS 2010a and ABS 2010b<br />
Detailed projections by occupation arising from major project construction activity against<br />
this methodology are presented at Appendix I. Over the projection period, for all scenarios,<br />
there is likely to be strong demand for fabrication engineering tradespeople (including<br />
welders) plumbers, mechanical engineering tradespeople, electronics and telecommunications<br />
tradespeople and electricians. The projections also suggest strong demand for machine<br />
operators and truck drivers. These jobs will become available for various periods between<br />
2010 and 2016.<br />
Under the <strong>Taskforce</strong>’s medium-growth scenario, the maximum number of labourers required<br />
during the peak is likely to be around 9,000 (ie 20 per cent of all construction jobs).<br />
Consistency with state and territory projections for construction employment<br />
The <strong>Taskforce</strong>’s medium and high growth scenarios for construction labour demand are<br />
broadly consistent with projections prepared for the Western Australian Government by<br />
Pit Crew Management and Consulting Services (Pit Crew) and projections prepared by the<br />
Queensland Major Contractors Association (QMCA).<br />
Analysis by the Government of Western Australian<br />
The Government of Western Australian engaged Pit Crew to produce a six-monthly industry<br />
report forecasting the demand for labour on major construction and engineering projects in<br />
Western Australia over the next three to five years (the Pit Crew Report WA 2009 in Western<br />
Australia Department of Training and Workforce Development 2010).<br />
The Pit Crew report includes the outcomes of modelled construction labour demand for<br />
69 Western Australian projects with a total capital value of $169.2 billion. This includes<br />
$104.7 billion worth of projects already under construction or approved and that Pit Crew<br />
anticipates will proceed. By comparison, the ABARE database identifies 119 Western Australian<br />
projects in the advanced and less advanced stage. Not all projects have a current known value<br />
(ABARE 2010a).<br />
16 | <strong>National</strong> <strong>Resources</strong> <strong>Sector</strong> <strong>Employment</strong> <strong>Taskforce</strong>: <strong>Technical</strong> <strong>Paper</strong>
Figure 6 shows Pit Crew’s total construction labour demand forecast in December 2009<br />
compared to previous forecasts. If current forecast labour demand is correct, the need for<br />
labour would double from approximately 11,000 onsite now, to approximately 22,500 in late<br />
2012. The December 2007 (yellow) and June 2008 (green) lines represent previous forecasts of<br />
labour demand, which were significantly higher than actual labour demand.<br />
Figure 6: Forecast total construction labour demand in Western Australia,<br />
2009–10 to 2015–16<br />
30 000<br />
25 000<br />
Number of jobs<br />
20 000<br />
15 000<br />
10 000<br />
5 000<br />
0<br />
Jul-08<br />
Jan-09<br />
Jul-09<br />
Jan-10<br />
Jul-10<br />
Jan-11<br />
Jul-11<br />
Jan-12<br />
Jul-12<br />
Jan-13<br />
Jul-13<br />
Jan-14<br />
Jul-14<br />
Jan-15<br />
Date<br />
Dec-09 Dec-07 Jun-08 Jan-09 Jun-09<br />
Source: The Pit Crew Report WA 2009 in WA Department of Training and Workforce Development 2010<br />
Projections by Heuris Partners support the views of Pit Crew and the <strong>Taskforce</strong>, suggesting the<br />
workforce required in the Pilbara for resources construction will be 22,000 in 2010, rising to<br />
28,000 in 2012. In 2009 it was around 13,000 (Waller 2010).<br />
Analysis by the Queensland Major Contractors Association<br />
In April 2010, the Queensland Major Contractors Association (QMCA) noted the huge<br />
emerging demand arising from planned resources and energy sector projects for<br />
Queensland (QMCA 2010).<br />
QMCA stated that by 2011–2012, there will be significant potential for privately<br />
funded resource and energy sector projects to ‘fill the gap’ left by the anticipated<br />
reduction in public sector investment. The QMCA 2010 Major Projects List assumed<br />
a number of sizeable projects commencing in the coal seam methane to liquefied<br />
natural gas (CSM-LNG), mining, ports, rail and resources sectors. QMCA noted at the<br />
time of publication a significant level of uncertainty about the likely timing of Final<br />
Investment Decisions for a number of these projects.<br />
<strong>National</strong> <strong>Resources</strong> <strong>Sector</strong> <strong>Employment</strong> <strong>Taskforce</strong>: <strong>Technical</strong> <strong>Paper</strong> | 17
The outcome of the QMCA’s analysis for Queensland is shown in Figure 7.<br />
Figure 7: 2010 Major projects workforce demand—Queensland, 2009–10 to 2015–16<br />
25 000<br />
20 000<br />
Number of jobs<br />
15 000<br />
10 000<br />
5 000<br />
0<br />
2009-10 2010-11 2011-12 2012-13 2013-14 2014-15 2015-16<br />
Year<br />
Construction Workforce Project Staff Total <strong>Resources</strong><br />
Source: QMCA 2010<br />
Figure 7 includes expected workforce demand for resources and other construction projects.<br />
Should the current planned mine, ports, rail and resources infrastructure projects proceed<br />
in parallel with the CSM-LNG energy projects as currently predicted, QMCA suggests major<br />
contractors will need to increase their overall capacity from 10,760 employees (2010–11 fourquarter<br />
average) to 23,660 in 2012–13. Overall levels of project staff will need to increase by<br />
approximately 3,220 (120 per cent) and construction workers by 9,670 (120 per cent). QMCA<br />
also notes the steep fall off from 2013–14 is a result of uncertainty surrounding forward<br />
project activity and not necessarily indicative that construction activity will slow dramatically.<br />
The <strong>Taskforce</strong>’s medium-growth scenario is therefore broadly consistent with these state views.<br />
3.4 Mining production<br />
Demand for operational skills in mining will increase over the period to 2015 and beyond.<br />
The key to this growth is export markets, especially in Asia. For example, ABARE data indicate<br />
Australia exports around two-thirds of its coal production (ABARE 2010).<br />
The world economy, including Australia’s key Asian export markets, appears to be<br />
strengthening. In its May 2010 statement on monetary policy, the RBA observed ‘the IMF<br />
[International Monetary Fund] now forecasts world output to expand by around 4 ¼ per cent<br />
in 2010, with a similar expansion in 2011’ (RBA 2010).<br />
The RBA also noted ‘the recovery in Asia has been particularly strong, and growth has also<br />
picked up in other emerging countries’ and stated ‘momentum in the Chinese economy<br />
remains strong and has shown few signs of slowing recently’. In the 2010–11 Budget papers,<br />
Treasury also noted strengthening commodity demand has been driven by a recovery in global<br />
industrial production.<br />
18 | <strong>National</strong> <strong>Resources</strong> <strong>Sector</strong> <strong>Employment</strong> <strong>Taskforce</strong>: <strong>Technical</strong> <strong>Paper</strong>
Treasury expects export volumes will increase in line with the anticipated recovery in<br />
global economic activity and grow by 5 per cent in 2010–11 and 6 per cent in 2011–12.<br />
Exports of non-rural commodities are expected to increase by 3.5 per cent in 2009–10,<br />
8 per cent in 2010–11 and 7.5 per cent in 2011–12. Treasury also noted, according to<br />
ABARE estimates, the value of Australia’s LNG exports is projected to reach $13.5 billion<br />
by 2014–15 (Australian Treasury 2010a).<br />
Projections of output and commodity prices<br />
In March 2010, ABARE published its projections on likely trends in output and commodity<br />
prices. Appendix II lists the ABARE projections in major resource commodities over the period<br />
to 2015. These show strong growth in production, largely to serve export markets.<br />
ABARE suggests further strong growth in commodity prices. Over its outlook period to<br />
2014–15, ABARE anticipates renewed demand from emerging economies such as China<br />
and India will continue to have a significant influence over energy and minerals<br />
commodity markets.<br />
ABARE also noted:<br />
• After falling considerably in early 2009, world prices for many energy and minerals<br />
commodities are forecast to recover in 2010 and 2011, supported by the improved<br />
outlook for world economic growth and the continued weakness of the US dollar.<br />
• Beyond 2011, prices are generally projected to decline in real terms but to remain<br />
above historical averages.<br />
• In the short term, supply capacity is expected to increase, although there could be<br />
challenges, such as higher project costs, price volatility and sovereign risk in some<br />
countries.<br />
• Australian export earnings from energy and minerals are projected to increase over<br />
the medium term, from $130 billion in 2009–10 to $175 billion in 2014–15 (in 2009–10<br />
dollars), supported by recovering world demand and prices (ABARE 2010).<br />
Higher commodity prices and the anticipated strong growth in resources sector output will<br />
likely see a significant rise in demand for labour.<br />
3.5 Demand for labour and skills in mining operations<br />
(excludes gas)<br />
3.5.1 Modelling approach—mining operation skills<br />
DEEWR’s latest projections for employment growth between 2009–2010 and 2014–2015 in the<br />
mining industry are based on an average rate of 3.3 per cent per annum, which equates to<br />
around 28,000 new jobs. <strong>Employment</strong> across all industries is forecast to grow at 1.8 per cent<br />
annually in the five years to 2014–2015 (DEEWR 2010b).<br />
The <strong>Taskforce</strong> has modelled projections of potential employment growth for mining<br />
operations based on the approach used by the <strong>National</strong> Institute of Labour Studies (NILS)<br />
(Lowry et al 2006) in preparing projections of employment growth on behalf of the Chamber<br />
of Mines in Western Australia in 2006 and subsequently for the Minerals Council of Australia in<br />
2008. This model appears to project recent employment changes reasonably well.<br />
<strong>National</strong> <strong>Resources</strong> <strong>Sector</strong> <strong>Employment</strong> <strong>Taskforce</strong>: <strong>Technical</strong> <strong>Paper</strong> | 19
NILS used the basis of projections of growth in output by commodity to model employment<br />
growth (Lowry et al 2006). For example growth in employment in coal mining in the base<br />
period, 2008, is assumed to be the same as the growth in output over the projections time<br />
period. Commodity projections from ABARE, Access Economics and BIS Shrapnel were<br />
averaged to gain a ‘consensus’ view on likely growth paths.<br />
The projections for employment growth for each commodity/industry are then aggregated to<br />
get overall industry employment at the end of the projection period. The approach assumes<br />
the occupational composition of jobs in mining remains static over the projection period and<br />
there is no change in labour productivity.<br />
The <strong>Taskforce</strong> notes it is possible to assume productivity improvements through more<br />
advanced mining techniques, which would reduce employment growth. It is also possible to<br />
assume productivity could fall given many projects now target more difficult ore deposits<br />
(Richardson 2010). On balance, the <strong>Taskforce</strong> assumed no change in labour productivity in<br />
modelling employment growth.<br />
3.5.2 Modelling outcomes—mining operations skills<br />
The NILS approach (Lowry et al 2006) suggests employment growth in mining operations of<br />
61,500 from 2008 to 2015, an average annual growth rate of 4.9 per cent per annum.<br />
Table 3 presents aggregated data on likely demand by occupation, with the largest growth<br />
expected to be for professionals, technicians and tradespeople, and machinery operators.<br />
Further modelling of employment growth, disaggregated by major cities and other places of<br />
employment, suggests around 25 per cent of mining industry professional employment growth<br />
will occur in capital cities and the main growth in regional areas will be for technicians and<br />
tradespeople, and for machinery operators and drivers (<strong>Taskforce</strong> analysis, unpublished 2010).<br />
Table 3: Projected employment in mining operations, 2015<br />
Occupation<br />
Base<br />
employment<br />
(2008)<br />
<strong>Employment</strong><br />
growth<br />
Projected<br />
employment<br />
(2015)<br />
Managers 13,977 5,571 19,548<br />
Professionals 24,080 9,598 33,678<br />
Technicians and tradespeople 37,833 15,080 52,913<br />
Community and personal service workers 733 292 1,024<br />
Clerical and administrative workers 13,791 5,497 19,287<br />
Sales workers 597 238 835<br />
Machinery operators and drivers 53,621 21,372 74,993<br />
Labourers 8,140 3,244 11,384<br />
Other 1,675 667 2,342<br />
TOTAL 154,447 61,559 216,005<br />
Sources: ABS 2007; ABS 2010b<br />
Detailed projections of national demand for mining skills by occupation are presented at<br />
Appendix I. Key outcomes for technicians and tradespeople include projections of strong<br />
growth for mechanical engineering tradespeople, building and engineering technicians,<br />
20 | <strong>National</strong> <strong>Resources</strong> <strong>Sector</strong> <strong>Employment</strong> <strong>Taskforce</strong>: <strong>Technical</strong> <strong>Paper</strong>
electricians and fabrication engineering tradespeople. For machinery operators and<br />
drivers, there is likely to be strong growth in employment of stationary plant operators and<br />
truck drivers.<br />
Considered by state, the <strong>Taskforce</strong> projections suggest mining employment will rise by around<br />
25,500 in Western Australia and by around 15,000 in Queensland (see Appendix I). The<br />
projections may underestimate employment growth in resources in South Australia, where<br />
the South Australian Government’s Training and Skills Commission has estimated 5,000 new<br />
resources jobs by 2015. Empoyment growth in South Australia will depend on the timing of<br />
the expansion of the Olympic Dam Project (SATSC 2009).<br />
3.6 Gas operations<br />
3.6.1 Modelling approach—gas operations skills<br />
The main proposals for gas projects likely to be operational by 2015 are located in Western<br />
Australia and Queensland. It is not certain the proposed Inpex project in the Northern Territory<br />
will be operational by 2015.<br />
<strong>Employment</strong> growth in Western Australia and Queensland will depend on the number of<br />
LNG trains constructed by 2015, the location of trains and whether they are tied to existing<br />
infrastructure or are ‘greenfields’ projects.<br />
For employment growth in Queensland, the <strong>Taskforce</strong> has relied on modelling done by Energy<br />
Skills Queensland as it was developed in consultation with relevant project proponents. The<br />
<strong>Taskforce</strong> has forecast demand for gas operations skills in Western Australia in consultation<br />
with industry.<br />
<strong>National</strong> <strong>Resources</strong> <strong>Sector</strong> <strong>Employment</strong> <strong>Taskforce</strong>: <strong>Technical</strong> <strong>Paper</strong> | 21
3.6.2 Modelling outcomes—gas operations skills<br />
Energy Skills Queensland (ESQ) has projected new jobs growth by occupation, based on slow,<br />
moderate and rapid growth scenarios (Table 4). This modelling assumes base employment of<br />
1,000 people in all scenarios, that is, there were 1,000 people already employed in the industry<br />
in 2009.<br />
In Queensland all of the CSG/LNG projects will be greenfields. Owing to the nature of CSG<br />
technology, which requires significant numbers of drillers, each train will need between 550<br />
and 650 professional and technical staff during operations.<br />
Table 4:<br />
Energy Skills Queensland new jobs growth by occupation, Queensland,<br />
projections to 2015<br />
Occupational Groups<br />
by Skills and Activities<br />
Scenario A<br />
‘Slow Economic<br />
Growth’ 14/15 mtpa<br />
(4 Trains)<br />
Scenario B<br />
‘Moderate Economic<br />
Growth’ 22/23 mtpa<br />
(6 Trains)<br />
Scenario C<br />
‘Rapid Economic<br />
Growth’ 29/30 mtpa<br />
(8 Trains)<br />
2010 2015 2020 2010 2015 2020 2010 2015 2020<br />
ENGINEERING<br />
(Professional and<br />
Para-professional Skills) 205 340 373 341 580 630 374 715 756<br />
SCIENCE<br />
(Professional and<br />
Para-professional Skills) 73 68 75 109 103 113 124 133 149<br />
VOCATIONAL OCCUPATION<br />
(<strong>Technical</strong> Skills) 831 2,134 2,645 1,248 3,197 3,964 1,328 3,584 4,854<br />
Drilling 476 990 990 715 1,484 1,484 741 1,820 1,953<br />
Electrotechnology<br />
(Electrical) 35 146 232 53 218 347 61 253 447<br />
Field Construction 24 44 44 36 66 66 43 88 88<br />
Mechanical<br />
(Diesel Fitting) 75 201 274 113 301 410 128 309 482<br />
Process Plant Operations 190 682 1017 285 1022 1525 312 999 1724<br />
Water Management<br />
(Operations) 29 71 88 43 106 132 43 115 160<br />
VOCATIONAL OCCUPATION<br />
(Non <strong>Technical</strong> Skills) 205 378 453 306 567 680 198 677 857<br />
Occupational Health<br />
and Safety 38 84 104 56 126 156 68 154 190<br />
Cultural Heritage 67 85 80 100 127 100 82 169 162<br />
Admin/Logistics/<br />
Transport/Warehouse 100 109 269 150 314 404 148 354 505<br />
UNSKILLED LABOUR 67 134 147 100 200 222 115 253 284<br />
OTHER 0 31 58 0 47 86 0 31 91<br />
Compliance and<br />
Shutdown Teams 0 31 58 0 47 86 0 31 91<br />
TOTAL DEMAND 1,381 3,085 3,752 2,104 4,694 5,659 2,239 5,393 6,991<br />
Source: Energy Skills Queensland (ESQ) 2009<br />
22 | <strong>National</strong> <strong>Resources</strong> <strong>Sector</strong> <strong>Employment</strong> <strong>Taskforce</strong>: <strong>Technical</strong> <strong>Paper</strong>
On the basis of ESQ’s modelling, the <strong>Taskforce</strong> considers that if only two trains become<br />
operational by 2015, the number of professional and technical staff needed for operations in<br />
Queensland will be around 1,200.<br />
The <strong>Taskforce</strong> based employment projections for Western Australia on consultations with<br />
the Australian Petroleum Production & Exploration Association (APPEA) and industry<br />
representatives. Differences in the extraction process means there is a different employment<br />
profile in Western Australia.<br />
In Western Australia, the number of employees required per train will depend on the<br />
workforce model adopted (ie fly-in/fly-out (FIFO), residential or a mix of the two) and the<br />
number of greenfields projects. When an additional LNG train is built alongside an existing<br />
train (a brownfields development), it requires significantly fewer operational employees due<br />
to existing processes, work flows and team capability.<br />
Discussions with industry suggest the number of employees required for a train at a<br />
greenfields site can range from around 150 to 300 depending on whether the workforce<br />
is residential, a mix of residential and FIFO, or all FIFO. A typical workforce includes plant<br />
operators (around 50 per cent), maintenance technicians (mechanical and electrical trades —<br />
around 35 per cent) and engineering professionals and paraprofessionals (around 15 per cent).<br />
Additional trains in the same LNG brownfields development require about 10 to 20 per cent of<br />
the number of employees required for the first train.<br />
Table 5 shows the number of operational positions required by 2015 under three growth<br />
scenarios for Western Australia. Estimates assume:<br />
• The first two projects are greenfields and require 260 onsite employees per train.<br />
• The remaining projects are brownfields (additional trains in an existing site) and<br />
require between 25 and 50 employees per train.<br />
Table 5:<br />
Growth scenarios for Western Australia (4, 6 and 8 trains)<br />
Estimated employment breakdown per train<br />
Low-growth<br />
scenario<br />
(4 trains)<br />
Mediumgrowth<br />
scenario<br />
(6 trains)<br />
High-growth<br />
scenario<br />
(8 trains)<br />
Operators 300 335 375<br />
Maintenance technicians (mechanical/electrical trades) 210 235 365<br />
Engineering 90 100 110<br />
TOTAL 600 670 750<br />
Source: <strong>Taskforce</strong> analysis based on industry advice<br />
These estimates do not include supporting roles such as logistics, catering and security.<br />
The <strong>Taskforce</strong> considers it likely there will be two to four new trains operating in Queensland<br />
by 2015, and four to six new trains in Western Australia. This would create between 1,200 and<br />
2,500 professional and trade jobs in operations in Queensland and between 600 and 700 in<br />
Western Australia.<br />
<strong>National</strong> <strong>Resources</strong> <strong>Sector</strong> <strong>Employment</strong> <strong>Taskforce</strong>: <strong>Technical</strong> <strong>Paper</strong> | 23
These estimates do not account for any increase in employment in Western Australia’s offshore<br />
LNG industry. <strong>Employment</strong> growth offshore is expected to be low, so the <strong>Taskforce</strong> has not<br />
attempted to make any projections. The number of new jobs will depend on the development<br />
concepts that are approved.<br />
Companies in the gas sector predicted a growth in demand for occupations across the entire<br />
scope of operations and maintenance, as the sector rapidly expands in new fields, such as CSG.<br />
A LNG train typically takes three years to build, so the operational workforce is expected to<br />
grow significantly from 2013 to 2015.<br />
3.7 Replacement demand<br />
Over time, people leave their current jobs for jobs in the same industry (turnover) or they leave<br />
the industry for another industry or to retire (replacement demand). There is limited data<br />
available concerning these movements.<br />
Turnover<br />
SkillsDMC (2010) has estimated turnover rates for a range of sectors including drilling (29 per<br />
cent), quarrying (17 per cent), and mining (13.3 per cent).<br />
Twenty of the 34 resources companies that responded to the <strong>National</strong> <strong>Resources</strong> <strong>Sector</strong><br />
<strong>Employment</strong> <strong>Taskforce</strong> Survey answered questions about their company’s annual labour<br />
turnover rate (the <strong>Taskforce</strong> survey is included in Appendix VI):<br />
• In 2007, the rate ranged between 0 and 40 per cent, with most companies reporting<br />
rates between 5 and 20 per cent.<br />
• In 2008, the rate ranged between 1 and 85 per cent, with most companies reporting<br />
rates between 20 and 30 per cent.<br />
• In 2009, the rate ranged between 0 and 90 per cent, with most companies reporting<br />
rates between 5 and 20 per cent. Compared to 2007 and 2008, more companies<br />
reported rates of 40 per cent or higher—five companies experienced turnover rates of<br />
between 40 per cent and 90 per cent.<br />
Industry turnover rates vary substantially, including across types of workers. For example, a<br />
large resources company advised the <strong>Taskforce</strong> that turnover for its FIFO workers (up to 30 per<br />
cent per year) is double that of other employees.<br />
Potential job vacancies<br />
The concept of Gross Replacement is a measure of the amount of recruitment needed to<br />
effectively replace people leaving an occupation. A potential job vacancy can be created in<br />
three ways:<br />
• by a person leaving the job to work in another job in the same occupation<br />
(‘occupational churn’, which makes no net change to occupational employment<br />
numbers)<br />
• by a person leaving both the job and the occupation to work in another occupation,<br />
become unemployed or exit the labour force (e.g. caring duties, retirement, death,<br />
emigration etc.)<br />
• by the employer seeking to fill a new position.<br />
24 | <strong>National</strong> <strong>Resources</strong> <strong>Sector</strong> <strong>Employment</strong> <strong>Taskforce</strong>: <strong>Technical</strong> <strong>Paper</strong>
The number of people who leave jobs in a particular occupation over the course of a year,<br />
excluding the occupational churn component, is called the Gross Outflow from the occupation.<br />
This data is available on an occupation basis as shown in Table 6, not an industry basis.<br />
However, analysis of trends for major occupations in the resources sector suggests an average<br />
gross replacement rate of around 10 per cent per annum, with lower rates for the professions.<br />
Table 6:<br />
Estimates of gross replacement rates for major resources sector occupations<br />
Ocupation %<br />
Professions<br />
Trades<br />
Plant and machinery<br />
operators<br />
Chemical and materials engineers 5.3<br />
Civil engineering professionals 5.3<br />
Electrical engineers 5.3<br />
Electronics engineers 5.3<br />
Industrial, mechanical and production engineers 5.3<br />
Mining engineers 5.3<br />
Other engineering professionals 5.3<br />
Environmental scientists 9.7<br />
Geologists and geophysicists 9.7<br />
Automotive electricians 9.6<br />
Motor mechanics 9.6<br />
Metal casting, forging and finishing trades 9.7<br />
Sheetmetal tradespeople 9.7<br />
Structural steel and welding tradespeople 9.7<br />
Aircraft maintenance engineers 10.8<br />
Metal fitters and machinists 10.8<br />
Precision metal tradespeople 10.8<br />
Toolmakers and engineering patternmakers 10.8<br />
Electricians 7.6<br />
Air conditioning and refrigeration mechanics 10.1<br />
Electrical distribution tradespeople 10.1<br />
Electronics tradespeople 10.1<br />
Other machine operators 14.3<br />
Crane, hoist and lift operators 12.7<br />
Drillers, miners and shot firers 12.7<br />
Engineering production systems workers 12.7<br />
Earthmoving plant operators 14.5<br />
Truck drivers 12.0<br />
Concreters 17.4<br />
Structural steel construction workers 17.4<br />
Other construction and mining labourers 17.4<br />
Source: <strong>Taskforce</strong> analysis of ABS 2008a<br />
<strong>National</strong> <strong>Resources</strong> <strong>Sector</strong> <strong>Employment</strong> <strong>Taskforce</strong>: <strong>Technical</strong> <strong>Paper</strong> | 25
Retirements<br />
At the industry level, concerns have been expressed that the resources sector workforce is<br />
relatively old, leading to likely strong demand to replace retirees. Figure 8 examines the age<br />
profile of the mining and construction sectors compared to all industries as at February 2010.<br />
The data indicate the age profile of the sectors is similar to all industries. However the mining<br />
sector employs less people under 25 as a proportion, with 10 per cent of people employed in<br />
mining aged under 25, compared to 16 per cent in construction and all industries. The age<br />
profile for the mining sector for age 55 and beyond is lower than for all industries, which<br />
supports anecdotal evidence that people typically leave construction and mining before<br />
age 60.<br />
Figure 8: Age profile of the mining (includes oil and gas extraction) and construction<br />
industries, February 2010<br />
30<br />
Share of employment (per cent)<br />
25<br />
20<br />
15<br />
10<br />
5<br />
0<br />
15 - 19 20 - 24 25 - 34 35 - 44 45 - 54 55 - 59 60 - 64 65+<br />
Age groups<br />
Mining Construction All Australian Industries<br />
Source: ABS 2010a<br />
DEEWR estimates of retirement from the mining and oil and gas industries, where people<br />
leave the workforce entirely, suggest 7 per cent of the current workforce will retire over<br />
the next five years, and 16 per cent over the next 10 years. The modelling appears broadly<br />
consistent with advice from the resources sector about potential retirement. The joint<br />
submission from the Minerals Council of Australia, the Chamber of Minerals and Energy<br />
Western Australia and Queensland <strong>Resources</strong> Council indicates the majority of employees<br />
within the minerals industry have a median age of 40, compared with a median age for all<br />
industries of 37. Information contained in the submission from APPEA shows, as of June 2008,<br />
11.3 per cent of the oil and gas workforce were aged over 55, well below the national average<br />
of 15.5 per cent for the same period.<br />
Within the occupational groups across the mining sector, <strong>Taskforce</strong> analysis suggests a high<br />
proportion of managers (19 per cent) and machinery operators and drivers (16 per cent) are<br />
likely to retire in the next 10 years. This is significantly higher than other occupations, such as<br />
technicians and trade workers (11 per cent) and labourers (14 per cent).<br />
26 | <strong>National</strong> <strong>Resources</strong> <strong>Sector</strong> <strong>Employment</strong> <strong>Taskforce</strong>: <strong>Technical</strong> <strong>Paper</strong>
In its recent report prepared for Skills Australia titled Economic modelling of skills demand<br />
(Access Economics 2009), Access Economics noted there is no single definition of replacement<br />
demand that is ‘correct’. Access Economics noted much labour market movement relates to<br />
turnover or replacement of existing workers, but this movement may or may not generate a<br />
training demand. Reasons include:<br />
• retirement (where the replacement worker would need training)<br />
• movement to another role with a different skill set (requiring training)<br />
• moving to another occupation but using the same skills set (not requiring training)<br />
• time out of the workforce (which may or may not require retraining or refresher<br />
training on return).<br />
Access Economics modelled retirement by broad occupation group and concluded that<br />
considered together, employment growth and retirements represent the number of job<br />
openings relevant to future qualification demand. The <strong>Taskforce</strong> has adopted a similar<br />
approach to determine likely demand for professionals.<br />
Table 7 estimates losses to retirement of mining employees by occupation over the five years<br />
from 2010 to 2015 following the Access Economics approach. The estimates assume overall<br />
losses by occupation for mining follow the pattern for overall national employment by<br />
occupation. The data suggest losses of professionals in mining to retirement will be around<br />
2,700 in the five years from 2010 to 2015.<br />
Table 7: Projected losses from mining sector employment to retirement, 2010 to 2015,<br />
by occupation<br />
Occupation Mining 5-year loss (no.)<br />
Managers 15,166 -1,940<br />
Professionals 26,460 -2,664<br />
Technicians and tradespeople 43,696 -3,794<br />
Community and personal service workers 327 -30<br />
Clerical and administrative workers 14,307 -1,375<br />
Sales workers 477 -35<br />
Machinery operators and drivers 53,899 -5,427<br />
Labourers 9,030 -868<br />
Total 163,362 -16,133<br />
Source: <strong>Taskforce</strong> analysis of Access Economics 2009<br />
Summary<br />
In conclusion if replacement demand is 10 per cent, it appears around 16,000 job opportunities<br />
are likely to arise each year in mining (including around 3,000 retirements) and 2,000 in oil<br />
and gas (around 500 retirements) as workers leave the industry each year for other industries<br />
or to retire.<br />
<strong>National</strong> <strong>Resources</strong> <strong>Sector</strong> <strong>Employment</strong> <strong>Taskforce</strong>: <strong>Technical</strong> <strong>Paper</strong> | 27
4. Supply of labour and skills<br />
This chapter analyses the expected supply of skilled labour from domestic sources and from<br />
migration.<br />
Supplies of skills for the resources sector can come from:<br />
• the existing stock of skills in the national labour market—including the unemployed<br />
and the employed<br />
• new supplies of skills, including from:<br />
• vocational education and training<br />
• higher education<br />
• temporary and permanent migration.<br />
The <strong>Taskforce</strong> has used data from ABS, the Department of Immigration and Citizenship (DIAC),<br />
the NCVER and the DEEWR higher education statistics collection. The <strong>Taskforce</strong> also engaged<br />
the NCVER to model skills supply for technicians and tradespeople.<br />
Supply depends significantly on decisions by individuals. Are employers willing to take on<br />
apprentices? Are individuals interested in undertaking the relevant apprenticeships or higher<br />
education courses? Ultimately, are individuals interested in working in the sector, with the<br />
wages and working conditions on offer in the relevant locations? Changing circumstances<br />
can affect decisions. For example, the four Australian universities that offer mining<br />
engineering courses as part of the Minerals Tertiary Education Council (MTEC) all reported<br />
a decline in first-year enrolments in 2010, which they attributed to the global recession and<br />
downturn in the mining sector in 2009. On the other hand, enrolments could increase as the<br />
sector rebounds.<br />
A summary of supply, including information from modelling, suggests:<br />
• Over 600,000 people are currently unemployed, including around 48,000 professionals<br />
and 60,000 tradespeople across all states and territories.<br />
• The trades workforce will increase from 1,593,000 to 1,697,371 or 6.6 per cent<br />
nationally to 2015 according to NCVER’s average case scenario. There will be strong<br />
growth in the supply of electricians (up 22,056 or 16.7 per cent), bricklayers, carpenters<br />
and joiners (up 22,671 or 16 per cent) and fabrication engineering tradespeople (up<br />
5,870 or 7.1 per cent).<br />
• The number of tradespeople employed in mining and oil and gas operations and<br />
related construction is currently 90,000 people or 5.6 per cent of the total number of<br />
tradespeople in Australia. If the sector gains 5.6 per cent of the expected trade growth<br />
over the next five years this will provide only 1,213 additional electricians and 499 more<br />
fabrication engineering tradespeople (includes welders/boilermakers),which are highest<br />
in demand.<br />
• The resources sector does not train its ‘fair share’ of apprentices (data compared to<br />
other sectors).<br />
• The number of completions from university engineering courses is projected to grow by<br />
11.2 per cent from 6,312 in 2008 to 7,020 in 2014, with a significant increase in mining,<br />
chemical and civil engineering. However, the number of geoscience graduates is likely<br />
to fall over the same period.<br />
28 | <strong>National</strong> <strong>Resources</strong> <strong>Sector</strong> <strong>Employment</strong> <strong>Taskforce</strong>: <strong>Technical</strong> <strong>Paper</strong>
• After taking likely retirement into account, supply of mining, chemical, civil and other<br />
engineers will increase at a faster rate of growth than in previous years but is still<br />
unlikely to meet demand.<br />
• Migration will remain an important source of supply—despite the global recession, in<br />
the 12 months to 30 June 2009, resources and construction companies sponsored 9,840<br />
people into Australia on temporary 457 visas.<br />
4.1 Australia’s existing stock of skills<br />
The domestic supply of skills to the resources sector can come from:<br />
• people who are appropriately skilled for the work but are unemployed or using their<br />
skills in other sectors<br />
• people who are unskilled for the sector, whether employed or unemployed, but could<br />
undertake training to become suitably skilled for the jobs available<br />
• people not currently in the labour force — skilled or unskilled.<br />
Table 8 examines Australia’s stock of skills in selected professional and technician and trade<br />
occupations in early 2010, including people employed in a particular occupation and those<br />
who are now unemployed but recently worked in that occupation. While the unemployment<br />
rate for professionals, technicians and tradespeople is generally well below that for less<br />
skilled workers, the data indicate in early 2010, Australia had around 48,000 unemployed<br />
professionals as well as over 60,000 unemployed technicians and tradespeople. To some extent,<br />
the number of unemployed professionals and tradespeople may reflect the after-effects of the<br />
global recession as well as people moving jobs.<br />
Table 8: Number employed and unemployed for selected occupations, February 2010<br />
Occupation Employed* Unemployed**<br />
All professional occupations 2,300,704 48,172<br />
Engineering professionals 119,645 3,794<br />
Natural and physical science professionals 90,544 2,233<br />
All technicians and tradespeople occupations 1,583,681 60,857<br />
Automotive electricians and mechanics 94,203 2,425<br />
Building and engineering technicians 115,725 4,189<br />
Electricians 126,972 3,270<br />
Electronics and telecommunications tradespeople 90,616 3,875<br />
Fabrication engineering tradespeople 81,933 3,533<br />
Mechanical engineering tradespeople 135,105 4,366<br />
Miscellaneous technicians and tradespeople 61,375 1,684<br />
Plumbers 72,274 2,427<br />
Sources: ABS 2010a; ABS 2010c<br />
* Employed by occupation **Unemployed by last occupationRefer to Appendix III for a list of all professional,<br />
technician and tradespeople occupations<br />
<strong>National</strong> <strong>Resources</strong> <strong>Sector</strong> <strong>Employment</strong> <strong>Taskforce</strong>: <strong>Technical</strong> <strong>Paper</strong> | 29
Clearly, there are unemployed professionals and tradespeople in all states and territories who<br />
could play a critical role in alleviating resources sector skills concerns. For example, the data<br />
suggest Australia has:<br />
• around 4,000 unemployed engineering professionals<br />
• over 3,000 unemployed electricians<br />
• over 3,500 unemployed fabrication engineering tradespeople, including welders.<br />
Information provided by Australian Manufacturing Workers Union (AMWU) and advice from<br />
the Construction Forestry Mining and Energy Union (CFMEU), both members of the Industry<br />
Reference Group, support the view that there are considerable numbers of unemployed<br />
tradespeople across Australia who are available for employment in the resources sector.<br />
4.2 Unemployment by occupation and by state and territory<br />
Table 9 provides a breakdown by state and territory of unemployed people who were<br />
previously employed in selected professional, technical and trades occupations in the last two<br />
years. These data are derived from the ABS Labour Force Survey, which is based on a sample<br />
of approximately 29,000 private dwellings and covers about 0.33 per cent of the Australian<br />
civilian population aged 15 years or over.<br />
Table 9: Unemployment by selected previous occupation, by state and territory 2010<br />
Professionals<br />
Unemployed<br />
NSW VIC QLD SA WA TAS NT ACT AUS<br />
All professional<br />
occupations 18,465 12,200 8,167 2,793 4,424 869 206 1,048 48,172<br />
Engineering professionals 1,091 1,085 511 585 490 0 0 32 3,794<br />
Natural and physical<br />
science professionals 663 179 676 141 417 45 0 112 2,232<br />
All technicians and<br />
tradespeople occupations 17,652 14,220 14,975 3,786 8,060 1,205 481 478 60,857<br />
Automotive electricians<br />
and mechanics 674 584 654 121 154 204 0 34 2,425<br />
Building and engineering<br />
technicians 1,576 777 595 316 812 32 48 32 4,189<br />
Electricians 1,139 651 691 150 504 66 68 0 3,270<br />
Electronics and<br />
telecommunications<br />
tradespeople 1,302 958 1,047 172 298 34 18 46 3,873<br />
Fabrication engineering<br />
tradespeople 812 964 530 54 1,000 172 0 0 3,533<br />
Mechanical engineering<br />
tradespeople 1,031 554 895 474 1,283 54 75 0 4,366<br />
Miscellaneous technicians<br />
and tradespeople 632 201 383 89 379 0 0 0 1,686<br />
Plumbers 1,115 230 759 122 177 24 0 0 2,427<br />
Sources: ABS 2010a; ABS 2010c<br />
30 | <strong>National</strong> <strong>Resources</strong> <strong>Sector</strong> <strong>Employment</strong> <strong>Taskforce</strong>: <strong>Technical</strong> <strong>Paper</strong>
Available data suggest while unemployment remains low in towns located close to existing<br />
mining sites or major projects, many regions and cities continue to experience significant levels<br />
of unemployment. For example, DEEWR unemployment data in Table 10, shows at March 2010<br />
unemployment was relatively high in Cairns and in the Bundaberg–Hervey Bay region in<br />
Queensland. Unemployed people in these areas may provide an additional source for the<br />
resources sector to draw on to meet its skills needs.<br />
Table 10: Unemployment in selected areas, March quarter 2010<br />
Area<br />
Number of<br />
unemployed people Unemployment rate %<br />
New South Wales 213,900 5.9<br />
Hunter* 14,883 5.2<br />
Queensland 133,500 5.6<br />
Cairns 12,877 11.7<br />
Townsville—Thuringowa 2,020 5.7<br />
Mackay—Rockhampton—Gladstone 8,288 6.3<br />
Bundaberg—Hervey Bay 6,224 7.7<br />
Brisbane 55,800 5.1<br />
Western Australia 63,300 5.1<br />
Geraldton—Port Hedland—Karratha 2,003 5.6<br />
Perth 47,200 5.1<br />
South Australia 44,800 5.3<br />
Port Augusta—Whyalla—Port Pirie 1,406 5.6<br />
Adelaide 35,000 5.6<br />
Australia 641,000 5.6<br />
Source: DEEWR 2010c<br />
* For illustrative purposes, includes Cessnock, Lake Macquarie, Maitland, Muswellbrook, Newcastle, Port Stephens<br />
and Singleton.<br />
4.3 New supplies of skills<br />
4.3.1 Vocational education and training<br />
Recent trends in skills formation<br />
Since the resources boom of the previous decade, Western Australia and Queensland have<br />
moved to increase their output of apprentices and trainees to meet the increased demand for<br />
skills. Thesse two states experienced the highest levels of growth (4,100 or 43.2 per cent and<br />
8,000 or 30.2 per cent respectively) of all states and territories between 2005 and 2009.<br />
<strong>National</strong> <strong>Resources</strong> <strong>Sector</strong> <strong>Employment</strong> <strong>Taskforce</strong>: <strong>Technical</strong> <strong>Paper</strong> | 31
Figure 9: Number and percentage change in apprentice and trainee completions by<br />
state and territory, 2005 to 2009<br />
NSW<br />
9 400 (24.8%)<br />
Vic<br />
-3 300 (-7.4%)<br />
States and territories<br />
Qld<br />
SA<br />
WA<br />
Tas<br />
200 (3.7%)<br />
2 100 (22.8%)<br />
4 100 (43.2%)<br />
8 000 (30.2%)<br />
NT<br />
0 (0%)<br />
ACT<br />
100 (4.0%)<br />
-7 000 -5 000 -3 000 -1 000 1 000 3 000 5 000 7 000 9 000 11 000<br />
Source: NCVER 2010<br />
Number of completions<br />
Projections of skills formation<br />
The <strong>Taskforce</strong> engaged the NCVER to develop projections of the future supply of tradespeople<br />
for 2010–2020 with three possible scenarios: best case, average and worst case. The estimates<br />
for supply of tradespeople reflect supply to the overall national labour market and the<br />
resources sector will need to compete with other industries to engage them.<br />
NCVER’s analysis examines trends in commencements, completions and attrition, by trade, to<br />
derive a net supply figure over the projection period:<br />
• In the best case scenario, the highest contract commencement rate and the lowest<br />
contract cancellation/withdrawal and attrition rates are used.<br />
• In the average case scenario, average rates are used.<br />
• In the worst case scenario, the lowest commencement rate and the highest<br />
cancellation/withdrawal and attrition rates are used.<br />
<strong>Resources</strong> sector trades expected to experience the highest rates of growth—short of the worst<br />
case scenario occurring—include electricians, bricklayers, carpenters and joiners, fabrication<br />
engineering tradespeople, and mechanical engineering tradespeople, with building and<br />
engineering technicians, and electronics and telecommunications tradespeople faring less well.<br />
32 | <strong>National</strong> <strong>Resources</strong> <strong>Sector</strong> <strong>Employment</strong> <strong>Taskforce</strong>: <strong>Technical</strong> <strong>Paper</strong>
Table 11 provides estimates of the total number of tradespeople by occupational group in<br />
2010 and in 2015 and includes information about the increase or decrease. For example the<br />
number of electricians is expected to increase by around 22,000 (17 per cent) by 2015 under<br />
the average case scenario.<br />
Table 11: Projected growth in skills supply for selected technicians and tradespeople,<br />
2010 to 2015, best, average and worst case scenarios<br />
2015<br />
2015<br />
2015<br />
Building and engineering<br />
technicians<br />
Fabrication engineering<br />
tradespeople<br />
Mechanical engineering<br />
tradespeople<br />
Bricklayers, and carpenters<br />
and joiners<br />
2010<br />
Best case<br />
scenario<br />
122,100 +122,978<br />
+878<br />
+1 %<br />
82,400 104,283<br />
+21 883<br />
+27 %<br />
141,400 167,428<br />
+26 028<br />
+18 %<br />
141,400 190,811<br />
+49,411<br />
+35 %<br />
Electricians 132,200 184,346<br />
+52 146<br />
+39 %<br />
Electronics and telecommunications<br />
tradespeople<br />
101,400 114,518<br />
+13,118<br />
+13 %<br />
Average case<br />
scenario<br />
110,622<br />
-11,478<br />
-9 %<br />
88,270<br />
+5,870<br />
+7 %<br />
149,534<br />
+8,134<br />
+6 %<br />
164,071<br />
+22,671<br />
+16 %<br />
154,256<br />
+22,056<br />
+17 %<br />
97,261<br />
-4,139<br />
-4 %<br />
Worst case<br />
scenario<br />
98,156<br />
-23,944<br />
-20 %<br />
75,372<br />
-7,028<br />
-9%<br />
132,057<br />
-9,343<br />
-7%<br />
141,871<br />
+471<br />
0 %<br />
129,788<br />
-2 412<br />
-2 %<br />
81,704<br />
-19 696<br />
-19 %<br />
Total Trades 1,593,000 1,975,502 1,697,371 1,412,668<br />
Source: Karmel and Mlotkowski, 2010<br />
Table 12 uses the NCVER’s average case scenario to provide information on projected supply<br />
growth in the skilled trades during the critical period of 2010 to 2015, when many major<br />
projects are scheduled. The data suggest nationally there will be significant numbers of<br />
new tradespeople in several key trades relevant to the resources sector. However, while this<br />
‘apparent supply’ is significant, it will be accessed by all industries, not just the resources sector,<br />
and skill formation trends will vary from state to state.<br />
<strong>National</strong> <strong>Resources</strong> <strong>Sector</strong> <strong>Employment</strong> <strong>Taskforce</strong>: <strong>Technical</strong> <strong>Paper</strong> | 33
Table 12: Projected new skill formation in the skilled trades, Australia, 2010 to 2015<br />
Trade 2010 2015 variation<br />
Agricultural, medical and science technicians 49,700 64,460 14,760<br />
Building and engineering technicians 122,100 110,622 -11,478<br />
Automotive electricians and mechanics 98,300 107,909 9,609<br />
Fabrication engineering tradespeople 82,400 88,270 5,870<br />
Mechanical engineering tradespeople 141,400 149,534 8,134<br />
Bricklayers, and carpenters and joiners 141,400 164,071 22,671<br />
Floor finishers and painting tradespeople 60,400 55,815 -4,585<br />
Glaziers, plasterers and tilers 67,000 71,866 4,866<br />
Plumbers 73,400 82,508 9,108<br />
Electricians 132,200 154,256 22,056<br />
Electronics and telecommunications tradespeople 101,400 97,261 -4,139<br />
Wood tradespeople 32,100 33,335 1,235<br />
Miscellaneous technicians and tradespeople 51,700 45,670 -6,030<br />
Total Trades 1,153,500 1,225,577 72,077<br />
Source: Karmel and Mlotkowski, 2010<br />
Skill formation by state and territory<br />
Figure 10, Figure 11 and Table 14 provide information by state under the average case<br />
scenario. The total number of tradespeople is expected to increase by:<br />
• 35,319 in New South Wales<br />
• 27,580 in Queensland<br />
• 15,249 in Victoria<br />
• 11,480 in Western Australia.<br />
Figure 10: Projected growth in the supply of tradespeople, 2010 to 2015, by state and<br />
territory, average case scenario<br />
NT<br />
1 324<br />
ACT<br />
1 917<br />
States and territories<br />
TAS<br />
SA<br />
WA<br />
VIC<br />
QLD<br />
3 575<br />
7 928<br />
11 480<br />
15 249<br />
27 580<br />
NSW<br />
35 319<br />
AUS<br />
10 4371<br />
0 20 000 40 000 60 000 80 000 100 000 120 000<br />
Source: Karmel and Mlotkowski, 2010<br />
Number of tradespeople<br />
34 | <strong>National</strong> <strong>Resources</strong> <strong>Sector</strong> <strong>Employment</strong> <strong>Taskforce</strong>: <strong>Technical</strong> <strong>Paper</strong>
Table 13 and Figure 11 show that under the average case scenario, the supply of technicians<br />
and tradespeople in Western Australia will grow by 5 per cent to 2015. This is unlikely to be<br />
sufficient to meet demand.<br />
Table 13: Projected supply of technicians and tradespeople, by state and territory,<br />
2010 to 2015, by scenario<br />
2010<br />
2015<br />
Best case scenario<br />
New South Wales 464,900 584,119<br />
+119,219<br />
+26%<br />
Victoria 386,200 468,605<br />
+82,405<br />
+21%<br />
Queensland 337,400 424,625<br />
+87,225<br />
+26%<br />
South Australia 115,700 144,485<br />
+28,785<br />
+25%<br />
Western Australia 213,300 257,151<br />
+43,851<br />
+21%<br />
Tasmania 32,800 42,826<br />
+10,026<br />
+31%<br />
Northern Territory 22,000 26,976<br />
+4,976<br />
+23%<br />
Australian Capital<br />
Territory<br />
20,700 26,715<br />
+6,015<br />
+29%<br />
2015<br />
Average case<br />
scenario<br />
500,219<br />
+35,319<br />
+8%<br />
401,449<br />
+15,249<br />
+4%<br />
364,980<br />
+27,580<br />
+8%<br />
123,628<br />
+7,928<br />
+7%<br />
224,780<br />
+11,480<br />
+5%<br />
36,375<br />
+3,575<br />
+11%<br />
23,324<br />
+1,324<br />
+6%<br />
22,617<br />
+1,917<br />
+9%<br />
2015<br />
Worst case<br />
scenario<br />
331,585<br />
-54,615<br />
-14%<br />
304,420<br />
-32,980<br />
-10%<br />
102,600<br />
-13,100<br />
-11%<br />
190,953<br />
-22,347<br />
-10%<br />
30,080<br />
-2,720<br />
-8%<br />
19,487<br />
-2,513<br />
-11%<br />
18,393<br />
-2,307<br />
-11%<br />
Australia 1,593,000 1,975,502 1,697,372 1,412,668<br />
Source: Karmel and Mlotkowski 2010<br />
<strong>National</strong> <strong>Resources</strong> <strong>Sector</strong> <strong>Employment</strong> <strong>Taskforce</strong>: <strong>Technical</strong> <strong>Paper</strong> | 35
Figure 11: Projected growth in the supply of tradespeople, 2010 to 2015,<br />
by state and territory, percentage change, average case scenario<br />
Vic<br />
3.9%<br />
WA<br />
5.4%<br />
States and territories<br />
NT<br />
Aus<br />
SA<br />
NSW<br />
Qld<br />
6.0%<br />
6.6%<br />
6.9%<br />
7.6%<br />
8.2%<br />
ACT<br />
9.3%<br />
Tas<br />
10.9%<br />
0 2 4 6 8 10 12<br />
Source: Karmel and Mlotkowski, 2010<br />
per cent<br />
It is concerning that Western Australia’s supply is not expected to increase as rapidly as most<br />
other states given its resources sector’s needs and the reluctance of people to move from the<br />
east coast to Western Australia.<br />
State skill formation by occupation<br />
It is also concerning that in Western Australia, growth in the net supply in the key electrical<br />
trade is low by comparison with other states, particularly as it has been identified as an<br />
occupation likely to be in shortage from 2012 (see Figure 12).<br />
36 | <strong>National</strong> <strong>Resources</strong> <strong>Sector</strong> <strong>Employment</strong> <strong>Taskforce</strong>: <strong>Technical</strong> <strong>Paper</strong>
Figure 12: Projected growth in supply of selected tradespeople, 2010 to 2015,<br />
by state and territory, percentage change, average case scenario<br />
NSW<br />
10.9%<br />
18.3%<br />
Vic<br />
6.4%<br />
12.4%<br />
States and territories<br />
Qld<br />
SA<br />
WA<br />
Tas<br />
NT<br />
7.2%<br />
3.0%<br />
4.4%<br />
5.6%<br />
7.4%<br />
7.7%<br />
14.3%<br />
16.4%<br />
25.4%<br />
36.5%<br />
ACT<br />
15.7%<br />
81.0%<br />
Aus<br />
7.1%<br />
16.7%<br />
0 10 20 30 40 50 60 70 80 90<br />
per cent<br />
Fabrication engineering trades workers<br />
Electricians<br />
Source: Karmel and Mlotkowski, 2010<br />
The NCVER examined the resources sector’s expected share of trade and apprentice<br />
employment, which in February 2010 was 5.6 per cent, or 90,000 people. The majority were<br />
concentrated in other construction services (29,700), metal ore mining (15,700), heavy and civil<br />
engineering construction (12,500) and coal mining (11,500).<br />
Those trades in which the resources sector’s share was higher than its overall share of trade<br />
employment included horticultural trades which have a significant role in site rehabilitation<br />
(26.9 per cent), mechanical engineering trades (15.3 per cent), building and engineering<br />
technicians (12.8 per cent) and fabrication engineering trades (8.5 per cent). Electricians came<br />
in slightly below at 5.5 per cent.<br />
The resources sector’s overall share of trade apprentices is lower than its share of trade<br />
employment. In December 2009, the sector employed 6,776 (3.6 per cent) trade apprentices.<br />
The majority were concentrated in other construction services (3,497), heavy and civil<br />
engineering construction (1,129), other mining support services (793) and metal ore<br />
mining (638).<br />
Projections on the future supply of trade skills to the resources sector<br />
NCVER analysis (average case scenario) suggests if the resources sector maintains its share of<br />
tradespeople, it will employ approximately 95,000 in 2015.<br />
<strong>National</strong> <strong>Resources</strong> <strong>Sector</strong> <strong>Employment</strong> <strong>Taskforce</strong>: <strong>Technical</strong> <strong>Paper</strong> | 37
The resources sector’s role in trade skills formation<br />
NCVER assessed the relative contribution of the resources sector to skills formation to meet its<br />
own needs and concluded that:<br />
A related issue is the extent to which the industry contributes to the supply itself. The<br />
issue is whether the resources sector trains its fair share of apprentices. We address this<br />
issue by comparing the share of apprentices with the share of tradespeople. We find<br />
that the sector employs considerably fewer apprentices than would be expected from<br />
its share of trade employment. In fact, the sector would have to double its number of<br />
apprentices to be on par with other industries. It is interesting to note that the two<br />
occupations in which the sector pulls above its weight—building and engineering<br />
technicians and horticulturalists—are the two occupations for which the resources<br />
sector is a major employer.<br />
Karmel and Mlotkowski 2010<br />
Table 14: Relative share of apprentices employed by the resources sector, by selected<br />
occupations (fair share=100)<br />
Relative share of apprentices employed by selected occupations<br />
Technicians and tradespeople 63<br />
Building and engineering technicians 160<br />
Fabrication engineering tradespeople 45<br />
Mechanical engineering tradespeople 39<br />
Electricians 27<br />
Electronics and telecommunications tradespeople 24<br />
Horticultural tradespeople 113<br />
Miscellaneous technicians and tradespeople 30<br />
Source: Karmel and Mlotkowski, 2010<br />
Note: the occupations are those for which the resources sector employs 4 per cent or more of the employment in<br />
that occupation.<br />
As part of its analysis, the NCVER examined the contribution made by the resources sector to<br />
the employment of trade apprentices. This was done on the basis of the sector’s share of trade<br />
apprentices relative to its trade employment share, with a value of 100 or higher indicating<br />
the sector employs its share, or more, of trade apprentices.<br />
38 | <strong>National</strong> <strong>Resources</strong> <strong>Sector</strong> <strong>Employment</strong> <strong>Taskforce</strong>: <strong>Technical</strong> <strong>Paper</strong>
Overall, the resources sector’s share of apprentices is 64, suggesting it does not employ its fair<br />
share of trade apprentices. Oil and gas extraction, coal mining and metal ore mining employ<br />
well below their ‘fair share’.<br />
Table 15: Relative share of apprentices employed by the resources sector, by industry (fair<br />
share=100)<br />
Relative share of apprentices employed by industry<br />
Coal mining 17<br />
Oil and gas extraction 10<br />
Metal ore mining 34<br />
Exploration 40<br />
Other mining support services 137<br />
Heavy and civil engineering construction 77<br />
Land development and site preparation services 29<br />
Other construction services 100<br />
Total resource industries 64<br />
Total other industries 102<br />
Total 100<br />
Source: Karmel and Mlotkowski 2010<br />
4.3.2 Higher education<br />
Higher education supply<br />
The higher education system supplies skills for many of the occupations in the resources sector,<br />
for example, accountants, planners and auditors. Crucial to the core business and technical<br />
operations of the resources sector are the specialised fields of engineering (e.g. mining,<br />
petroleum, chemical and civil engineering) and geoscience (e.g. geology, geophysics and<br />
geochemistry). In recent years concerns have been raised that the number of graduates from<br />
these areas need to increase.<br />
Commencements in engineering<br />
The latest higher education data is for 2008. Over the period 2002–2008, the number of<br />
students commencing in engineering courses was at its lowest point in 2005 but since then<br />
numbers have been increasing. Between 2005 and 2008, the number of domestic students<br />
commencing in undergraduate engineering courses increased by 16 per cent, from 10,619 to<br />
12,321. In 2008, just over one in four students commencing in undergraduate engineering<br />
courses were overseas students and just over one in two students commencing postgraduate<br />
courses were overseas students.<br />
<strong>National</strong> <strong>Resources</strong> <strong>Sector</strong> <strong>Employment</strong> <strong>Taskforce</strong>: <strong>Technical</strong> <strong>Paper</strong> | 39
Table 16: Student commencements in engineering* higher education courses, by citizenship<br />
and course level, 2002 to 2008<br />
2002 2003 2004 2005 2006 2007 2008<br />
Postgraduate commencements<br />
Domestic 2,985 3,050 3,015 2,810 2,725 2,737 2,893<br />
Overseas 2,368 3,413 3,416 3,323 3,156 3,458 3,616<br />
Total 5,353 6,463 6,431 6,133 5,881 6,195 6,509<br />
Undergraduate commencements<br />
Domestic 11,114 10,898 10,655 10,619 11,046 12,084 12,321<br />
Overseas 3,946 4,370 4,020 3,967 4,085 4,935 4,974<br />
Total 15,060 15,268 14,675 14,586 15,131 17,019 17,295<br />
Total commencements<br />
Domestic 14,171 14,033 13,742 13,579 13,931 15,000 15,440<br />
Overseas 6,314 7,783 7,436 7,301 7,247 8,393 8,590<br />
Total 20,485 21,816 21,178 20,880 21,178 23,393 24,030<br />
Source: <strong>Taskforce</strong> analysis of Higher Education Student Data DEEWR 2010<br />
*Engineering includes Australian Standard Classification of Education (ASCED) codes: 030000 –039999.<br />
Commencements in geoscience<br />
Over the period 2002–2008, the number of students commencing in geoscience courses was<br />
at its lowest point in 2005 and has since increased, but commencement numbers in 2008<br />
were well below those seen between 2002 and 2004. Between 2005 and 2008, the number<br />
of domestic students commencing in undergraduate geoscience (or earth science) courses<br />
increased by 34 per cent, from 171 to 229. In 2008, just over one in five students commencing<br />
undergraduate geoscience courses were overseas students and just over one in three<br />
commencing postgraduate geoscience courses were overseas students.<br />
Table 17: Student commencements in geoscience* higher education courses, by citizenship<br />
and course level, 2002 to 2008<br />
2002 2003 2004 2005 2006 2007 2008<br />
Postgraduate commencements<br />
Domestic 209 185 183 178 212 239 210<br />
Overseas 52 44 58 49 68 75 106<br />
Total 261 229 241 227 280 314 316<br />
Undergraduate commencements<br />
Domestic 266 253 337 171 197 215 229<br />
Overseas 8 7 10 2 31 70 59<br />
Total 274 260 347 173 228 285 288<br />
Total commencements<br />
Domestic 475 438 520 349 409 454 439<br />
Overseas 60 51 68 51 99 145 165<br />
Total 535 489 588 400 508 599 604<br />
Source: <strong>Taskforce</strong> analysis of Higher Education Student Data DEEWR 2010<br />
*Geoscience includes Australian Standard Classification of Education (ASCED) codes for earth sciences:<br />
010700 –010799.<br />
40 | <strong>National</strong> <strong>Resources</strong> <strong>Sector</strong> <strong>Employment</strong> <strong>Taskforce</strong>: <strong>Technical</strong> <strong>Paper</strong>
4.3.3 Projected trends in higher education domestic undergraduate<br />
completions, 2009 to 2014<br />
Using recent commencements and completions data, the <strong>Taskforce</strong> has estimated future<br />
numbers of graduates (see Appendix IV). These estimates are based on 2008 data for domestic<br />
undergraduate students (the latest data available). Completion numbers have been projected<br />
for the years 2009 to 2014, as it is expected a student will be ready to enter the workforce the<br />
year after they complete their course ie from 2010 to 2015.<br />
Engineering<br />
Across all engineering fields, the number of completions for domestic students from<br />
undergraduate courses is projected to grow by 11.2 per cent from 6,312 in 2008 to 7,020 in<br />
2014. Tables 18 and 19 provide expected completions across courses relevant to the resources<br />
sectors and Appendix IV provides estimates for each year.<br />
Table 18: Number of completions and projected completions in higher education domestic<br />
undergraduate courses for engineering fields of education, 2008 and 2014<br />
2008 2014<br />
Growth<br />
%<br />
Mining engineering 139 253 82<br />
Chemical engineering 347 443 28<br />
Civil engineering 935 1 107 18<br />
Maritime engineering and technology 76 104 37<br />
Source: <strong>Taskforce</strong> analysis of Higher Education Student data, DEEWR, 2010<br />
The largest increases in growth in completions of engineering courses are projected to occur in<br />
Western Australia and Queensland between 2008 and 2014.<br />
Table 19: Number of completions and projected completions in higher education domestic<br />
undergraduate courses for engineering 1 , by state and territory, 2008 and 2014<br />
2008 2014<br />
Growth<br />
%<br />
Western Australia 715 1,017 42<br />
Queensland 1,142 1,598 40<br />
New South Wales 1,676 1,993 19<br />
South Australia 427 467 9<br />
Tasmania 134 178 32<br />
Northern Territory 11 15 37<br />
Victoria 2,106 1,692 -20<br />
Australian Capital Territory 2 101 58 -42<br />
Source: <strong>Taskforce</strong> analysis of Higher Education Student Data, DEEWR, 2010<br />
Notes:<br />
1 Engineering includes Australian Standard Classification of Education (ASCED) codes: 030000 –039999<br />
2 From 2005 completions from the Australian Defence Force Academy are included with NSW—prior to 2005<br />
they are included with the Australian Capital Territory<br />
<strong>National</strong> <strong>Resources</strong> <strong>Sector</strong> <strong>Employment</strong> <strong>Taskforce</strong>: <strong>Technical</strong> <strong>Paper</strong> | 41
Geoscience<br />
Domestic undergraduate completions in geoscience are expected to increase from 2009 to<br />
2011 and then decrease between 2011 and 2014. Between 2009 and 2014 completions are<br />
expected to fall by 19 per cent. For more detailed analysis of completions see Appendix IV.<br />
4.3.4 <strong>Employment</strong> destinations for higher education graduates<br />
Graduate Careers Australia found that 90.6 per cent of the mining engineering graduates who<br />
completed their qualifications at the end of 2008 were working in a mining-related occupation<br />
four months later. For geology graduates, 81.4 per cent were working in occupations directly<br />
related to their degrees.<br />
Table 20 provides data on graduates working in a field related to their training.<br />
Table 20: Proportion of graduates working in areas related to training, by field of study, 2008<br />
Broad field of education<br />
Proportion of bachelor degree graduates<br />
working in areas related to training (%)<br />
Chemical engineering 90.6<br />
Civil engineering 85.7<br />
Electrical engineering 85.2<br />
Electronic/computer engineering 80.6<br />
Mechanical engineering 84.9<br />
Mining engineering 90.6<br />
Other engineering 81.8<br />
Geology 81.4<br />
Chemistry 83.9<br />
Physics 66.1<br />
Source: Graduate Careers Australia 2009<br />
However, the <strong>Taskforce</strong>’s analysis of census data indicates many mining professionals are<br />
employed in other industries, which suggests many do not remain in mining. In 2006, only<br />
55 per cent of those qualified as mining engineers were working in mining, while 8 per<br />
cent were working in professional, scientific and technical services in areas, such as scientific<br />
research and engineering. Only around 30 per cent of geologists and geophysicists were<br />
working in mining. Around 21 per cent of geologists and 27 per cent of geophysicists were<br />
working in professional, scientific and technical services. See Table 21.<br />
42 | <strong>National</strong> <strong>Resources</strong> <strong>Sector</strong> <strong>Employment</strong> <strong>Taskforce</strong>: <strong>Technical</strong> <strong>Paper</strong>
Table 21: Number and percentage of those with mining engineering and geoscience<br />
qualifications working in mining, 2006<br />
Field of Education<br />
Total employed<br />
Number<br />
employed in mining<br />
(ANZSIC* 2006)<br />
Proportion<br />
working in mining<br />
%<br />
Mining engineering 7,429 4,068 55<br />
Geology 9,247 3,146 34<br />
Geophysics 1,034 305 29<br />
Geochemistry 139 14 10<br />
Source: <strong>Taskforce</strong> analysis of ABS 2007<br />
* Australian and New Zealand Standard Industrial Classification<br />
4.3.5 Immigration<br />
Temporary and permanent skilled migration has made a significant contribution to the supply<br />
of skills to the labour market in recent years. The importance of migration to the resources<br />
sector as a means of meeting its skill needs and in contributing to continued productivity and<br />
expansion has been confirmed in consultations and submissions to the <strong>Taskforce</strong>.<br />
This contribution has been made directly, for example through employer-sponsored programs<br />
such as the Employer Nomination Scheme and Regional Sponsored Migration Scheme, as well<br />
as through the General Skill Stream of the permanent Migration Program, which has created<br />
an onshore pool of skills from which the resources sector can draw.<br />
These have been supplemented by temporary programs such as the Subclass 457 visa and<br />
labour agreements with the Australian Government, the latter including a number of<br />
agreements negotiated with labour hire companies supplying skilled workers to the resources<br />
sector.<br />
<strong>National</strong> <strong>Resources</strong> <strong>Sector</strong> <strong>Employment</strong> <strong>Taskforce</strong>: <strong>Technical</strong> <strong>Paper</strong> | 43
Table 22 shows the numbers of primary visa applications for both the Migration Program<br />
and the Subclass 457 visa by selected occupations, not all of which are in the resources and<br />
construction sectors. Around 19 per cent of those granted, Subclass 457 visas (9,840) were for<br />
work in the resources and construction sectors.<br />
Table 22: Primary visa applications granted by selected occupations, 2008–09<br />
Occupation<br />
Migration Program<br />
(permanent)<br />
Subclass 457 visa*<br />
(temporary)<br />
Engineering, distribution and process managers 551 1,053<br />
Natural and physical science professionals 1,356 1,920<br />
Building and engineering professionals 5,633 4,321<br />
Building and engineering associate professionals 541 2,397<br />
Mechanical engineering tradespeople 1,822 1,263<br />
Fabrication engineering tradespeople 966 1,659<br />
Electrical and electronics tradespeople 2,012 713<br />
Structural construction tradespeople 874 640<br />
Mobile plant operators 9 106<br />
Intermediate stationary plant operators 6 30<br />
Intermediate mining and construction workers 19 216<br />
Subtotal—selected occupations related to the resources sector 13,789 14,318<br />
Total—all occupations 50,652 50,661<br />
Source: Department of Immigration and Citizenship (DIAC) unpublished data 2010<br />
* Includes visas granted under labour agreements.<br />
In 2008–09, employers in the mining sector were granted 4,300 Subclass 457 visas (8.5 per cent<br />
of all granted), a decline of 11.9 per cent from the previous financial year. Employers in the<br />
construction sector were granted 5,540 visa applications (a 10.9 per cent share and a decrease<br />
of 2.6 per cent from the previous year) (DIAC 2010).<br />
Recent trends indicate Subclass 457 visa applications are increasing. For example, the number<br />
of primary visa applications lodged in March 2010 was the highest in 12 months, and the<br />
application rate was 19 per cent higher than the previous month (DIAC 2010).<br />
Despite this, in March 2010, the application rate was still 3 per cent lower than in March 2009,<br />
and remains well below the rates seen during 2007–08. For their part, trade occupations<br />
accounted for only 9 per cent of total applications during the March quarter 2010, a decrease<br />
from 16 per cent for the same quarter last year (DIAC 2010).<br />
44 | <strong>National</strong> <strong>Resources</strong> <strong>Sector</strong> <strong>Employment</strong> <strong>Taskforce</strong>: <strong>Technical</strong> <strong>Paper</strong>
5. Where are the skills gaps?<br />
This chapter examines recent labour market trends, competition for skills sought by the<br />
construction and resources sector, existing skill shortages across the economy and resources<br />
companies’ current and anticipated recruitment difficulties.<br />
The Australian economy continues to strengthen following the global recession, although<br />
recovery is geographically patchy. Some communities have higher rates of unemployment<br />
than others. For example, in Mackay, near the mining centre of the Bowen Basin, the<br />
unemployment rate is 6.3 per cent, while in Cairns it is 11.7 per cent (see Table 11).<br />
Economic growth is expected to strengthen over the next two to three years. <strong>Employment</strong><br />
has risen for eight consecutive months to April 2010 and seems likely to continue to rise (ABS<br />
2010c). Job vacancies, both broadly and for skilled labour, are also increasing with strong<br />
growth in vacancies for engineering professionals and in key trades for the resources sector in<br />
the past year. However earnings growth is relatively subdued, including in the mining industry.<br />
This suggests skill shortages have yet to add significantly to wage pressures in the resources<br />
sector.<br />
The resources and construction sectors report recruiting difficulties for some professional<br />
occupations—particularly for senior and specialist positions—and a tightening of the labour<br />
market in some trades, but there is currently no shortage of applicants for entry-level<br />
positions:<br />
It is not uncommon for Newcrest to receive 100s if not 1000+ applications for entry‐level,<br />
unskilled operator roles, when advertised, especially in a residential location such as<br />
Orange.<br />
Newcrest submission<br />
There is significant potential for skills gaps and skills shortages to emerge over the period<br />
2011–2013 as the construction of new resources projects ramps up and resources companies<br />
seek additional workers to support expansion and to replace workers who leave.<br />
Construction of major infrastructure projects is likely to peak in 2012–13 coinciding with the<br />
expected peak in construction of resources projects.<br />
In most occupations and locations, the picture is one of gathering demand and potential skill<br />
shortages rather than significant existing skill shortages. However, trends vary from state<br />
to state and the resources sector, in seeking to recruit for jobs in remote locations, will face<br />
competition from employers in metropolitan areas.<br />
Current skills shortages at the national level include civil, electrical, mechanical, mining and<br />
petroleum engineers, geologists, carpenters, plumbers and the automotive trades. Although<br />
DEEWR analysis has not identified shortages of welders at the national level, shortages are<br />
apparent in South Australia, Western Australia and the Northern Territory. For Western<br />
Australia, there are also shortages of earthmoving plant operators, motor mechanics,<br />
carpenters and joiners and concreters (see Appendix V).<br />
<strong>National</strong> <strong>Resources</strong> <strong>Sector</strong> <strong>Employment</strong> <strong>Taskforce</strong>: <strong>Technical</strong> <strong>Paper</strong> | 45
Looking ahead, Western Australia is likely to face significant shortages by late 2012 for<br />
structural steel and welding tradespeople, fitters, electricians, earthmoving plant operators,<br />
structural steel concrete workers, motor mechanics, crane lift and hoist operators, carpenters<br />
and joiners, concreters and other construction and mining operators.<br />
In Queensland, shortages will depend on the progress of coal seam gas (CSG) projects but<br />
are likely to include mining production managers, civil, electrical, mechanical and petroleum<br />
engineers as well as fitters, electricians, electrical instrumentation, drillers and plant and<br />
machinery operators. Skill shortages are likely to be more significant in regions where<br />
resources projects are concentrated.<br />
5.1 Strong economic growth is likely to increase the<br />
competition for skills and labour from other industries<br />
As discussed earlier, both Treasury and the RBA expect economic growth will strengthen<br />
for the next two to three years. Stronger economic growth is likely to result in reductions<br />
in unemployment. In its 2010–11 Budget papers, Treasury forecast the unemployment rate<br />
will continue to fall, reaching 5 per cent by the end of 2010–11 and 4.75 per cent by the end<br />
of 2011–12, ‘around its full employment rate’ (Australian Treasury 2010b). This will lead to<br />
greater competition for scarce skills between employers, which may lead to skill shortages in<br />
some occupations (RBA 2010).<br />
<strong>Employment</strong> rose in April for the eighth consecutive month and the unemployment rate<br />
remained steady at 5.4 per cent. The DEEWR Skilled Vacancy Index (SVI) (trend) increased by<br />
1.3 per cent in April 2010. In annual terms, the SVI was 18.6 per cent higher than in April 2009.<br />
Over the year to April 2010, increases in skilled vacancies were recorded for all but one of<br />
the states and territories. Skilled vacancies are well below 2008 levels but have recovered<br />
in the past year. The largest increases were recorded for Western Australia (up by 73.9 per<br />
cent), the Northern Territory (up by 26.9 per cent) and New South Wales (up by 17.1 per cent).<br />
Queensland recorded the only fall (down by 40.3 per cent).<br />
Considered by occupation, there were strong increases in vacancies for building and<br />
engineering professionals (up 47.0 per cent), in the metal trades (up 118.1 per cent)<br />
construction and wood trades (up 83.7 and 74.0 per cent respectively) and electrical and<br />
electronic trades (up by 42.9 per cent) (DEEWR 2010a).<br />
5.2 Trends in earnings<br />
Recent ABS Labour Price Index survey data suggest earnings growth in mining is increasing<br />
somewhat, but at similar levels to several other industries covered in the survey. In the four<br />
quarters to March 2010 the Labour Price Index survey indicates mining earnings rose by 3.4 per<br />
cent over this period while for all industries, wages rose by 2.6 per cent. Construction wages<br />
also rose by 2.9 per cent over this period (ABS 2010d).<br />
46 | <strong>National</strong> <strong>Resources</strong> <strong>Sector</strong> <strong>Employment</strong> <strong>Taskforce</strong>: <strong>Technical</strong> <strong>Paper</strong>
5.3 The potential for skills gaps<br />
The <strong>Taskforce</strong> has modelled potential skills demand against potential supply from the<br />
vocational education and training sector, higher education and the unemployed. From this<br />
modelling it has attempted to estimate skills gaps—that is, where demand for skills exceeds<br />
skills supply.<br />
5.4 Skills demand<br />
In Chapter 3, the <strong>Taskforce</strong> identified three key outcomes:<br />
• the creation of up to 45,000 non-ongoing jobs in each of 2012 and 2013 in project<br />
construction (medium-growth scenario)<br />
• the creation of up to 61,500 new jobs in mining operations by 2015 and up to 16,000<br />
further jobs annually as a result of people leaving the industry<br />
• The number of new jobs in gas operations will be between 1,800 and 3,200. There will<br />
be strong jobs growth for drillers (Queensland only), operators, electrical trades and<br />
mechanical technicians. Replacement demand in gas operations could be around 2,000<br />
people per annum, including approximately 500 retirements.<br />
Around half these jobs will be in professions and trades, and half in less skilled<br />
occupations, including significant jobs growth for plant and machinery operators and drillers<br />
in Queensland.<br />
5.5 Supply of skills<br />
5.5.1 Trades<br />
A summary of supply including information from modelling suggests:<br />
• Australia has 60,000 unemployed tradespeople across all states and territories<br />
• trades completions are projected to be around 179,800 Australia wide between<br />
2010 and 2015<br />
• the resources sector (mining and gas) does not train its fair share of apprentices.<br />
5.5.2 Professions<br />
The <strong>Taskforce</strong>’s analysis suggests the number of completions from university engineering<br />
courses is projected to grow by 11.2 per cent from 6,312 in 2008 to 7,020 in 2014, with a<br />
significant increase in mining, chemical and civil engineering. The number of completions<br />
in geoscience is projected to increase from 2009 to 2011 and then decrease by 18.8 per cent<br />
(see Appendix IV).<br />
5.5.3 Other<br />
While the resources sector attracts labour from other industries, there is also a significant<br />
supply of labour available to meet its needs for less skilled positions from the unemployed<br />
(with support and training), those not currently in the labour force and new entrants over<br />
the next five years.<br />
<strong>National</strong> <strong>Resources</strong> <strong>Sector</strong> <strong>Employment</strong> <strong>Taskforce</strong>: <strong>Technical</strong> <strong>Paper</strong> | 47
5.6 Supply gaps<br />
5.6.1 Trades<br />
The <strong>Taskforce</strong> estimates the number of new trade positions required as a result of expansion in<br />
the mining and gas sectors will be around 16,000 and replacement demand will be about 4,400<br />
per annum, that is, 22,000 over 2010–2015.<br />
As construction project jobs are short term the <strong>Taskforce</strong> has assumed the 39,000 short-term<br />
trades jobs required during construction over 2010–2015 (under the medium case scenario) will<br />
each last on average for a 12-month period—ie 7,800 trades required at any point in time (but<br />
in reality there will be peak periods of trades employment).<br />
NCVER projections suggest there will be around 179,800 trade completions over the five<br />
year period 2010–2015 (see NCVER report, Appendix Table A2 at www.deewr.gov.au/nrset).<br />
Historically the resources sector has employed 5.6 per cent of all tradespeople. If the resources<br />
sector recruits 5.6 per cent of anticipated completions to 2015, then the implied supply of<br />
around 10,000 tradespeople to the resources sector between 2010 and 2015 would be well<br />
below projected new jobs in the period ahead, suggesting a supply imbalance of around<br />
35,800. Outcomes are shown in Table 23.<br />
Table 23: Projected supply of trades versus projected new and replacement jobs<br />
Number of<br />
new jobs for<br />
tradespeople<br />
2010 to 2015<br />
Construction 7,800<br />
Mining<br />
15,000<br />
operations<br />
Gas operations 1,000<br />
Total new<br />
jobs for<br />
tradespeople<br />
(construction,<br />
mining and gas<br />
operations)<br />
Jobs as a result<br />
of attrition<br />
(mining and<br />
gas)<br />
Supply of<br />
tradespeople<br />
(construction,<br />
mining and gas<br />
operations)<br />
Projected<br />
shortfall of<br />
tradespeople<br />
23,800 22,000 10,000 35,800<br />
Source: <strong>Taskforce</strong> estimates based on ABS 2008b, Karmel and Mlotkowski, 2010<br />
Note: Estimates include construction, mining and gas operations except in the column estimating ‘jobs as a result of<br />
attrition’—here construction has been excluded because it is difficult to estimate the attrition rate for construction<br />
jobs in the resources sector and the jobs are short-term project positions.<br />
5.6.2 Professions<br />
The <strong>Taskforce</strong> notes the potential for creation of around 16,800 short-term professional<br />
jobs in construction, around 9,600 professional jobs in mining and possibly a further 1,000<br />
professional jobs in gas operations over the period to 2015.<br />
The <strong>Taskforce</strong> has modelled skills demand and supply balances for the key resources sector<br />
professions, such as engineering. The same approach is followed in modelling supply/demand<br />
imbalances for the professions as is used for modelling trades jobs. The <strong>Taskforce</strong> has assumed<br />
the estimated professional jobs created during construction last an average of one year.<br />
48 | <strong>National</strong> <strong>Resources</strong> <strong>Sector</strong> <strong>Employment</strong> <strong>Taskforce</strong>: <strong>Technical</strong> <strong>Paper</strong>
5.6.3 Engineers<br />
Engineers Australia (EA) has expressed concern about the supply of engineers. In its<br />
submission to the <strong>Taskforce</strong>, EA noted recent increases in higher education completions for<br />
undergraduate domestic engineering students, but commented that recent increases only<br />
reverse the falling trend since 2001 and before. EA contended to meet demand, engineering<br />
graduations need to increase substantially. EA also suggested more migrant engineers need to<br />
be attracted to Australia, especially into the construction and scientific and technical services<br />
industries. In particular, EA stressed that more engineers at the Level 3 and Level 4 (15 to 20<br />
years of experience) were required through the migration program.<br />
Table 24 provides projections of supply to the resources sector, compared with projected new<br />
jobs for engineers and losses to attrition over the period to 2015.<br />
The estimates suggest the resources sector will not face an absolute shortfall of engineers,<br />
given the national supply is projected to significantly exceed demand for engineers in the<br />
resources sector. However, the resources sector will need to recruit heavily to meet its needs<br />
(10 per cent of all engineering graduates). The sector has historically employed around<br />
4 per cent of graduates so it will need to more than double its recruitment of graduates<br />
and if successful may cause skills supply issues for other industries.<br />
Table 24: Projected supply of engineers versus projected new and replacement jobs,<br />
2010 to 2015<br />
Number of<br />
new jobs for<br />
engineers<br />
2010 to 2015<br />
Construction 780<br />
Mining<br />
3,205<br />
operations<br />
Gas operations 400<br />
Total new jobs<br />
for engineers<br />
(construction,<br />
mining<br />
and gas)<br />
Jobs as a<br />
result of<br />
attrition<br />
(mining<br />
and gas)<br />
Supply of<br />
engineers<br />
(new<br />
graduates)<br />
Projected<br />
shortfall of<br />
engineers<br />
4,385 2,100 40,000 NO SHORTFALL<br />
Source: <strong>Taskforce</strong> estimates based on ABS 2008b and Karmel and Mlotkowski, 2010<br />
Notes: Assumes employment share for engineers in resources remains constant over projection period<br />
compared to base period.<br />
Estimates include construction, mining and gas operations except in the column estimating ‘jobs as a result of<br />
attrition’—here construction has been excluded because it is difficult to estimate the attrition rate for construction<br />
jobs in the resources sector and the jobs are short-term project positions.<br />
<strong>National</strong> <strong>Resources</strong> <strong>Sector</strong> <strong>Employment</strong> <strong>Taskforce</strong>: <strong>Technical</strong> <strong>Paper</strong> | 49
5.6.4 Mining engineers (includes petroleum engineers)<br />
Mining engineers account for around 40 per cent of all engineers in the resources sector<br />
(ie around 4,900). For the period 2010–2015, <strong>Taskforce</strong> modelling suggests there will be 1,600<br />
new jobs for engineers and 1,300 due to replacement demand (estimated at 260 per annum—<br />
around 5.3 per cent). The sector could therefore be looking to recruit 2,900 mining engineers.<br />
The supply from new graduates should be around 1,200 so unless the sector can reduce<br />
attrition and attract engineers working in other industries, there could be a shortfall of 1,700<br />
over the next five years.<br />
5.6.5 Geoscientists<br />
Around 3,400 people are employed as geoscientists in the resources sector. For the period<br />
2010–2015, <strong>Taskforce</strong> modelling suggests there will be 2,200 new jobs for geoscientists and<br />
1,650 due to replacement demand (estimated at 330 per annum—around 9.7 per cent). The<br />
sector could therefore be looking to recruit around 3,800 geoscientists. The supply from new<br />
graduates should be around 800 leaving a potential short fall of around 3,000. However, as<br />
approximately 70 per cent of people with geoscience qualifications work outside the<br />
resources sector, there may be scope for companies to recruit these people.<br />
5.6.6 Other<br />
Modelling presented earlier in this report suggested the expansion of mining operations could<br />
lead to the creation of 21,400 positions for machinery operators and drivers. In construction,<br />
a further 36,200 short-term project positions could be created for machinery operators and<br />
drivers, together with 35,500 short-term positions for labourers. This skill need could be<br />
addressed by recruiting from the unemployed including those who have lost jobs through the<br />
global recession, those not in the labour force and new entrants to the labour market over the<br />
next five years.<br />
5.7 Competing demands for construction skills sought by the<br />
resources sector<br />
As the economy strengthens there will be competing demands for skills from other industries<br />
with competition from infrastructure projects particularly relevant given the skills required.<br />
While Treasury anticipates strong growth in business investment in 2010–11 and that dwelling<br />
investment will rise, it suggests that: ‘Investment in new non-residential building, by contrast,<br />
is expected to remain subdued. Outside of stimulus-related activity, there is a limited pipeline<br />
of work in the building sector, reflecting credit constraints, high vacancy rates and soft<br />
property prices. Despite support from the Government’s Building the Education Revolution<br />
program, investment in this sector has fallen sharply over the past year. This weakness is<br />
expected to continue into 2010–11 with investment forecast to fall by a further 6.5 per cent’<br />
(Australian Treasury 2010a).<br />
50 | <strong>National</strong> <strong>Resources</strong> <strong>Sector</strong> <strong>Employment</strong> <strong>Taskforce</strong>: <strong>Technical</strong> <strong>Paper</strong>
Treasury noted that as commercial property vacancy rates stabilise and previously built floor<br />
space is absorbed through the broader economic recovery, building approvals are expected<br />
to recover during 2011, leading to renewed activity in the sector. This is expected to lead to a<br />
modest recovery in investment in 2011–12, with growth of 4 per cent.<br />
This suggests limited competing demand for construction skills for the next 12–18 months.<br />
Over $70 billion worth of major non-resources infrastructure projects ($100 million+) have<br />
been identified across Australia that are due to start construction in the next two years or<br />
are already underway. The listing at Figure 13 is not comprehensive as there are additional<br />
projects where a final decision to proceed has yet to be made. Where the dates of projects<br />
were not stated by sources, construction periods have not been included. Information on<br />
all major infrastructure projects expected to be undertaken in the next five years is not<br />
available. For example, the next five-year Nation Building—Economic Stimulus Plan program<br />
(2014–2019) is not due to be announced until 2012–13. This will include major Australian<br />
Government‐funded infrastructure projects around Australia.<br />
New South Wales has the highest total dollar value of known major infrastructure projects<br />
of $19.6 billion, Victoria $17.3 billion, Queensland $11.9 billion, and Western Australia $9.9<br />
billion. This includes Building the Education Revolution (BER) projects but excludes the<br />
federally funded Australian Rail Track Corporation—Economic Stimulus Package Projects<br />
($1.188 billion), as the funding is allocated to the Corporation and the state-by-state breakup<br />
is not available (Figure 13).<br />
Across Australia, the types of construction projects include rail, road, port, hospitals and<br />
sporting complexes. It appears that construction activity will be strongest in 2012–2013 when<br />
construction in the resources sector is also expected to peak (average growth scenario).<br />
<strong>National</strong> <strong>Resources</strong> <strong>Sector</strong> <strong>Employment</strong> <strong>Taskforce</strong>: <strong>Technical</strong> <strong>Paper</strong> | 51
Figure 13: Other major infrastructure projects<br />
Source: <strong>Taskforce</strong> analysis<br />
52 | <strong>National</strong> <strong>Resources</strong> <strong>Sector</strong> <strong>Employment</strong> <strong>Taskforce</strong>: <strong>Technical</strong> <strong>Paper</strong>
5.8 Skills shortages are limited to date but will increase<br />
The labour market is tightening with some professions experiencing shortages, such as<br />
mining engineers, mining production managers, geologists in some locations, geophysicists<br />
and automotive trades.<br />
Table 25 details the consolidated views of stakeholders about current and emerging skills<br />
shortages, by occupation. It also includes views provided to the <strong>Taskforce</strong> through submissions,<br />
surveys and consultations. Pit Crew (Table 26) has suggested Western Australia is currently<br />
only facing shortages for electricians, and construction and mining labourers, but that by<br />
early 2012, will be facing shortages in most of the key trades in the construction and resources<br />
sectors, such as electricians, structural steel tradespeople, fitters, earthmoving contractors,<br />
structural steel construction workers and motor mechanics. In Queensland, skill shortages<br />
are expected for civil, electrical and mechanical engineers and mechanical engineering<br />
tradespeople and electricians.<br />
<strong>National</strong> <strong>Resources</strong> <strong>Sector</strong> <strong>Employment</strong> <strong>Taskforce</strong>: <strong>Technical</strong> <strong>Paper</strong> | 53
Table 25: Current and emerging skills shortages, 2010 onwards<br />
Resource occupations* DEEWR <strong>Taskforce</strong> CPSISC<br />
Skills<br />
DMC<br />
Pit<br />
Crew<br />
WA<br />
Energy<br />
Skills<br />
QLD RESA MISC<br />
Managers P P P P<br />
Construction managers P P P<br />
Production manager (mining) P P P P<br />
Professions<br />
Civil engineer P P P P<br />
Electrical engineer P P P P<br />
Mechanical engineer P P P P<br />
Mining engineer P P P P<br />
Petroleum engineer P P P<br />
Geoscience P P P P P P<br />
Surveyor P P P P<br />
Trades<br />
Metal fabricator P P P<br />
Welder P P<br />
Fitter (general) P P P<br />
Metal machinist P P P<br />
Carpenter P P P<br />
Plumber (general) P P<br />
Electrician P P P P P<br />
Motor mechanic (includes diesel P P P P P<br />
mechanic)<br />
Automotive electrician P P<br />
Electronics and telecommunications<br />
P P P P<br />
tradespeople<br />
Other<br />
Driller<br />
P<br />
Chemical, gas, petroleum and power<br />
P P P P<br />
plant operator<br />
Building and engineering technician P P P P<br />
Construction and mining labourer P P<br />
Crane, lift and hoist operators P P<br />
Source: <strong>Taskforce</strong> analysis 2010; <strong>Taskforce</strong> submissions, surveys and consultations 2010; CPSISC 2010; Skills DMC<br />
2010; The Pit Crew Report WA 2009 in WA Department of Training and Workforce Development 2010; Energy Skills<br />
Queensland (ESQ), 2009; <strong>Resources</strong> and Engineering Skills Alliance (RESA) 2009; Industry consultations; MISC 2009<br />
Notes: * The table uses occupations listed in the skill shortages in resources occupations table in Appendix V,<br />
DEEWR unpublished data 2010, with the following additions: manager, construction manager, geoscience<br />
(includes geologists and geophysicists), surveyor, electronics and telecommunications trades workers,<br />
building and engineering technician, construction and mining labourer, and crane, lift and hoist operator.<br />
54 | <strong>National</strong> <strong>Resources</strong> <strong>Sector</strong> <strong>Employment</strong> <strong>Taskforce</strong>: <strong>Technical</strong> <strong>Paper</strong>
Table 26: Pit Crew Management Consulting Services Pty Ltd, workforce analysis by ANZCO category, November 2009–November 2013<br />
ANZSCO<br />
category<br />
November<br />
quarter<br />
2009<br />
February<br />
quarter<br />
2010<br />
May<br />
quarter<br />
2010<br />
August<br />
quarter<br />
2010<br />
November<br />
quarter<br />
2010<br />
February<br />
quarter<br />
2011<br />
May<br />
quarter<br />
2011<br />
August<br />
quarter<br />
2011<br />
November<br />
quarter<br />
2011<br />
February<br />
quarter<br />
2012<br />
May<br />
quarter<br />
2012<br />
August<br />
quarter<br />
2012<br />
November<br />
quarter<br />
2012<br />
February<br />
quarter<br />
2013<br />
May<br />
quarter<br />
2013<br />
3223<br />
Structural<br />
steel and<br />
welding<br />
Tradespeople<br />
About level<br />
About<br />
level<br />
About<br />
level<br />
Some<br />
availability<br />
Some<br />
availability<br />
Some<br />
availability<br />
About<br />
level<br />
About<br />
level<br />
About level<br />
Moderate<br />
shortage<br />
Moderate<br />
shortage<br />
High<br />
shortage<br />
High<br />
shortage<br />
High<br />
shortage<br />
High<br />
shortage<br />
3232 Fitters About level<br />
About<br />
level<br />
About<br />
level<br />
Some<br />
availability<br />
Some<br />
availability<br />
Some<br />
availability<br />
Some<br />
availability<br />
Some<br />
availability<br />
About level<br />
Moderate<br />
shortage<br />
Moderate<br />
shortage<br />
High<br />
shortage<br />
High<br />
shortage<br />
High<br />
shortage<br />
High<br />
shortage<br />
3411<br />
Electricians<br />
Moderate<br />
shortage<br />
High<br />
shortage<br />
High<br />
shortage<br />
Moderate<br />
shortage<br />
Moderate<br />
shortage<br />
About<br />
level<br />
About<br />
level<br />
About<br />
level<br />
About level<br />
About<br />
level<br />
About<br />
level<br />
High<br />
shortage<br />
High<br />
shortage<br />
Acute<br />
shortage<br />
Acute<br />
shortage<br />
7212<br />
Earthmoving<br />
plant<br />
operators<br />
About level<br />
Some<br />
availability<br />
Some<br />
availability<br />
Some<br />
availability<br />
About level<br />
Moderate<br />
shortage<br />
Moderate<br />
shortage<br />
High<br />
shortage<br />
Acute<br />
shortage<br />
Acute<br />
shortage<br />
High<br />
shortage<br />
High<br />
shortage<br />
Moderate<br />
shortage<br />
About<br />
level<br />
Some<br />
availability<br />
8217<br />
Structural<br />
steel<br />
construction<br />
workers<br />
About level<br />
About<br />
level<br />
About<br />
level<br />
Some<br />
availability<br />
Some<br />
availability<br />
About<br />
level<br />
About<br />
level<br />
About<br />
level<br />
Moderate<br />
shortage<br />
High<br />
shortage<br />
High<br />
shortage<br />
High<br />
shortage<br />
High<br />
shortage<br />
High<br />
shortage<br />
High<br />
shortage<br />
3212 Motor<br />
mechanics<br />
About level<br />
About<br />
level<br />
Some<br />
availability<br />
Some<br />
availability<br />
About level<br />
About<br />
level<br />
Moderate<br />
shortage<br />
High<br />
shortage<br />
High<br />
shortage<br />
High<br />
shortage<br />
High<br />
shortage<br />
High<br />
shortage<br />
High<br />
shortage<br />
High<br />
shortage<br />
Moderate<br />
shortage<br />
7121 Crane,<br />
lift & hoist<br />
operators<br />
About level<br />
About<br />
level<br />
Some<br />
availability<br />
Some<br />
availability<br />
About level<br />
About<br />
level<br />
Moderate<br />
shortage<br />
Moderate<br />
shortage<br />
High<br />
shortage<br />
High<br />
shortage<br />
High<br />
shortage<br />
High<br />
shortage<br />
High<br />
shortage<br />
High<br />
shortage<br />
Moderate<br />
shortage<br />
3312<br />
Carpenters &<br />
joiners<br />
Some<br />
availability<br />
Some<br />
availability<br />
Some<br />
availability<br />
Some<br />
availability<br />
Some<br />
availability<br />
Moderate<br />
shortage<br />
Moderate<br />
shortage<br />
High<br />
shortage<br />
Acute<br />
shortage<br />
Acute<br />
shortage<br />
Acute<br />
shortage<br />
High<br />
shortage<br />
About level<br />
Some<br />
availability<br />
Some<br />
availability<br />
8212<br />
Concreters<br />
Some<br />
availability<br />
Some<br />
availability<br />
Some<br />
availability<br />
Some<br />
availability<br />
Some<br />
availability<br />
Moderate<br />
shortage<br />
Moderate<br />
shortage<br />
High<br />
shortage<br />
Acute<br />
shortage<br />
Acute<br />
shortage<br />
Acute<br />
shortage<br />
High<br />
shortage<br />
About level<br />
Some<br />
availability<br />
Some<br />
availability<br />
8219 Other<br />
construction<br />
& mining<br />
labourers<br />
Moderate<br />
shortage<br />
Moderate<br />
shortage<br />
Moderate<br />
shortage<br />
About<br />
level<br />
Some<br />
availability<br />
Some<br />
availability<br />
Some<br />
availability<br />
Some<br />
availability<br />
Some<br />
availability<br />
About<br />
level<br />
Moderate<br />
shortage<br />
High<br />
shortage<br />
Acute<br />
shortage<br />
Acute<br />
shortage<br />
Acute<br />
shortage<br />
Source: The Pit Crew Report WA 2009 in WA Department of Training and Workforce Development 2010.<br />
Note:This table provides a one-page summary showing the anticipated relative difficulty in the resourcing of projects over the next 2–3 years,<br />
which ranges from acute shortage to good availability with respect to the ability to recruit specific skills originating from Western Australia.<br />
August<br />
quarter<br />
2013<br />
High<br />
shortage<br />
High<br />
shortage<br />
Acute<br />
shortage<br />
Some<br />
availability<br />
Moderate<br />
shortage<br />
About<br />
level<br />
About<br />
level<br />
Some<br />
availability<br />
Some<br />
availability<br />
High<br />
shortage<br />
November<br />
quarter<br />
2013<br />
Moderate<br />
shortage<br />
Moderate<br />
shortage<br />
Acute<br />
shortage<br />
Some<br />
availability<br />
About level<br />
Some<br />
availability<br />
Some<br />
availability<br />
Some<br />
availability<br />
Some<br />
availability<br />
High<br />
shortage<br />
<strong>National</strong> <strong>Resources</strong> <strong>Sector</strong> <strong>Employment</strong> <strong>Taskforce</strong>: <strong>Technical</strong> <strong>Paper</strong> | 55
5.9 Summary<br />
The <strong>Taskforce</strong>’s analysis indicates skills shortages will occur in a number of professional,<br />
technician and trades, and plant and machinery occupations important to the resources sector,<br />
with the likelihood these shortages will intensify around 2011–2012.<br />
The potential skill shortages include:<br />
• engineering professionals in a number of disciplines, including mining engineering, civil<br />
and mechanical engineering and geoscientists, including geologists and geophysicists.<br />
Geoscientists could be in severe shortage<br />
• trades, including fabrication (particularly welders), electricians, mechanics (including<br />
diesel mechanics)<br />
• machinery and plant operators, including machinery operators and drivers, stationary<br />
plant operators and truck drivers.<br />
As the economy strengthens, there will be competing demand for skills from other industries.<br />
Employers will need to have strategies to attract and retain labour. While higher wages have<br />
attracted many to the sector, it is clear many employees are interested in other conditions as<br />
well, including access to training, career progression and a family-friendly work environment.<br />
Increasing competition for graduates and skilled workers highlights the importance of<br />
attraction and retention strategies. Shah and Burke’s analysis (Shah and Burke 2004), while<br />
dated, suggested the ‘probability of job separation’ from the mining sector is relatively high,<br />
compared to other industries. This suggests employers need to be as innovative as possible in<br />
sourcing local labour where available (anecdotal advice to the <strong>Taskforce</strong> suggests turnover is<br />
higher for FIFO workers) as well as finding ways to reduce skills attrition.<br />
Skills shortages are likely to appear first in Western Australia and in regional Queensland<br />
(Bowen Basin initially and later the Surat Basin and around Gladstone). The construction sector<br />
has used a FIFO/DIDO workforce skills solution for many years. Further growth in FIFO/DIDO<br />
numbers seems likely in the period ahead where project work has a limited life. This expansion<br />
of FIFO has been facilitated by increases in flights from other centres, including from Brisbane,<br />
Melbourne and Sydney to Karratha. For communities, such as Cairns, with above average<br />
unemployment rates, FIFO jobs can present important employment opportunities in both<br />
construction and operations of resources projects.<br />
5.9.1 Trades<br />
Other than attracting tradespeople from other industries, the main short-term options to<br />
increase the supply of skills to the resources sector include recruiting from the unemployed<br />
and through temporary or permanent migration. Australia has 60,000 unemployed<br />
tradespeople across all states and territories, including a pool of fabrication tradespeople<br />
(including welders) and electricians, which are key trades for the sector (see Appendix III).<br />
In the longer term, the resources sector should consider increasing its training activities in<br />
regard to the trades, noting the NCVER’s conclusion that it does not undertake its ‘fair share’<br />
of training—adult apprenticeships are an option given the sector’s reluctance to employ<br />
young people and a number of companies already use this strategy.<br />
56 | <strong>National</strong> <strong>Resources</strong> <strong>Sector</strong> <strong>Employment</strong> <strong>Taskforce</strong>: <strong>Technical</strong> <strong>Paper</strong>
5.9.2 Professions<br />
In the short term, besides attracting professionals from other industries, the main options<br />
appear to be:<br />
• recruit from the unemployed (Australia has 48,000 unemployed professionals)<br />
(see Appendix III)<br />
• increase the number of students completing relevant degrees at university<br />
• increase the sector’s recruitment of graduates<br />
• utilise temporary or permanent migration.<br />
In the longer term, promoting career paths in the resources sector to prospective students, and<br />
working with universities to ensure increased demand for places can be met, may add to the<br />
supply of skills in key professions relevant to the industry. Again FIFO/DIDO can play a role in<br />
meeting skills needs, particularly through recruitment from areas with high unemployment.<br />
5.9.3 Less skilled occupations<br />
Demand for labour in some of the less-skilled occupations can be addressed by recruiting<br />
workers from other industries and accessing the unemployed with appropriate skills training.<br />
<strong>National</strong> <strong>Resources</strong> <strong>Sector</strong> <strong>Employment</strong> <strong>Taskforce</strong>: <strong>Technical</strong> <strong>Paper</strong> | 57
Appendix I—<strong>Taskforce</strong> modelling outcomes<br />
Construction<br />
Table 27: Heavy and civil engineering construction projection for technicians and trades<br />
workers and machinery operators and drivers (short-term jobs), 2009 to 2016<br />
Occupation<br />
Low<br />
Growth<br />
Scenario<br />
Medium<br />
Growth<br />
Scenario<br />
High<br />
Growth<br />
Scenario<br />
Managers 10,485 17,329 25,994<br />
Professionals 10,137 16,755 25,133<br />
Professionals, not further defined 52 85 128<br />
Arts and Media Professionals, not further defined 0 0 0<br />
Arts Professionals 0 0 0<br />
Media Professionals 22 37 55<br />
Business, Human Resource and Marketing Professionals,<br />
0 0 0<br />
not further defined<br />
Accountants, Auditors and Company Secretaries 529 874 1,311<br />
Financial Brokers and Dealers, and Investment Advisers 23 39 58<br />
Human Resource and Training Professionals 912 1,508 2,262<br />
Information and Organisation Professionals 371 614 921<br />
Sales, Marketing and Public Relations Professionals 130 215 323<br />
Design, Engineering, Science and Transport Professionals,<br />
15 24 37<br />
not further defined<br />
Air and Marine Transport Professionals 180 297 445<br />
Architects, Designers, Planners and Surveyors 682 1128 1692<br />
Engineering Professionals 3,385 5,595 8,393<br />
Natural and Physical Science Professionals 2,730 4,512 6,768<br />
Education Professionals, not further defined 18 30 46<br />
School Teachers 4 6 9<br />
Tertiary Education Teachers 172 285 427<br />
Miscellaneous Education Professionals 9 14 21<br />
Health Professionals, not further defined 5 8 12<br />
Health Diagnostic and Promotion Professionals 445 736 1,104<br />
Health Therapy Professionals 10 16 24<br />
Medical Practitioners 11 18 27<br />
Midwifery and Nursing Professionals 60 100 149<br />
ICT Professionals, not further defined 57 93 140<br />
Business and Systems Analysts, and Programmers 69 114 171<br />
Database and Systems Administrators, and ICT Security<br />
117 193 290<br />
Specialists<br />
ICT Network and Support Professionals 49 81 122<br />
Legal, Social and Welfare Professionals, not further defined 0 0 0<br />
Legal Professionals 11 18 27<br />
Social and Welfare Professionals 69 114 171<br />
Technicians and Trades Workers 23,664 39,112 58,668<br />
Technicians and Trades Workers, not further defined 498 823 1,235<br />
Engineering, ICT and Science Technicians, not further defined 71 118 177<br />
58 | <strong>National</strong> <strong>Resources</strong> <strong>Sector</strong> <strong>Employment</strong> <strong>Taskforce</strong>: <strong>Technical</strong> <strong>Paper</strong>
Agricultural, Medical and Science Technicians 89 147 220<br />
Building and Engineering Technicians 5,008 8,278 12,417<br />
ICT and Telecommunications Technicians 363 600 900<br />
Automotive and Engineering Trades Workers, not further<br />
31 51 77<br />
defined<br />
Automotive Electricians and Mechanics 897 1,483 2,225<br />
Fabrication Engineering Trades Workers 3,159 5,222 7,833<br />
Mechanical Engineering Trades Workers 3,710 6,131 9,197<br />
Panelbeaters, and Vehicle Body Builders, Trimmers and<br />
112 185 278<br />
Painters<br />
Construction Trades Workers, not further defined 69 115 172<br />
Bricklayers, and Carpenters and Joiners 1,432 2,367 3,550<br />
Floor Finishers and Painting Trades Workers 97 159 239<br />
Glaziers, Plasterers and Tilers 118 195 292<br />
Plumbers 2,387 3,946 5,919<br />
Electrotechnology and Telecommunications Trades Workers, 85 140 211<br />
not further defined<br />
Electricians 2,094 3,461 5,192<br />
Electronics and Telecommunications Trades Workers 2,480 4,099 6,149<br />
Food Trades Workers 56 93 139<br />
Skilled Animal and Horticultural Workers, not further defined 0 0 0<br />
Animal Attendants and Trainers, and Shearers 8 13 19<br />
Horticultural Trades Workers 473 782 1,172<br />
Other Technicians and Trades Workers, not further defined 0 0 0<br />
Hairdressers 6 10 14<br />
Printing Trades Workers 6 10 14<br />
Textile, Clothing and Footwear Trades Workers 6 10 14<br />
Wood Trades Workers 21 35 53<br />
Miscellaneous Technicians and Trades Workers 388 641 962<br />
Community and Personal Service Workers 234 386 579<br />
Clerical and Administrative Workers 12,596 20,819 31,229<br />
Sales Workers 842 1,391 2,086<br />
Machinery Operators And Drivers 21,892 36,184 54,275<br />
Machinery Operators and Drivers, not further defined 494 816 1225<br />
Machine and Stationary Plant Operators, not further defined 69 115 172<br />
Machine Operators 1,239 2,047 3,071<br />
Stationary Plant Operators 2,296 3,795 5,692<br />
Mobile Plant Operators 11,981 19,803 29,704<br />
Road and Rail Drivers, not further defined 268 443 665<br />
Automobile, Bus and Rail Drivers 233 386 579<br />
Delivery Drivers 60 99 148<br />
Truck Drivers 4,762 7,870 11,805<br />
Storepersons 490 810 1,215<br />
Labourers 21,452 35,456 53,184<br />
Other 1,679 2,776 4,163<br />
TOTAL 102,981 170,209 255,313<br />
Sources: <strong>Taskforce</strong> estimates based on ABS 2010a; ABS 2010b<br />
<strong>National</strong> <strong>Resources</strong> <strong>Sector</strong> <strong>Employment</strong> <strong>Taskforce</strong>: <strong>Technical</strong> <strong>Paper</strong> | 59
Mining<br />
Table 28: Projections of growth in mining employment (less oil and gas) 2008 to 2015,<br />
by occupation<br />
Occupation<br />
Base<br />
<strong>Employment</strong><br />
(2008)<br />
<strong>Employment</strong><br />
Growth<br />
Projected<br />
<strong>Employment</strong><br />
(2015)<br />
Managers 13,977 5,571 19,548<br />
Professionals 24,080 9,598 33,678<br />
Professionals, not further defined 123 49 172<br />
Arts and media professionals,<br />
not further defined 0 0 0<br />
Arts professionals 0 0 0<br />
Media professionals 53 21 74<br />
Business, human resource and marketing<br />
professionals, not further defined 0 0 0<br />
Accountants, auditors and company<br />
secretaries 1,256 501 1,757<br />
Financial brokers and dealers,<br />
and investment advisers 55 22 78<br />
Human resource and training professionals 2,167 864 3,031<br />
Information and organisation professionals 882 352 1,234<br />
Sales, marketing and public relations<br />
professionals 310 123 433<br />
Design, engineering, science and transport<br />
professionals, not further defined 35 14 49<br />
Air and marine transport professionals 426 170 596<br />
Architects, designers, planners and surveyors 1,621 646 2,267<br />
Engineering professionals 8,041 3,205 11,247<br />
Natural and physical science professionals 6,485 2,585 9,069<br />
Education professionals, not further defined 44 17 61<br />
School teachers 9 3 12<br />
Tertiary education teachers 409 163 572<br />
Miscellaneous education professionals 20 8 29<br />
Health professionals, not further defined 12 5 16<br />
Health diagnostic and promotion<br />
professionals 1,057 421 1,479<br />
Health therapy professionals 23 9 33<br />
Medical practitioners 26 10 37<br />
Midwifery and nursing professionals 143 57 200<br />
ICT professionals, not further defined 134 54 188<br />
Business and systems analysts and<br />
programmers 164 65 229<br />
Database and systems administrators, and<br />
ICT security specialists 277 111 388<br />
ICT network and support professionals 117 47 163<br />
Legal, social and welfare professionals, not<br />
further defined 0 0 0<br />
Legal professionals 26 10 37<br />
Social and welfare professionals 164 65 229<br />
60 | <strong>National</strong> <strong>Resources</strong> <strong>Sector</strong> <strong>Employment</strong> <strong>Taskforce</strong>: <strong>Technical</strong> <strong>Paper</strong>
Technicians and tradespeople 37,833 15,080 52,913<br />
Technicians and tradespeople, not further<br />
defined 671 267 938<br />
Engineering, ICT and science technicians,<br />
not further defined 38 15 54<br />
Agricultural, medical and science technicians 1,035 413 1,448<br />
Building and engineering technicians 8,649 3,447 12,097<br />
ICT and telecommunications technicians 151 60 211<br />
Automotive and engineering tradespeople,<br />
not further defined 95 38 133<br />
Automotive electricians and mechanics 1,542 615 2,157<br />
Fabrication engineering tradespeople 2,870 1,144 4,014<br />
Mechanical engineering tradespeople 13,741 5,477 19,218<br />
Panelbeaters, and vehicle body builders,<br />
trimmers and painters 28 11 40<br />
Construction tradespeople, not further<br />
defined 12 5 16<br />
Bricklayers, and carpenters and joiners 268 107 374<br />
Floor finishers and painting tradespeople 59 23 82<br />
Glaziers, plasterers and tilers 20 8 28<br />
Plumbers 191 76 267<br />
Electrotechnology and telecommunications<br />
tradespeople, not further defined 94 37 131<br />
Electricians 5,751 2,292 8,043<br />
Electronics and telecommunications<br />
tradespeople 468 187 655<br />
Food tradespeople 361 144 505<br />
Skilled animal and horticultural workers, not<br />
further defined 0 0 0<br />
Animal attendants and trainers, and shearers 0 0 0<br />
Horticultural tradespeople 95 38 133<br />
Other technicians and tradespeople, not<br />
further defined 0 0 0<br />
Hairdressers 0 0 0<br />
Printing tradespeople 8 3 12<br />
Textile, clothing and footwear tradespeople 20 8 28<br />
Wood tradespeople 0 0 0<br />
Miscellaneous technicians and tradespeople 1,666 664 2,330<br />
Community and personal service workers 733 292 1,024<br />
Clerical and administrative workers 13,791 5,497 19,287<br />
Sales workers 597 238 835<br />
<strong>National</strong> <strong>Resources</strong> <strong>Sector</strong> <strong>Employment</strong> <strong>Taskforce</strong>: <strong>Technical</strong> <strong>Paper</strong> | 61
Machinery operators and drivers 53,621 21,372 74,993<br />
Machinery operators and drivers,<br />
not further defined 1,328 529 1,858<br />
Machine and stationary plant operators,<br />
not further defined 64 25 89<br />
Machine operators 1,068 426 1,493<br />
Stationary Plant operators 40,334 16,076 56,411<br />
Mobile Plant operators 3,470 1,383 4,853<br />
Road and rail drivers, not further defined 162 65 227<br />
Automobile, bus and rail drivers 542 216 758<br />
Delivery drivers 22 9 31<br />
Truck drivers 5,639 2,248 7,887<br />
Storepeople 991 395 1,387<br />
Labourers 8,140 3,244 11,384<br />
Other 1,675 667 2,342<br />
TOTAL 154,446 61,559 216,005<br />
Source: <strong>Taskforce</strong> estimates based on ABS 2007, ABS 2008b, ABARE, Access Economics, BIS Shrapnel projections.<br />
Table 29: Projected employment growth for mining operations (excludes oil and gas),<br />
by state and territory, 2008 to 2015<br />
State/territory<br />
Base employment<br />
(2008) <strong>Employment</strong> growth<br />
Projected employment<br />
(2015)<br />
New South Wales 28,088 11,195 39,283<br />
Victoria 8,900 3,547 12,447<br />
Queensland 38,186 15,220 53,407<br />
South Australia 9,078 3,618 12,696<br />
Western Australia 64,008 25,512 89,521<br />
Tasmania 2,062 822 2,884<br />
Northern Territory 4,071 1,623 5,693<br />
TOTAL 154,393 61,537 215,931<br />
Source: <strong>Taskforce</strong> estimates based on ABS 2008a<br />
62 | <strong>National</strong> <strong>Resources</strong> <strong>Sector</strong> <strong>Employment</strong> <strong>Taskforce</strong>: <strong>Technical</strong> <strong>Paper</strong>
Appendix II—Detailed ABARE projections of<br />
commodity production 2008–2015<br />
Table 30: ABARE commodity projections 2008 to 2015*<br />
2008 2009 2010 2011 2012 2013 2014 2015<br />
change<br />
2010-<br />
2015<br />
COAL<br />
Production Mt 185.9 204.5 213.0 218.0 228.0 250.0 270.0 300.0<br />
Annual change (No.) 18.6 8.5 5.0 10.0 22.0 20.0 30.0 87.0<br />
Annual growth rate (%) 10.01 4.16 2.35 4.59 9.65 8. 11.11 40.85<br />
URANIUM<br />
Production t 10,114 10,311 8,973 10,510 10,810 11,890 12,480 13,125<br />
Annual change (No.) 197.0 -1338.0 1537.0 300.0 1080.0 590.0 645.0 4152.0<br />
Annual growth rate (%) 1.95 -12.98 17.13 2.85 9.99 4.96 5.17 46.27<br />
IRON ORE<br />
Production Mt 324.7 353.0 423.9 427.8 491.0 536.3 562.5 576.9<br />
Annual change (No.) 28.3 70.9 3.9 63.3 45.3 26.2 14.4 153.0<br />
Annual growth rate (%) 8.72 20.08 . 92 14.77 9.23 4.89 2.56 36.09<br />
METALLURGICAL COAL<br />
Production Mt 139.4 130.6 158.3 162.1 168.8 176.3 181.6 187.1<br />
Annual change (No.) -8.8 27.7 3.8 6.7 7.5 5.3 5.4 28.8<br />
Annual growth rate (%) -6.33 21.21 2.41 4.13 4.46 3.00 3.00 18.17<br />
GOLD<br />
Production t 229.7 217.9 241.6 267.5 272.0 266.1 272.8 275.8<br />
Annual change (No.) -11.9 23.7 25.9 4.5 -5.9 6.6 3.0 34.2<br />
Annual growth rate (%) -5.16 10.87 10.73 1.68 -2.16 2.50 1.11 14.17<br />
PRIMARY ALUMINIUM<br />
Production kt 1,964.0 1,973.6 1,920.4 1,931.9 1,948.4 1,944.6 1,936.9 1,940.7<br />
Annual change (No.) 9.5 -53.1 11.5 16.6 -3.9 -7.7 3.8 20.3<br />
Annual growth rate (%) 0.49 -2.69 0.60 0.86 -0.20 -0.39 0.20 1.06<br />
ALUMINA<br />
Production kt 19,358.6 19,596.9 20,203.5 21,370.0 24,440.0 25,880.0 26,080.0 26,220.0<br />
Annual change (No.) 238.3 606.6 1,166.5 3,070.0 1,440.0 200.0 140.0 6,016.5<br />
Annual growth rate (%) 1.23 3.10 5.77 14.37 5.89 0.77 0.54 29.78<br />
BAUXITE<br />
Production Mt 63.5 64.0 66.2 67.4 75.9 80.4 84.9 91.2<br />
Annual change (No.) 0.5 2.2 1.2 8.5 4.5 4.5 6.3 25.0<br />
Annual growth rate (%) 0.79 3.47 1.86 12.56 5.98 5.54 7.41 37.75<br />
NICKEL<br />
Production kt 355.6 316.6 330.9 338.2 352.4 366.8 377.7 393.2<br />
Annual change (No.) -39.0 14.3 7.3 14.2 14.4 10.8 15.6 62.3<br />
Annual growth rate (%) -10.96 4.51 2.22 4.19 4.08 2.95 4.12 18.83<br />
<strong>National</strong> <strong>Resources</strong> <strong>Sector</strong> <strong>Employment</strong> <strong>Taskforce</strong>: <strong>Technical</strong> <strong>Paper</strong> | 63
COPPER<br />
Production kt 863.0 889.7 890.2 970.9 980.6 990.6 1000.0 1037.0<br />
Annual change (No.) 26.7 0.5 80.7 9.7 10.0 9.4 37.1 146.8<br />
Annual growth rate (%) 3.10 0.06 9.06 0.99 1.02 0.95 3.71 16.49<br />
ZINC<br />
Production kt 1,571.4 1,410.8 1,335.6 1,420.6 1,484.5 1,497.0 1,522.0 1,539.0<br />
Annual change (No.) -160.6 -75.2 85.0 63.9 12.5 25.0 17.0 203.4<br />
Annual growth rate (%) -10.22 -5.33 6.36 4.50 0.84 1.67 1.12 15.23<br />
Source: ABARE 2010 *table may not add due to rounding<br />
t tonne = 1000 kilograms; kt kilotonne = 1000 tonnes; Mt megatonne = 1,000,000 tonnes<br />
64 | <strong>National</strong> <strong>Resources</strong> <strong>Sector</strong> <strong>Employment</strong> <strong>Taskforce</strong>: <strong>Technical</strong> <strong>Paper</strong>
Appendix III—Employed and unemployed by<br />
occupation<br />
Table 31: Number employed and unemployed for selected professional occupations<br />
Professionals Employed Unemployed<br />
Accountants, auditors and company secretaries 181,623 5,379<br />
Air and marine transport professionals 22,175 198<br />
Architects, designers, planners and surveyors 103,735 2,830<br />
Business and systems analysts, and programmers 113,635 3,045<br />
Database and systems administrators, and ICT security specialists 32,148 1,011<br />
Engineering professionals 119,645 3,794<br />
Human resource and training professionals 81,512 1,897<br />
ICT network and support professionals 46,332 1,194<br />
Information and organisation professionals 117,664 2,586<br />
Legal professionals 70,205 914<br />
Media professionals 53,497 2,288<br />
Natural and physical science professionals 90,544 2,232<br />
Sales, marketing and public relations professionals 109,318 3,543<br />
Tertiary education teachers 81,093 1,784<br />
Total Professionals 2,300,704 48,172<br />
Source: ABS 2010a; ABS 2010c<br />
<strong>National</strong> <strong>Resources</strong> <strong>Sector</strong> <strong>Employment</strong> <strong>Taskforce</strong>: <strong>Technical</strong> <strong>Paper</strong> | 65
Table 32: Number employed and unemployed for selected technician and tradespeople<br />
occupations<br />
Technicians and tradespeople Employed Unemployed<br />
Agricultural, medical and science technicians 50,591 1,157<br />
Automotive electricians and mechanics 94,203 2,425<br />
Bricklayers, carpenters and joiners 144,267 6,325<br />
Building and engineering technicians 115,725 4,189<br />
Electricians 126,972 3,270<br />
Electronics and telecommunications tradespeople 90,616 3,873<br />
Fabrication engineering tradespeople 81,933 3,533<br />
Floor finishers and painting tradespeople 55,640 4,126<br />
Glaziers, plasterers and tilers 72,891 2,707<br />
Horticultural tradespeople 79,072 3,764<br />
ICT and telecommunications technicians 49,527 3,076<br />
Mechanical Engineering tradespeople 135,105 4,366<br />
Miscellaneous technicians and tradespeople 61,375 1,686<br />
Plumbers 72,274 2,427<br />
Wood tradespeople 33,186 858<br />
Total technicians and tradespeople 1,583,681 60,857<br />
Sources: ABS 2010a; ABS 2010c<br />
Table 33: Number employed and unemployed for selected occupations<br />
Occupation Employed Unemployed<br />
All professional occupations 2,300,704 48,172<br />
Engineering professionals 119,645 3,794<br />
Natural and physical science professionals 90,544 2,232<br />
All technicians and tradespeople occupations 1,583,681 60,857<br />
Automotive electricians and mechanics 94,203 2,425<br />
Building and engineering technicians 115,725 4,189<br />
Electricians 126,972 3,270<br />
Electronics and telecommunications tradespeople 90,616 3,873<br />
Fabrication engineering tradespeople 81,933 3,533<br />
Mechanical engineering tradespeople 135,105 4,366<br />
Miscellaneous technicians and tradespeople 61,375 1,686<br />
Plumbers 72,274 2,427<br />
Sources: ABS 2010a; ABS 2010c<br />
66 | <strong>National</strong> <strong>Resources</strong> <strong>Sector</strong> <strong>Employment</strong> <strong>Taskforce</strong>: <strong>Technical</strong> <strong>Paper</strong>
Appendix IV—Higher education<br />
Linear projection model for higher education data<br />
Engineering and related technologies<br />
Commencements<br />
In this method a linear trend has been applied to existing commencements for 2002–2008,<br />
and this trend has been projected to provide commencement numbers for 2009 and 2010.<br />
The latest available data from the Department of Education, <strong>Employment</strong> and Workplace<br />
Relations (DEEWR) Higher Education Student Data Collection is for 2008.<br />
Completions<br />
Completions have been projected for the years 2009–2014, as it is expected a student will be<br />
ready to enter the workforce the year after they complete their course ie from 2010–2015.<br />
The crude completion ratio is determined by calculating the average of the completion ratios<br />
from 2005–2008.<br />
Crude<br />
completion<br />
ratio<br />
=<br />
2005<br />
Completions<br />
2001<br />
Commencements<br />
+<br />
2006<br />
Completions<br />
2002<br />
Commencements<br />
+<br />
2007<br />
Completions<br />
2003<br />
Commencements<br />
+<br />
2008<br />
Completions<br />
2004<br />
Commencements<br />
This ratio was then applied to the commencement number five years earlier to determine<br />
the projected completions. For example completions for 2009 have been projected using<br />
commencements for 2005, allowing five years for completion of an engineering degree. While<br />
the model assumes a five year period for the average time taken to complete an engineering<br />
degree, some universities advise the average completion period is six years.<br />
Note: Completions for 2009-2012 have been projected using actual commencement figures; however completions<br />
for 2013-2014 have been determined using projected commencements.<br />
Earth Sciences (Geoscience)<br />
The approach used for projecting engineering and related technologies has also been used for<br />
geoscience, noting that a geoscience degree generally takes less time to complete (four years).<br />
<strong>National</strong> <strong>Resources</strong> <strong>Sector</strong> <strong>Employment</strong> <strong>Taskforce</strong>: <strong>Technical</strong> <strong>Paper</strong> | 67
Commencements<br />
In this method, a linear trend has been applied to existing commencements for 2002–2008,<br />
and this trend has been projected to provide commencement numbers for 2009–2011.<br />
The latest available data from the DEEWR Higher Education Student Data Collection is<br />
for 2008.<br />
Completions<br />
The crude completion ratio is determined by calculating the average of the completion ratios<br />
from 2005-2008.<br />
Crude<br />
completion<br />
ratio<br />
=<br />
2005<br />
Completions<br />
2002<br />
Commencements<br />
+<br />
2006<br />
Completions<br />
2003<br />
Commencements<br />
+<br />
2007<br />
Completions<br />
2004<br />
Commencements<br />
+<br />
2008<br />
Completions<br />
2005<br />
Commencements<br />
This ratio was then applied to the commencement number four years earlier to determine<br />
the projected completions. For example completions for 2009 have been projected using<br />
commencements for 2006, allowing four years for completion of an earth sciences degree.<br />
68 | <strong>National</strong> <strong>Resources</strong> <strong>Sector</strong> <strong>Employment</strong> <strong>Taskforce</strong>: <strong>Technical</strong> <strong>Paper</strong>
Completions and projections in selected domestic engineering and geoscience undergraduate courses<br />
Table 34: Number of completions and projected completions in higher education undergraduate courses<br />
for engineering and geoscience fields of education<br />
2002 2003 2004 2005 2006 2007 2008<br />
Engineering 6,199 6,199 6,548 5,994 6,371 6,152 6,312<br />
Mining engineering 134 146 136 85 115 115 139<br />
Chemical engineering 337 261 331 233 362 334 347<br />
Civil engineering 825 827 753 676 676 762 935<br />
Maritime engineering and technology 365 245 502 249 309 238 76<br />
Geoscience 361 265 307 220 153 146 138<br />
2009 2010 2011 2012 2013 2014<br />
Engineering 6,018 6,260 6,848 6,982 6,891 7,020<br />
Mining engineering 139 182 212 196 233 253<br />
Chemical engineering 359 390 453 395 429 443<br />
Civil engineering 874 907 988 1,004 1,061 1,107<br />
Maritime engineering and technology 269 287 295 110 144 104<br />
Geoscience 132 144 153 128 120 112<br />
Source: <strong>Taskforce</strong> analysis of Higher Education Student Data, DEEWR, 2010<br />
Engineering includes Australian Standard Classification of Education codes: 030000 –039999.<br />
Geoscience includes Australian Standard Classification of Education codes for earth sciences: 010700 –010799<br />
Note: 2002 to 2008 are actual numbers and 2009 to 2014 are projections.<br />
<strong>National</strong> <strong>Resources</strong> <strong>Sector</strong> <strong>Employment</strong> <strong>Taskforce</strong>: <strong>Technical</strong> <strong>Paper</strong> | 69
People on their way into the sector<br />
Table 35: Bachelor degree graduates available for full-time work and in full-time study as a<br />
proportion of all bachelor degree graduates, and of those available for full-time<br />
work, the proportion of those in and seeking full-time employment, 2008<br />
Percentage of bachelor<br />
degree graduates<br />
Available<br />
for full-time<br />
employment<br />
In full-time<br />
study<br />
Of those available for<br />
full-time work<br />
In full-time<br />
employment<br />
Seeking<br />
full-time<br />
employment<br />
Broad field of education<br />
(%)<br />
(%)<br />
(%)<br />
(%)<br />
Aeronautical engineering 75.7 10.1 89.5 10.5<br />
Chemical engineering 83.8 9.2 90.6 9.4<br />
Civil engineering 89.8 3.7 97.3 2.7<br />
Electrical engineering 84.0 9.1 91.9 8.1<br />
Electronic/computer engineering 84.3 8.4 89.1 10.8<br />
Mechanical engineering 84.1 7.7 93.9 6.1<br />
Mining engineering 92.1 1.3 100.0 0.0<br />
Other engineering 80.9 10.5 92.4 7.6<br />
Geology 57.3 32.6 4.3 9.6<br />
Chemistry 37.7 54.9 7.5 20.4<br />
Physical sciences 39.4 50.0 12.4 22.9<br />
Total 66.2 19.6 85.2 14.8<br />
Source: Graduate Careers Australia 2009<br />
70 | <strong>National</strong> <strong>Resources</strong> <strong>Sector</strong> <strong>Employment</strong> <strong>Taskforce</strong>: <strong>Technical</strong> <strong>Paper</strong>
Share of employment by field of study<br />
Table 36: The number of people with an engineering and related technology degree or earth<br />
science degree by industry of employment, 2006.<br />
Industry<br />
Number employed<br />
by Industry<br />
Engineering<br />
and related<br />
technologies<br />
Earth<br />
sciences<br />
Proportion of employment<br />
by Industry<br />
Engineering<br />
and related<br />
technologies<br />
(%)<br />
Earth<br />
sciences (%)<br />
Agriculture, forestry and fishing 20,977 211 2 2<br />
Mining 37,212 3,708 4 27<br />
Manufacturing 240,441 614 24 4<br />
Electricity, gas, water and waste services 31,025 182 3 1<br />
Construction 121,611 260 12 2<br />
Wholesale trade 50,976 368 5 3<br />
Retail trade 59,503 648 6 5<br />
Accommodation and food services 16,341 156 2 1<br />
Transport, postal and warehousing 70,404 253 7 2<br />
Information media and telecommunications 23,863 150 2 1<br />
Financial and insurance services 10,295 350 1 3<br />
Rental, hiring and real estate services 11,079 86 1 1<br />
Professional, scientific and technical services 73,959 3,158 7 23<br />
Administrative and support services 20,875 196 2 1<br />
Public administration and safety 63,766 1,548 6 11<br />
Education and training 19,277 1,277 2 9<br />
Health care and social assistance 16,723 240 2 2<br />
Arts and recreation services 6,141 109 1 1<br />
Other services 87,742 163 9 1<br />
Inadequately described and not stated 24,346 240 2 2<br />
Total 1,006,556 13,917 100 100<br />
Source: ABS 2007<br />
<strong>National</strong> <strong>Resources</strong> <strong>Sector</strong> <strong>Employment</strong> <strong>Taskforce</strong>: <strong>Technical</strong> <strong>Paper</strong> | 71
Appendix V—DEEWR analysis of skill shortages<br />
DEEWR analysis suggests in 2009, demand for skilled labour fell significantly and skill<br />
shortages abated in many occupations. Reductions in the extent of skill shortages were<br />
notable in a number of occupations of importance to the resources and construction sectors,<br />
although shortages persisted in some specific occupations and in some locations. Overall, the<br />
number of occupations assessed by DEEWR as being in shortage between 2008 and 2009 fell<br />
by about 30 per cent.<br />
DEEWR notes that, since late 2009, the demand for skilled labour has recovered significantly<br />
in line with the general economic recovery. Nonetheless, skill shortages remain less prevalent<br />
than they were before the global recession, when shortages were apparent across most trades<br />
and professions.<br />
The DEEWR Skilled Vacancy Index (SVI) has risen by 19 per cent from its low point in June 2009.<br />
Despite this recovery, the level of vacancies remains historically low.<br />
DEEWR skill shortage research for 2010 (to date) shows the proportion of surveyed vacancies<br />
filled and the number of suitable applicants per vacancy have both fallen compared with the<br />
second half of 2009, indicating a tightening labour market. Further pressure on the supply of<br />
skilled labour is expected with ongoing recovery, particularly in the resource and construction<br />
sectors.<br />
Although shortages are becoming more widespread overall, increase in demand has not been<br />
uniform across the labour market. Shortages are particularly noticeable in the health and<br />
engineering professions and in construction and automotive trades. In other sectors, shortages<br />
remain restricted to relatively few occupations, specialisations or locations.<br />
The DEEWR skill shortage research program focuses on high-skill occupations, that is, those<br />
that generally require at least three years of post-school education and training. Many of the<br />
key occupations in the resources sector, such as drillers, truck drivers and plant operators, are<br />
low skill, but there are others that take some time to acquire, either through formal training<br />
or on-the-job training and experience or both.<br />
Managers<br />
The latest DEEWR research indicates there are shortages for mining production managers.<br />
Employers report demand for these senior roles has increased since late 2009, and that they<br />
have been unable to attract adequate numbers of applicants who have the required mining<br />
engineering and management experience.<br />
Engineering and science professions<br />
The labour market for engineering and science professionals (includes geologists and<br />
metallurgists) eased appreciably in early 2009 but a number of engineering occupations<br />
remained in shortage, including mining engineers.<br />
72 | <strong>National</strong> <strong>Resources</strong> <strong>Sector</strong> <strong>Employment</strong> <strong>Taskforce</strong>: <strong>Technical</strong> <strong>Paper</strong>
Ongoing monitoring of the labour market suggests demand began to recover from mid-to-late<br />
2009 and greater signs of tightening in the labour market have become evident since then.<br />
The increase in demand is not, however, uniform across locations or industry sectors.<br />
DEEWR considers shortages of engineers have returned to levels similar to those seen before<br />
the onset of the global recession. There was a moderate easing in the labour market in<br />
the first half of 2009; however, increased demand has been evident since late 2009 due, in<br />
particular, to heightened activity in the resources sector. Shortages were recorded for around<br />
80 per cent of engineering professions surveyed in January–March 2010. The vacancy fill rate<br />
was around 45 per cent and there were just 1.4 suitable applicants per vacancy.<br />
Figure 14: Number of suitable applicants per vacancy, engineers, 2007–10<br />
1.6<br />
1.4<br />
Number of applicants<br />
1.2<br />
1.0<br />
0.8<br />
0.6<br />
0.4<br />
0.2<br />
0.0<br />
Jan-Jun 07<br />
Jul-Dec 07<br />
Jan-Jun 08<br />
Jul-Dec 08<br />
Feb-Apr 09<br />
Sep-Oct 09<br />
Dec-09<br />
Jan-Mar 2010<br />
Year<br />
Source: DEEWR skill shortage research<br />
<strong>National</strong> shortages for geologists abated during 2009, although employers in some regions<br />
continued to report difficulty in recruiting. Research undertaken in 2010 shows shortages of<br />
geologists have re-emerged. Less than half the surveyed vacancies were filled and employers<br />
attracted, on average, only around one suitable applicant per vacancy. Recruitment difficulties<br />
varied significantly, however, according to location and industry sector. Research undertaken<br />
in early 2010 (based on a limited number of contacts) suggests that employers are also<br />
experiencing difficulty recruiting geophysicists.<br />
For metallurgists, the 2010 research indicates employers experienced little difficulty recruiting,<br />
with most vacancies attracting multiple suitable applicants. There was no evidence of<br />
widespread shortages of these professionals.<br />
Construction, metal/engineering and electrical/electronics trades<br />
A substantial and widespread decrease in shortages among the trades was evident in the first<br />
quarter of 2009. An easing labour market was especially evident for the construction and<br />
metal engineering trades and shortages in these trades abated.<br />
A pickup in demand became evident from mid-2009, but the recovery was relatively slight in<br />
the second half of 2009, gaining more momentum in early 2010, with shortages again being<br />
recorded in some trades. Nonetheless, trades employers continue to experience less difficulty<br />
<strong>National</strong> <strong>Resources</strong> <strong>Sector</strong> <strong>Employment</strong> <strong>Taskforce</strong>: <strong>Technical</strong> <strong>Paper</strong> | 73
ecruiting than they did before the global recession. The graph below shows the proportion of<br />
vacancies filled by key trades group from 2007–2010.<br />
Although vacancy fill rates are relatively low for some specific trades and shortages are<br />
apparent, the variation in recruitment experience across sectors and trades means the rate at<br />
which vacancies are filled for most trades groups remains relatively high.<br />
Figure 15: Vacancies filled, trades groups, 2007–10 (per cent)<br />
90<br />
80<br />
70<br />
60<br />
(per cent)<br />
50<br />
40<br />
30<br />
20<br />
10<br />
0<br />
Jan-Jun 07<br />
Jul-Dec 07<br />
Jan-Jun 08<br />
Aug-Dec 08<br />
Feb-Mar 09<br />
Jul-Oct 09<br />
Nov-09<br />
Feb-Mar 10<br />
Year<br />
Engineering Trades Construction Trades Electrotechnology & Telecommunication Trades<br />
Source: DEEWR skill shortage research<br />
*no data available for E&TT in November 2009<br />
DEEWR analysis suggests a tightening labour market has been evident for construction trades<br />
since late 2009. More than three quarters of vacancies surveyed in the period from July to<br />
September 2009 were filled and shortages were restricted to a small number of trades, the<br />
highest level of availability of construction tradespeople recorded in recent years. By February/<br />
March 2010, however, the vacancy fill rate had fallen to around 65 per cent, there were just<br />
1.6 suitable applicants per vacancy, and around half the surveyed construction trades were<br />
assessed as being in shortage. By comparison, in early 2008 the vacancy fill rate was around<br />
50 per cent, there were 1.1 suitable applicants per vacancy, and almost all surveyed<br />
construction trades were in shortage.<br />
74 | <strong>National</strong> <strong>Resources</strong> <strong>Sector</strong> <strong>Employment</strong> <strong>Taskforce</strong>: <strong>Technical</strong> <strong>Paper</strong>
Figure 16: Number of suitable applicants per vacancy, construction trades, 2007–10<br />
4.5<br />
4.0<br />
Number of applicants<br />
3.5<br />
3.0<br />
2.5<br />
2.0<br />
1.5<br />
1.0<br />
0.5<br />
0.0<br />
Jan-Jun 07<br />
Jul-Dec 07<br />
Jan-Jun 08<br />
Aug-Dec 08<br />
Feb-Mar 09<br />
Jul-Oct 09<br />
Nov-09<br />
Feb-Mar 10<br />
Year<br />
Source: DEEWR skill shortage research<br />
In the metal/engineering trades, skill shortages remain restricted to relatively few occupations.<br />
In February–March 2010 three out of eight surveyed occupations were in shortage. The<br />
vacancy fill rate was around 70 per cent and there was an average of two suitable applicants<br />
per vacancy. By comparison, in late 2008 the vacancy fill rate was slightly less than 50 per cent,<br />
there were 0.8 suitable applicants per vacancy, and nearly 90 per cent of surveyed occupations<br />
were in shortage. Although the research did not identify a national shortage of welders,<br />
shortages were apparent in South Australia, Western Australia and the Northern Territory.<br />
Figure 17: Number of suitable applicants per vacancy, metal/engineering trades, 2007–10<br />
5.0<br />
4.5<br />
4.0<br />
Number of applicants<br />
3.5<br />
3.0<br />
2.5<br />
2.0<br />
1.5<br />
1.0<br />
0.5<br />
0.0<br />
Jan-Jun 07<br />
Jul-Dec 07<br />
Jan-Jun 08<br />
Aug-Dec 08<br />
Year<br />
Feb-Mar 09<br />
Jul-Oct 09<br />
Nov-09<br />
Feb-Mar 10<br />
Source: DEEWR skill shortage research<br />
<strong>National</strong> <strong>Resources</strong> <strong>Sector</strong> <strong>Employment</strong> <strong>Taskforce</strong>: <strong>Technical</strong> <strong>Paper</strong> | 75
Shortages were evident for around half of the electrical and communications trades surveyed<br />
in February–March 2010, but widespread shortages were not evident in the key trade of<br />
general electrician. The vacancy fill rate for this group was around 60 per cent and there were<br />
two suitable applicants per vacancy. Vacancy fill rates and numbers of suitable applicants per<br />
vacancy remain at higher levels than those commonly recorded before the onset of the global<br />
recession. For example, in late 2008 the vacancy fill rate was around 40 per cent and there was<br />
less than one suitable applicant per vacancy.<br />
Figure 18: Number of suitable applicants per vacancy, electrical and communications<br />
trades, 2007–10<br />
2.5<br />
2.0<br />
Number of applicants<br />
1.5<br />
1.0<br />
0.5<br />
0.0<br />
Jan-Jun 07<br />
Jul-Dec 07<br />
Jan-Jun 08<br />
Aug-Dec 08<br />
Feb-Mar 09<br />
Jul-Oct 09<br />
Feb-Mar 10<br />
Source: DEEWR skill shortage research<br />
Year<br />
Research undertaken in early 2010 suggests skill shortages in the automotive trades have also<br />
re-emerged. Twice as many of these trades, including general motor mechanic and automotive<br />
electrician, are now in shortage compared with August 2009.<br />
76 | <strong>National</strong> <strong>Resources</strong> <strong>Sector</strong> <strong>Employment</strong> <strong>Taskforce</strong>: <strong>Technical</strong> <strong>Paper</strong>
Table 37: Skill shortages in resources occupations, 2008 to 2010<br />
Managers<br />
2008 2009 2010<br />
Production manager (mining) Shortage No shortage Shortage<br />
Professions<br />
Civil engineer Shortage Shortage Shortage<br />
Electrical engineer Shortage Shortage Shortage<br />
Mechanical engineer Shortage No shortage Shortage<br />
Mining engineer Shortage Shortage Shortage<br />
Petroleum engineer n/a Shortage Shortage<br />
Geologist Shortage No shortage Shortage<br />
Trades<br />
Metal fabricator Shortage No shortage No shortage<br />
Welder Shortage No shortage No shortage<br />
Fitter (general) Shortage No shortage No shortage<br />
Metal machinist Shortage No shortage No shortage<br />
Carpenter Shortage No shortage Shortage<br />
Plumber (general) Shortage No shortage Shortage<br />
Electrician Shortage No shortage No shortage<br />
Motor mechanic (includes diesel mechanic) Shortage No shortage Shortage<br />
Automotive electrician Shortage Shortage Shortage<br />
Other<br />
Driller Shortage n/a n/a<br />
Chemical, gas, petroleum and power plant operator No shortage No shortage n/a<br />
Source: DEEWR skill shortage research<br />
Note: n/a = not assessed<br />
<strong>National</strong> <strong>Resources</strong> <strong>Sector</strong> <strong>Employment</strong> <strong>Taskforce</strong>: <strong>Technical</strong> <strong>Paper</strong> | 77
Skill shortage methodology<br />
Purpose<br />
DEEWR undertakes skill shortage research on an ongoing basis. This research also forms<br />
the basis of the <strong>National</strong> Skill Needs List, which is used to determine eligibility of Australian<br />
Apprentices and their employers for a range of incentives, and feeds into the Priority<br />
Occupations for the Productivity Places Program.<br />
The research also addresses a need for information about skill needs in each state and territory<br />
to underpin policy, planning and resource allocation. State and territory skill shortage lists<br />
incorporating the results of the research are publicly available at www.workplace.gov.au/<br />
skillshortages.<br />
The DEEWR methodology provides indicative qualitative information on skill shortages.<br />
It delivers relevant useful information about employers’ experiences recruiting skilled<br />
workers and enables DEEWR to explore labour market issues impacting on the supply of and<br />
demand for particular skills through discussions with individual employers. While the DEEWR<br />
methodology is cost effective and targeted, it is not based on a statistically valid sample and<br />
does not enable the compilation of quantitative estimates. However, the Australian Bureau of<br />
Statistics reviewed the methodology in 2006 and found it was appropriate for its purpose.<br />
The DEEWR Skill Shortage research is undertaken on an occupational basis. Until the end of<br />
the 2007–08 program, the Australian Standard Classification of Occupations was used to define<br />
occupations. The skill shortage research is now undertaken on the basis of the Australian and<br />
New Zealand Standard Classification of Occupations (ANZSCO) in line with the introduction<br />
of this classification exclusively in ABS statistics from February 2008 and to better reflect the<br />
occupational structure of the current Australian labour market.<br />
1. Survey of employers who have recently advertised<br />
The survey of employers who have recently advertised (SERA) is a survey of employers who<br />
have recently advertised vacancies in selected skilled occupations.<br />
SERA is an important element of the research into skill shortages conducted by DEEWR<br />
through its state and territory Labour Economics Offices (LEOs) and <strong>National</strong> Office. The aims<br />
of the SERA are to:<br />
• better target telephone contact work by focusing on employers who have recently<br />
advertised and, therefore, are in a good position to comment on current recruitment<br />
issues for target occupations<br />
• provide information on employer recruitment experience<br />
• provide a consistent methodology for information across states and territories and<br />
occupations, which could be analysed over time to determine broad trends in skilled<br />
labour markets.<br />
78 | <strong>National</strong> <strong>Resources</strong> <strong>Sector</strong> <strong>Employment</strong> <strong>Taskforce</strong>: <strong>Technical</strong> <strong>Paper</strong>
2. Main Elements of the SERA<br />
DEEWR staff contact employers who have recently attempted to recruit in the occupations<br />
included in the skill shortage research program. To identify employers who have recruited,<br />
vacancy details are collected from available sources, including major metropolitan and regional<br />
newspapers, general employment and specialist industry and occupational internet sites, as<br />
well as professional associations and notices outside business premises.<br />
Where there are sufficient vacancy numbers, vacancies for follow-up are randomly selected.<br />
For some occupations, adequate numbers of vacancies are not identified. In these cases, all<br />
vacancies found with appropriate contact information in the survey period are followed<br />
up and other employers are cold canvassed to ensure assessments are based on a sufficient<br />
number and range of contacts.<br />
Contact with employers is discussion based, rather than a formatted survey, but the minimum<br />
information sought from employers is the number of positions available, whether vacancies<br />
were filled, the total number of applicants and the number of suitable applicants. However,<br />
supplementary information is collected where practical through the recommended questions<br />
and engagement with employers about labour market issues. The research aims to collect<br />
information about why vacancies are unfilled, as this is important for making a decision about<br />
the rating for each occupation.<br />
3. Methodology<br />
3.1 Sample size and selection of sample<br />
The number of employers contacted varies based on the number of people employed in the<br />
occupation and the number of vacancies advertised. In a small number of cases, the limited<br />
number of employers makes it impractical to contact the target number of employers who<br />
have recently advertised. In these cases, judgment is used regarding the number of employers<br />
surveyed to produce a reliable result. A minimum number of contacts is made for each<br />
occupation. This primarily comprises employers who have advertised vacancies over the past<br />
six months. However, where vacancy numbers are low and sufficient vacancies cannot be<br />
identified ‘cold canvassing’ of major employers and peak bodies is undertaken.<br />
When employers are cold canvassed, they are asked whether they have advertised vacancies<br />
in the target occupation in the last six months (vacancies older than six months are not<br />
considered as they may not be a reliable guide to current labour market conditions and they<br />
will reflect a previously assessed labour market). Employers are then asked whether they filled<br />
the vacancy and, if so, approximately how long it took them to do so.<br />
If cold-canvassed employers have not advertised recently, discussions focus on the employer’s<br />
perceptions about the labour market for the occupation and issues impacting on the labour<br />
market.<br />
Regional vacancies<br />
DEEWR attempts to survey an appropriate number of employers from regional areas for each<br />
occupation taking into account the significance of regional employment in the particular<br />
occupation. Regional areas are those outside the major capital cities in each state and territory.<br />
<strong>National</strong> <strong>Resources</strong> <strong>Sector</strong> <strong>Employment</strong> <strong>Taskforce</strong>: <strong>Technical</strong> <strong>Paper</strong> | 79
Smaller states and occupations<br />
In the smaller states particularly (South Australia, Tasmania, the Northern Territory and<br />
Australian Capital Territory), and for occupations that have small employer and vacancy<br />
numbers, the minimum number of employer contacts is not always achievable. In these<br />
cases, DEEWR aims to collect as many vacancies for follow-up as possible, with cold<br />
canvassing of employers when vacancy numbers are low.<br />
3.2 Collection and presentation of results<br />
Demand analysis<br />
Researchers take account of a range of data (such as that outlined below) in conjunction<br />
with the results of the SERA, which underpins their assessments of occupational labour<br />
markets. However, comment on these data sets is included in the Skill Shortage Research<br />
Program reports only where it presents relevant information about the labour market for that<br />
occupation or where it adds evidence for its rating. Comment about how changes in industry<br />
activity levels impact on demand for the occupation is included (for example, falling housing<br />
starts may impact more quickly on commencing trades such as bricklaying and demand for<br />
tilers and painters may hold up longer as work in progress is completed). Additionally, the<br />
labour market for trades with stronger demand from maintenance work, such as plumbers,<br />
may be less affected by a decline in housing commencements.<br />
Demand data could include:<br />
• examination of key determinants of demand (that is, the variables affecting the level of<br />
demand for these skills)<br />
• relevant industry activity statistics and projections<br />
• employment levels (where reliable and current)<br />
• vacancy levels (only where reliable data is available)<br />
• anecdotal information on demand from employers and industry contacts<br />
• a conclusion on whether demand is increasing or decreasing<br />
• the likely outlook for demand over the following six months.<br />
Supply analysis<br />
Analysis of supply to the occupation is important, although available data does not always<br />
allow a precise estimate of numbers entering an occupation. Supply trends are included in<br />
occupational reports with comment about anticipated changes to supply (for example the<br />
closure of a training course or establishment of new courses). Where there are no well-defined<br />
supply paths (for example, for some management and associate professional occupations)<br />
reports may include information about the diversity of supply sources.<br />
Consideration is given to the following supply issues:<br />
• training completions and commencements where available<br />
• wastage (people leaving the occupation)<br />
• net migration figures (if relevant and available)<br />
• comment on informal supply (if significant)<br />
• conclusion on whether overall supply to the occupation is increasing or decreasing.<br />
80 | <strong>National</strong> <strong>Resources</strong> <strong>Sector</strong> <strong>Employment</strong> <strong>Taskforce</strong>: <strong>Technical</strong> <strong>Paper</strong>
SERA results<br />
SERA results are not intended as a measure of the degree of shortage and are not statistically<br />
accurate. Reflecting this, figures are quoted in the relevant skill-shortage report in broad<br />
terms, but may be compared with previous results when available. The SERA is only one piece<br />
of evidence for the state of the labour market for a particular occupation. While it may vary<br />
from occupation to occupation, other relevant information (including that outlined under<br />
‘demand analysis’ and ‘supply analysis’) and SERA results are interpreted in light of other<br />
available information, such as employment growth, vacancy trends (where reliable) and<br />
the comments of employers, industry contacts, educational institutions and labour market<br />
intermediaries.<br />
A low vacancy fill rate may not necessarily indicate a skill shortage in the occupation. DEEWR<br />
examines the reasons for vacancies remaining unfilled and there are often a number of causes<br />
unrelated to the overall shortage. These include employers having specialist requirements,<br />
the position involving the operation of machinery or equipment that are not generally used<br />
and with which most qualified and skilled workers may not have experience, pay or conditions<br />
offered being below market rates, and particular working arrangements and expectations of<br />
employers or employees that are unrealistic. Additionally, the working arrangements sought<br />
by workers may not match those offered by employers, for instance workers seeking full-time<br />
work but employers offering part-time hours, employers seeking salary and wage employment<br />
but workers wanting contract work.<br />
3.3 Ratings<br />
Taking account of all available information, including the results of the SERA and the reasons<br />
for employers being unable to fill vacancies, researchers decide on an appropriate rating.<br />
Ratings are for the whole of the state or territory covered by the report (or for Australia, if it is<br />
a national report) unless there is a qualifier suggesting the rating varies between metropolitan<br />
and regional locations. Where researchers have identified differences in the labour market<br />
between metropolitan and regional locations this is noted in the ratings box.<br />
The following definitions are used:<br />
Shortage<br />
Skill shortages exist when employers are unable to fill or have considerable difficulty<br />
filling vacancies for an occupation, or significant specialised skill needs within that<br />
occupation, at current levels of remuneration and conditions of employment, and in<br />
reasonably accessible locations.<br />
Recruitment difficulty<br />
Recruitment difficulties occur when some employers have difficulty filling vacancies for<br />
an occupation. There may be an adequate supply of skilled workers, but some employers<br />
are unable to attract and recruit sufficient, suitable workers for reasons such as the<br />
specific experience or specialist skill requirements of the vacancy, differences in hours of<br />
work required by the employer and those sought by applicants, and particular location<br />
or transport issues.<br />
No shortage<br />
Research has not identified any significant difficulty filling vacancies.<br />
<strong>National</strong> <strong>Resources</strong> <strong>Sector</strong> <strong>Employment</strong> <strong>Taskforce</strong>: <strong>Technical</strong> <strong>Paper</strong> | 81
3.4 Standard employer questions<br />
Although the minimum information required for the SERA is whether a vacancy was filled<br />
within the four to six week period, other information is important in determining whether<br />
skills shortages exist and the reasons for these shortages. Recommended questions for<br />
employer contact work are provided to researchers. It must be emphasised, however, that<br />
researchers use their discretion regarding the questions that are appropriate in relation to the<br />
occupation and the attitude of the contact.<br />
3.5 Timing of contact work<br />
To reduce the influence of seasonal factors, as far as possible, DEEWR conducts SERA contact<br />
work for a group of occupations (for example, construction) at approximately the same time<br />
of the year in each state and territory.<br />
Identifying whether a vacancy is filled or not is measured four weeks after advertising for<br />
trades occupations and six weeks after advertising for professional vacancies. Therefore,<br />
contact with employers is generally attempted four weeks (or, in the case of professional<br />
vacancies, six weeks) after the surveyed advertisement appeared. However, where this is not<br />
possible, the questions seek information about whether the position was filled within four (or<br />
six) weeks. If a vacancy is filled but the employer states they had advertised for several weeks<br />
before the vacancy which was surveyed, the concern is whether the surveyed vacancy was filled<br />
within the four weeks. The focus is on the employer’s most recent recruitment experience.<br />
3.6 Specialisations<br />
To achieve a reasonable sample size the SERA is conducted on occupations at the six-digit<br />
ANZSCO level (although some six-digit occupations have been combined). Assessments of<br />
shortages in specialisations are usually based on qualitative information drawn from a smaller<br />
number of employer and industry contacts.<br />
3.7 What is a vacancy?<br />
The definition of a vacancy is generally as follows: ‘A vacancy is for a definite position offered<br />
by the direct employer for a paid employee.’ Part-time positions are surveyed if the hours of<br />
work are 16 or more per week and temporary/casual positions are surveyed if they are for<br />
three months or longer. Advertisements for self-employment or partnerships are generally<br />
excluded. However, in industries where there is significant subcontracting (e.g. construction)<br />
and the advertisement offers specific paid employment that meets the criteria, the position is<br />
surveyed. Vacancies advertised by recruitment agencies are included in the SERA if they are for<br />
an actual vacancy with a particular employer rather than a general ‘canvassing’ advertisement.<br />
However, recruitment agencies are often contacted for qualitative information.<br />
Multiple vacancies<br />
Employers sometimes advertise multiple vacancies without having a definite number in mind.<br />
In such cases, researchers attempt to seek from employers their best estimate of the number<br />
of vacancies involved. Employers may be asked how many people they would immediately<br />
employ and could afford to employ if a large number of very good candidates applied.<br />
3.8 When is a vacancy filled?<br />
A vacancy is considered to be filled if the employer recruited a suitable applicant within<br />
four weeks of advertising the surveyed vacancy (six weeks in the case of professions), the<br />
successful applicant stayed more than two weeks in the position and left voluntarily, and<br />
there were no performance issues.<br />
82 | <strong>National</strong> <strong>Resources</strong> <strong>Sector</strong> <strong>Employment</strong> <strong>Taskforce</strong>: <strong>Technical</strong> <strong>Paper</strong>
Incomplete recruitment exercises<br />
In some cases, an employer will not have completed a recruitment exercise within four to six<br />
weeks for administrative reasons, for example, they have not finalised formal interviews or<br />
have called several promising applicants for a second round of interviews. In this case, the<br />
researcher makes arrangements to recontact the employer when the result of the interview<br />
process is known. If this is not practicable, the researcher records the vacancy as filled if<br />
the employer is highly confident of filling the vacancy from that recruitment round. If the<br />
employer is unsure of the likely result, the vacancy is excluded from the SERA.<br />
3.9 Time period<br />
The period after which a vacancy is assessed (six weeks for professionals, four weeks for other<br />
occupations) is to some extent arbitrary, although it is reasonable to expect that employers<br />
would have, in most cases, completed the recruitment process in that time. Setting a defined<br />
time for vacancy filling gives the advantage of simple and consistent benchmark of measuring<br />
whether a vacancy is filled so that the SERA collection is consistent across DEEWR state offices<br />
and <strong>National</strong> Office, and over time.<br />
Advertisements often state a cut-off date for applications. In this case the vacancy is surveyed<br />
four to six weeks after the cut-off date if practical.<br />
3.10 Consultation<br />
Consultation with key industry, employee and professional associations is undertaken to<br />
confirm the findings of the research and discuss the labour market and factors impacting on<br />
skill needs before reports and skill shortage lists are finalised.<br />
<strong>National</strong> <strong>Resources</strong> <strong>Sector</strong> <strong>Employment</strong> <strong>Taskforce</strong>: <strong>Technical</strong> <strong>Paper</strong> | 83
Appendix VI—NRSET Industry Survey<br />
Background<br />
In order to gauge the likely labour and skill needs of major resources sector projects 3 coming<br />
on stream over the next five years, the <strong>National</strong> <strong>Resources</strong> <strong>Sector</strong> <strong>Employment</strong> <strong>Taskforce</strong><br />
Secretariat conducted an industry survey of resource, construction and labour hire companies<br />
operating in the resources sector.<br />
The survey addressed the demand for labour and skills during the construction of major<br />
projects, as well as their ongoing operational needs. The survey also sought to gain a better<br />
understanding of employee turnover within the sector, how employers were recruiting or<br />
intending to recruit people with the needed skills and the extent to which employers were<br />
having difficulty recruiting.<br />
The Minerals Council of Australia, Australian Petroleum Production and Exploration<br />
Association, Australian Mines and Metals Association, Chamber of Minerals and Energy of<br />
Western Australia and the Queensland <strong>Resources</strong> Council were consulted in the preparation of<br />
the survey.<br />
Conducting the survey<br />
Four hundred and five companies (including 186 resources companies, 94 construction<br />
companies and 125 labour hire companies) were asked to participate in the survey.<br />
The survey was sent out by email and in hard copy on 18 March 2010, with a deadline for<br />
responses set for 9 April 2010. This was later extended to 30 April 2010 to accommodate<br />
companies having difficulties in assembling the necessary data, and the <strong>Taskforce</strong> Secretariat<br />
continued to receive survey responses after this date.<br />
Reminder emails (on 8 April 2010) and phone calls (on 12–13 April 2010) were made by the<br />
<strong>Taskforce</strong> to encourage survey responses. Industry associations were also urged to encourage<br />
their members to participate in the survey.<br />
Fifty-seven companies completed the survey questionnaire (37 resources companies,<br />
15 construction companies and 5 labour hire companies). Some companies provided the<br />
<strong>Taskforce</strong> with information through their submissions.<br />
_____________________________________________________<br />
3<br />
Valued at over $40 million in capital expenditure (420 million for gold mining projects)<br />
84 | <strong>National</strong> <strong>Resources</strong> <strong>Sector</strong> <strong>Employment</strong> <strong>Taskforce</strong>: <strong>Technical</strong> <strong>Paper</strong>
<strong>National</strong> <strong>Resources</strong> <strong>Sector</strong> <strong>Employment</strong> <strong>Taskforce</strong><br />
Survey of <strong>Resources</strong> <strong>Sector</strong> Demand for Labour and Skills<br />
Introduction<br />
On 1 September 2009, the Australian Government announced the establishment of a <strong>National</strong><br />
<strong>Resources</strong> <strong>Sector</strong> <strong>Employment</strong> <strong>Taskforce</strong> with the responsibility of developing a comprehensive<br />
workforce development plan taking into account the planned major resource, energy and<br />
related infrastructure projects in Australia and their employment and skill requirements.<br />
The first Term of Reference for the <strong>Taskforce</strong> says ‘develop a comprehensive workforce<br />
development plan taking into account the planned major resource, energy and related<br />
infrastructure projects in Australia and their employment and skill requirements’ including<br />
‘examining the projects that are coming on stream over the next 5 years; mapping the<br />
geographic location of jobs, the number and type of jobs, the skills and quantity needed<br />
for nominated durations; when workers will be required and what skills needs can currently<br />
be met’. The Department of Education, <strong>Employment</strong> and Workplace Relations (DEEWR)<br />
is providing the Secretariat to the <strong>Taskforce</strong> and is conducting a survey on behalf of the<br />
<strong>Taskforce</strong> to gauge the likely demand for labour and skills needed for resources sector projects<br />
by examining projects coming on stream over the next five years which exceed $40 million in<br />
total capital expenditure. The survey addresses both the demand for labour and skills during<br />
the construction of major projects, and ongoing operational needs.<br />
The survey also aims to gain a better understanding of employee turnover within the sector,<br />
how employers recruit people with the needed skills and to what extent employers are having<br />
difficulty in recruiting people with the required skills.<br />
Confidentiality of information<br />
This survey is being conducted in accordance with the requirements of the Privacy Act 1988<br />
and is being developed under the strict guidelines and requirements of the Australian Bureau<br />
of Statistics. Personal information collected and stored by the <strong>Taskforce</strong> Secretariat during the<br />
survey will be used solely for the purpose of determining the overall demand for labour and<br />
skills in the resources sector, and no organisational level data will be published.<br />
Any information that your company provides to the <strong>Taskforce</strong> Secretariat will be treated as<br />
confidential. Company level data will only be able to be accessed by authorised members of<br />
the DEEWR <strong>Taskforce</strong> Secretariat. Company level data will be destroyed at the conclusion of<br />
the survey.<br />
The results of the survey will be used in preparing a comprehensive workforce development<br />
plan that addresses labour and skills shortage issues in the resources sector. The final report<br />
of the <strong>Taskforce</strong> may present aggregated information at the national and state level. It is<br />
expected that aggregated data published in the final report may be of use to State Training<br />
Authorities.<br />
Australian Government Statistical Clearing House Approval Number 02080 – 01<br />
1 of 16<br />
<strong>National</strong> <strong>Resources</strong> <strong>Sector</strong> <strong>Employment</strong> <strong>Taskforce</strong>: <strong>Technical</strong> <strong>Paper</strong> | 85
Due Date<br />
Please respond to the survey by 9 th April, either online, or by using the attached reply paid<br />
envelope or by emailing your response to us. If you wish to access the survey online or<br />
the electronic version of this form, please contact the <strong>Taskforce</strong> Secretariat by phone on<br />
(02)61217827 or by email at NRSET.survey@deewr.gov.au.<br />
Mail:<br />
Email:<br />
<strong>National</strong> <strong>Resources</strong> <strong>Sector</strong> <strong>Employment</strong> <strong>Taskforce</strong> Secretariat<br />
Department of Education, <strong>Employment</strong> and Workplace Relations<br />
GPO Box 9880<br />
CANBERRA ACT 2601<br />
NRSET.survey@deewr.gov.au<br />
Help available<br />
If you have any queries about any aspect of the survey or require assistance to complete the<br />
survey before the due date, please contact us by telephone on (02) 6121 7827 or by email to:<br />
NRSET.survey@deewr.gov.au<br />
How to answer<br />
• Please make your responses as brief as possible<br />
• If you are not sure about an answer, give your best approximation.<br />
• If you need more room to provide your response, please use an Attachment page at the end of<br />
this survey. Please write the question number and your response.<br />
Australian Government Statistical Clearing House Approval Number 02080 – 01<br />
2 of 16<br />
86 | <strong>National</strong> <strong>Resources</strong> <strong>Sector</strong> <strong>Employment</strong> <strong>Taskforce</strong>: <strong>Technical</strong> <strong>Paper</strong>
Q1. What is the name of your company and business unit?<br />
Q2. What are your position and contact details?<br />
Q3. What is your company’s address?<br />
Australian Government Statistical Clearing House Approval Number 02080 – 01<br />
3 of 16<br />
<strong>National</strong> <strong>Resources</strong> <strong>Sector</strong> <strong>Employment</strong> <strong>Taskforce</strong>: <strong>Technical</strong> <strong>Paper</strong> | 87
Q4. What are the main mining and construction industries in which your company<br />
operates? (tick all that apply)<br />
Note: Industry based on Australian and New Zealand Standard Industrial Classification (ANZSIC) 2006 (Revision 1.0)<br />
(Latest) cat no: 1292.0<br />
Mining Coal Mining (ANZSIC Group 110)<br />
Oil and Gas Extraction (ANZSIC Group 120)<br />
Metal Ore Mining (ANZSIC Group 131)<br />
Non-Metallic Mineral Mining<br />
(includes Construction Material Mining (ANZSIC Group 141)and Mining n.e.c.<br />
(ANZSIC Group 142))<br />
Exploration and Other Mining Support Services (includes: Exploration (ANZSIC<br />
Group 151) and Other Mining Services (ANZSIC Group 152))<br />
Construction Heavy and Civil Engineering Construction (ANZSIC Group 310)<br />
Land development and site preparation services (ANZSIC Group 321)<br />
Other Construction Services (ANZSIC Group 329)<br />
Other (Please specify)<br />
Q5. In terms of your projects are you (tick one or more box):<br />
A resource company Yes * No *<br />
A contractor Yes * No *<br />
A labour hire company Yes * No *<br />
Australian Government Statistical Clearing House Approval Number 02080 – 01<br />
4 of 16<br />
88 | <strong>National</strong> <strong>Resources</strong> <strong>Sector</strong> <strong>Employment</strong> <strong>Taskforce</strong>: <strong>Technical</strong> <strong>Paper</strong>
The next question is about how many employees you have now.<br />
Employees include:<br />
• People who receive remuneration in wages or salary; and<br />
• Are engaged under a contract of service (an employment contract); and<br />
• Take directions from their employer/supervisor/manager/foreman on how the work is<br />
performed.<br />
and exclude:<br />
• Persons paid by commission only;<br />
• Non-salaried directors;<br />
• Self employed persons such as a consultants and contractors; and<br />
• Volunteers.<br />
Examples of mining, construction and related occupations<br />
Note: Occupation based on 1220.0 - ANZSCO - Australian and New Zealand Standard Classification of<br />
Occupations, First Edition, Revision 1 Latest ISSUE Released at 11:30 AM (CANBERRA TIME) 25/06/2009<br />
• Managers – Production Managers (Mining), Construction Project Managers, Engineering Managers,<br />
etc.<br />
• Professionals – Accountants, External/Internal Auditors, Cartographers, Surveyors, Electrical<br />
Engineers, Electronics Engineers, Civil Engineers, Industrial Engineers, Mining Engineers (excluding<br />
Petroleum), Petroleum Engineers, Geologists, Quantity Surveyors, etc.<br />
• Technicians and Trades Workers – Construction Estimators, Surveying or Cartographic Technicians,<br />
Civil Engineering Draftspersons/Technicians, Metallurgical or Materials Technicians, Mine Deputies,<br />
Sheet Metal Trades Workers, Metal Fabricators, Welders, Fitters and Turners, Fitter-Welders,<br />
Carpenters and Joiners, Electricians, Electrical Linesworkers, <strong>Technical</strong> Cable Jointers, Electronic<br />
Instrument Trades Workers (General/Special Class), Gas or Petroleum Operators, etc.<br />
• Machinery Operators and Drivers – Crane, Hoist or Lift Operators, Drillers, Miners, Shot Firers,<br />
Mineral Ore Treatment Plant Operators, Sheet Metal Workers (Second Class), Conveyor Belt<br />
Operators, Cement Production Plant Operators, Concrete Batching Plant Operators, Concrete<br />
Pump Operators, Earthmoving Plant Operators (General), Backhoe Operators, Bulldozer Operators,<br />
Excavator Operators, Grader Operators, Railway Track Plant Operators, Truck Drivers, Storepersons,<br />
etc.<br />
• Labourers – Builder’s Labourers, Earthmoving Labourers, Concreters, Construction Riggers,<br />
Scaffolders, Steel Fixers, Structural Steel Erectors, Crane Chasers, Driller’s Assistants, Laggers,<br />
Mining Support Workers (Mineral Ore Processing Labourers), Surveyor’s Assistants, etc.<br />
• Other – (includes occupations from Clerical and Administrative Workers, Sales Workers and<br />
Community and Personal Service Workers) Contract Administrators, Program or Project<br />
Administrators, Office Managers, Logistics Clerks, Purchasing Officers, General Clerks,<br />
Bookkeepers, Accounting Clerks, Cooks, Cleaners and Laundry Workers etc.<br />
Australian Government Statistical Clearing House Approval Number 02080 – 01<br />
5 of 16<br />
<strong>National</strong> <strong>Resources</strong> <strong>Sector</strong> <strong>Employment</strong> <strong>Taskforce</strong>: <strong>Technical</strong> <strong>Paper</strong> | 89
Question 6 is in two parts: part (a) is for the construction phase, part (b) is for projects in the<br />
operational phase. Please use one form per project.<br />
Q6. How many people do you currently employ by project? Note: Only include direct<br />
employees and not workers employed by your contractors undertaking work on the<br />
project. Please copy more tables as required.<br />
* Fly-in Fly-out (FIFO) workforce refers to workers who commute to the workplace and are provided with food and<br />
accommodation during their stay at the work-site. Workers travel from their usual place of residence and remain<br />
there for a period of time, returning home between rosters. Also referred to as long distance commuting. FIFO<br />
includes Ship-in Ship-out, Drive-in Drive-out, or other transport combinations.<br />
PROJECT NAME: Insert Project Name<br />
Is your company undertaking this project development? Yes/No<br />
LOCATION: Insert Location of Project (including State/Territory)<br />
(a) CONSTRUCTION PHASE DUE TO END: Insert Month/Year<br />
OCCUPATION (add occupations as required)<br />
Managers (e.g. superintendents, supervisors and foremen positions)<br />
Professionals (e.g. civil engineer, geotechnical engineer)<br />
Technicians (e.g. building and engineering technicians)<br />
Tradespersons (e.g. electricians, plumbers)<br />
Machinery Operators and Drivers (e.g. crane, hoist and lift operators)<br />
Labourers (building and plumbing labourers, concreters)<br />
Other<br />
Total employees<br />
How many of the total are FIFO* employees?<br />
(b) OPERATIONAL PHASE DUE TO END: Insert Month/Year<br />
OCCUPATION (add occupations as required)<br />
Managers (e.g. superintendents, supervisors and foremen positions)<br />
Professionals (e.g. mechanical engineer)<br />
Technicians (e.g. pipe testing technician)<br />
Tradespersons (e.g. metal fitters and machinists)<br />
Machinery Operators and Drivers (e.g. drillers, miners and shot firers)<br />
Labourers (e.g. crane chaser, driller’s assistant, lagger)<br />
Other<br />
Total employees<br />
How many of the total are FIFO* employees?<br />
Number of employees<br />
Number of employees<br />
Australian Government Statistical Clearing House Approval Number 02080 – 01<br />
6 of 16<br />
90 | <strong>National</strong> <strong>Resources</strong> <strong>Sector</strong> <strong>Employment</strong> <strong>Taskforce</strong>: <strong>Technical</strong> <strong>Paper</strong>
The next two questions (7 and 8) are about future projects over the next five years.<br />
Q7. What are the major resource sector projects expected to exceed $40 million in total<br />
capital expenditure that your company will be recruiting for over the next five years?<br />
Project name<br />
Is your company<br />
undertaking this project<br />
development? (Yes/No)<br />
If “No” who is?<br />
Project type<br />
(e.g. Gas, Gold)<br />
Location<br />
Commencement year for<br />
construction<br />
End year for construction<br />
Is the new project an<br />
expansion of an existing<br />
one? Yes/No<br />
If an expansion of existing<br />
project then how many<br />
staff does the project<br />
currently employ?<br />
Australian Government Statistical Clearing House Approval Number 02080 – 01<br />
7 of 16<br />
<strong>National</strong> <strong>Resources</strong> <strong>Sector</strong> <strong>Employment</strong> <strong>Taskforce</strong>: <strong>Technical</strong> <strong>Paper</strong> | 91
For question 8 please refer to the occupations list from Q6.<br />
Q8. For the projects listed in Question 7, how many employees (by occupation) do you<br />
anticipate requiring for each major project you will be involved in over the next five<br />
years? If some of these positions are expected to be covered by existing employees please<br />
exclude them from projected employees.<br />
Note: Only include direct employees and not workers employed by your contractors undertaking work on the<br />
project. Use one table per major project. Please copy more tables as required.<br />
PROJECT NAME: Insert Project Name<br />
LOCATION: Insert Location of Project (including State/Territory)<br />
CONSTRUCTION PHASE DUE TO BEGIN:<br />
Insert Month/Year<br />
CONSTRUCTION PHASE DUE TO END: Insert Month/Year<br />
NUMBER OF<br />
EMPLOYEES<br />
Managers (e.g. superintendents, supervisors and<br />
foremen positions)<br />
Professionals (e.g. civil engineer, geotechnical<br />
engineer)<br />
Technicians (e.g. building and engineering<br />
technicians)<br />
Tradespersons (e.g. electricians, plumbers)<br />
Machinery Operators and Drivers (e.g. crane, hoist<br />
and lift operators)<br />
Labourers (building and plumbing labourers,<br />
concreters)<br />
Other<br />
OPERATIONAL PHASE DUE TO BEGIN: Insert Month/Year<br />
Managers (e.g. superintendents, supervisors and<br />
foremen positions)<br />
Professionals (e.g. mechanical engineer)<br />
Technicians (e.g. pipe testing technician)<br />
Tradespersons (e.g. metal fitters and machinists)<br />
Machinery Operators and Drivers (e.g. drillers,<br />
miners and shot firers)<br />
Labourers (e.g. crane chaser, driller’s assistant,<br />
lagger)<br />
Other<br />
NUMBER OF<br />
EMPLOYEES<br />
NUMBER OF<br />
MAN-MONTHS<br />
NUMBER OF<br />
MAN-MONTHS<br />
WHEN<br />
WILL THEY<br />
COMMENCE?<br />
e.g. March 2010<br />
FOR HOW LONG<br />
WILL THEY BE<br />
NEEDED?<br />
Australian Government Statistical Clearing House Approval Number 02080 – 01<br />
8 of 16<br />
92 | <strong>National</strong> <strong>Resources</strong> <strong>Sector</strong> <strong>Employment</strong> <strong>Taskforce</strong>: <strong>Technical</strong> <strong>Paper</strong>
Q9. What proportion of gross wages did you spend on training in the financial year 2008-09?<br />
Proportion of company’s gross wages<br />
%<br />
Q10. Based on the proportion of gross wages you spent on training (see Q9.) what percentage<br />
was spent on the following categories:<br />
Qualifications attained %<br />
Attainment of formal qualifications? (e.g. 50%)<br />
(includes nationally/state recognised qualifications e.g. Bachelor degree level, Advanced<br />
diploma & diploma level, Certificate level)<br />
Attainment of skills sets? (e.g. 25%)<br />
(includes single units (of competency) or combinations of units which link to a licence or<br />
regulatory requirement, or defined industry need)<br />
Non-accredited training? (e.g. 25%)<br />
(includes privately funded training onsite or organised by the company at another private venue<br />
e.g. training with Caterpillar to operate Caterpillar equipment)<br />
Other training? (e.g. 0%)<br />
Total 100%<br />
Q11. How many people did you train in the financial year 2008–09? And of these people,<br />
how many did you train through the publicly funded system (e.g. through Australian<br />
Apprenticeships)?<br />
How many people did you train in the financial year 2008–09?<br />
How many people did you train through the publicly funded system?<br />
Australian Government Statistical Clearing House Approval Number 02080 – 01<br />
9 of 16<br />
<strong>National</strong> <strong>Resources</strong> <strong>Sector</strong> <strong>Employment</strong> <strong>Taskforce</strong>: <strong>Technical</strong> <strong>Paper</strong> | 93
Q12. Do you have any current vacancies (permanent or temporary) for positions in the<br />
resources sector? (Tick one box)<br />
Yes *<br />
No *<br />
Q13. Has your company experienced recruitment difficulties in the last 6 months for resources<br />
projects? (Tick one box)<br />
Yes * Go to Q14<br />
No * Go to Q16<br />
Q14. If you answered Yes at Q13:<br />
Rate the level of recruitment difficulty your company has experienced. (Tick one box)<br />
Level of difficulty<br />
Minor<br />
Moderate<br />
Difficult<br />
Managed to fill vacancies, but dissatisfied with the pool of<br />
candidates overall (with respect to size of pool, qualifications of<br />
candidates, etc).<br />
Able to fill vacancies only after extensive effort (e.g. after readvertising<br />
a position).<br />
Unable to fill a vacancy satisfactorily.<br />
Tick one box<br />
Australian Government Statistical Clearing House Approval Number 02080 -- 01<br />
10 of 16<br />
94 | <strong>National</strong> <strong>Resources</strong> <strong>Sector</strong> <strong>Employment</strong> <strong>Taskforce</strong>: <strong>Technical</strong> <strong>Paper</strong>
Q15. Provide information on those occupations where you have experienced the most<br />
significant (i.e. “Moderate” or “Difficult”) recruitment difficulties.<br />
Occupation<br />
Refer to Mining, Construction and<br />
Related Occupations in question 6<br />
for examples of occupations.<br />
Length of recruitment from advertisement<br />
1 = Up to a fortnight<br />
2 = Up to 1 month<br />
3 = From 1 to 3 months<br />
4 = Over 3 months<br />
(Please select one)<br />
Australian Government Statistical Clearing House Approval Number 02080 – 01<br />
11 of 16<br />
<strong>National</strong> <strong>Resources</strong> <strong>Sector</strong> <strong>Employment</strong> <strong>Taskforce</strong>: <strong>Technical</strong> <strong>Paper</strong> | 95
Q16. What was your company’s annual labour turnover rate (in percentage terms) among<br />
employees for each of the past three calendar years (2007, 2008 and 2009)?<br />
Calendar year %<br />
2007<br />
2008<br />
2009<br />
Q17. Based on previous experience, what are the most common reasons for employee turnover<br />
in your company? (Number in order of most common reason)<br />
Moved to another resources sector company<br />
Moved to another construction company<br />
Moved to another industry<br />
Left the labour force<br />
Other (Please specify)<br />
Q18. For those who leave the industry what are the most common reasons?<br />
(Number in order of most common reason)<br />
Short-term contractual arrangements<br />
Working conditions<br />
Preparedness to FIFO<br />
Lifestyle reasons<br />
Family reasons<br />
To pursue a new career<br />
Other (Please specify)<br />
Australian Government Statistical Clearing House Approval Number 02080 – 01<br />
12 of 16<br />
96 | <strong>National</strong> <strong>Resources</strong> <strong>Sector</strong> <strong>Employment</strong> <strong>Taskforce</strong>: <strong>Technical</strong> <strong>Paper</strong>
Q19. How does your organisation most commonly recruit?<br />
(Number in order of most commonly used for each employee type)<br />
Company website<br />
Onsite recruitment or personal<br />
contacts<br />
Newspaper advertisements<br />
Internet advertisements<br />
Trade journal advertisements<br />
Word of mouth<br />
Job Services Australia providers<br />
Other recruitment companies<br />
Local labour hire<br />
Skilled migration<br />
Other (please specify)<br />
Employee type<br />
Professionals Trades Operators Other<br />
Q20. Which government employment and training initiatives have you accessed to recruit<br />
new labour (e.g. Australian Apprenticeship Commencement Incentive, Australian<br />
Apprenticeship Completion Incentive)? Was the initiative useful? How could the initiative<br />
be made more responsive to the labour needs of the resources sector?<br />
Name of government<br />
employment and training<br />
initiative<br />
Was the initiative useful?<br />
How could the initiative be<br />
made more responsive to the<br />
labour needs of the resources<br />
sector?<br />
If you have suggestions for other government initiatives please include them at Q21.<br />
Australian Government Statistical Clearing House Approval Number 02080 – 01<br />
13 of 16<br />
<strong>National</strong> <strong>Resources</strong> <strong>Sector</strong> <strong>Employment</strong> <strong>Taskforce</strong>: <strong>Technical</strong> <strong>Paper</strong> | 97
Q21. Do you have any suggestions to improve the availability of labour and skills for the<br />
resources sector?<br />
Australian Government Statistical Clearing House Approval Number 02080 – 01<br />
14 of 16<br />
98 | <strong>National</strong> <strong>Resources</strong> <strong>Sector</strong> <strong>Employment</strong> <strong>Taskforce</strong>: <strong>Technical</strong> <strong>Paper</strong>
Thank you for taking the time to complete this survey<br />
Please indicate the approximate time that it has taken to complete the survey.<br />
______________ Hours _______________ Minutes<br />
To help us clarify any specific issues, please provide a contact name and details.<br />
• Answering this question is OPTIONAL.<br />
• This question will be used to clarify any specific issues related to the questionnaire only.<br />
• See page 1 for the confidentiality note.<br />
Name: __________________________________________________________________________________<br />
Phone: (________)________________________________________________________________________<br />
Area code<br />
Email: __________________________________________________________________________________<br />
Australian Government Statistical Clearing House Approval Number 02080 – 01<br />
15 of 16<br />
<strong>National</strong> <strong>Resources</strong> <strong>Sector</strong> <strong>Employment</strong> <strong>Taskforce</strong>: <strong>Technical</strong> <strong>Paper</strong> | 99
(Please write question number and response)<br />
Australian Government Statistical Clearing House Approval Number 02080 – 01<br />
16 of 16<br />
100 | <strong>National</strong> <strong>Resources</strong> <strong>Sector</strong> <strong>Employment</strong> <strong>Taskforce</strong>: <strong>Technical</strong> <strong>Paper</strong>
Appendix VII—Acronyms<br />
AAC<br />
ABARE<br />
AIG/ACA<br />
ATN<br />
ABS<br />
ACED<br />
ACTU<br />
AMWU<br />
ANET<br />
APESMA<br />
APPEA<br />
AQF<br />
AWU<br />
AMWU<br />
BER<br />
BMA<br />
CDEP<br />
CFMEU<br />
COAG<br />
CMEWA<br />
CPSISC<br />
CSG-LNG<br />
CSM-LNG<br />
DEEWR<br />
DIAC<br />
DIDO<br />
DITRDLG<br />
DRET<br />
EMA<br />
ENS<br />
ENSOL<br />
ESQ<br />
FIFO<br />
GAGAL<br />
GDP<br />
GTA<br />
GTO<br />
GSM<br />
LNG<br />
LPG<br />
MCA<br />
MCE<br />
MCMPR<br />
MEA<br />
MOU<br />
MTEC<br />
MCTEE<br />
NCVER<br />
NESA<br />
Australian Apprenticeship Centre<br />
Australian Bureau of Agricultural and Resource Economics<br />
Australian Industry Group/ Australian Constructors Association<br />
Australian Technology Network<br />
Australian Bureau of Statistics<br />
Australian Council of Engineering Deans<br />
Australian Council of Trade Unions<br />
Australian Manufacturing Workers Union<br />
Australian <strong>National</strong> Engineering <strong>Taskforce</strong><br />
Association of Professional Engineers, Scientists and Managers<br />
Australian Petroleum Production & Exploration Association<br />
Australian Qualifications Framework<br />
Australian Workers Union<br />
Australian Manufacturing Workers Union<br />
Building the Education Revolution<br />
Billiton Mitsubishi Alliance<br />
Community Development <strong>Employment</strong> Project<br />
Construction, Forestry, Mining and Energy Union<br />
Council of Australian Governments<br />
Chamber Minerals and Energy of Western Australia<br />
Construction and Property Services Industry Skills Council<br />
Coal Seam Gas-Liquefied Natural Gas<br />
Coal Seam Methane-Liquified Natural Gas<br />
Department of Education, <strong>Employment</strong> and Workplace Relations<br />
Department of Immigration and Citizenship<br />
Drive-in Drive-out<br />
Department of Infrastructure, Transport, Regional Development & Local Government<br />
Department of <strong>Resources</strong>, Energy & Tourism<br />
Enterprise Migration Agreement<br />
Employer Nomination Scheme<br />
Employer Nomination Scheme Occupations List<br />
Energy Skills Queensland<br />
Fly-In Fly-Out<br />
Gladstone Area Group Apprentices Ltd<br />
Gross Domestic Product<br />
Group Training Australia<br />
Group Training Organisation<br />
General Skills Migration<br />
Liquefied Natural Gas<br />
Liquefied Petroleum Gas<br />
Minerals Council of Australia<br />
Ministerial Council on Energy<br />
Ministerial Council for Mineral and Petroleum <strong>Resources</strong><br />
Mining Education Australia<br />
Memorandum of Understanding<br />
Minerals Tertiary Education Council<br />
Ministerial Council for Tertiary Education and <strong>Employment</strong><br />
<strong>National</strong> Centre for Vocational Education Research<br />
<strong>National</strong> <strong>Employment</strong> Services Association<br />
<strong>National</strong> <strong>Resources</strong> <strong>Sector</strong> <strong>Employment</strong> <strong>Taskforce</strong>: <strong>Technical</strong> <strong>Paper</strong> | 101
NLS<br />
NRSET<br />
QMEA<br />
QRC<br />
RPL<br />
RCC<br />
RTO<br />
RITC<br />
RBA<br />
RSMS<br />
SOL<br />
SVI<br />
TAFE<br />
VET<br />
WELD<br />
<strong>National</strong> Licensing System<br />
<strong>National</strong> <strong>Resources</strong> <strong>Sector</strong> <strong>Employment</strong> <strong>Taskforce</strong><br />
Queensland Minerals and Energy Academy<br />
Queensland <strong>Resources</strong> Council<br />
Recognition of Prior Learning<br />
Recognition of Current Competencies<br />
Registered Training Organisation<br />
<strong>Resources</strong> Industry Training Council<br />
Reserve Bank of Australia<br />
Regional Sponsored Migration Scheme<br />
Skilled Occupation List<br />
Skilled Vacancy Index<br />
<strong>Technical</strong> and Further Education<br />
Vocational Education and Training<br />
Working on <strong>Employment</strong>, Learning and Development<br />
102 | <strong>National</strong> <strong>Resources</strong> <strong>Sector</strong> <strong>Employment</strong> <strong>Taskforce</strong>: <strong>Technical</strong> <strong>Paper</strong>
Appendix VIII—References<br />
Access Economics 2009, Economic Modelling of Skills Demand, 22 October 2009, Skills<br />
Australia, Canberra, viewed January 2010, www.deewr.gov.au/skills/programs/<br />
skillsaustralia/documents/ae_skills_demand.pdf<br />
Australian Bureau of Agricultural and Resource Economics (ABARE) 2010, Australian<br />
Commodities March quarter 2010, vol. 17, no. 1, ABARE, Canberra.<br />
Australian Bureau of Statistics (ABS) 2007, 2006 Census tables online: field of study by industry,<br />
cat. no. 2068.0, ABS, Canberra.<br />
Australian Bureau of Statistics (ABS) 2008a, Labour force survey November 2008, cat. no.<br />
6291.0.55.003, ABS, Canberra.<br />
Australian Bureau of Statistics 2008b, Labour mobility survey, February 2008, cat. no. 6209.0.<br />
ABS, Canberra.<br />
Australian Bureau of Statistics (ABS) 2010a, Labour force: Four quarter average to February<br />
2010, cat. no. 6291.0.55.003, ABS, Canberra.<br />
Australian Bureau of Statistics (ABS) 2010b, Construction work done, Australia: Four quarter<br />
average to December 2009, cat. no. 8755.0, ABS, Canberra.<br />
Australian Bureau of Statistics (ABS) 2010c, Labour force, Australia, February 2010, cat. no.<br />
6202.0, ABS, Canberra.<br />
Australian Bureau of Statistics (ABS) 2010d, Labour price index: March quarter 2010, cat. no.<br />
6345.0, ABS, Canberra,<br />
Australian Treasury 2010a, Budget papers, Statement 2: Economic outlook, p. 2–21,<br />
Commonwealth of Australia, Canberra, viewed 21 May 2010, www.budget.gov.au/2010-11/<br />
content/bp1/download/bp1_bst2.pdf<br />
Australian Treasury 2010b, The resource super profits tax: a fair return to the nation,<br />
Commonwealth of Australia, Canberra.<br />
Construction and Property Services Industry Skills Council (CPSISC) 2010. Environmental<br />
Scan 2010–11, CPSISC, Canberra, viewed 12 May 2010. www.cpsisc.com.au/resources/<br />
Corporate%20Plan/FINAL_CPSISC_Environmental_Scan_120309.pdf<br />
Department of Education, <strong>Employment</strong> and Workplace Relations (DEEWR) 2010a, <strong>Employment</strong><br />
outlook for construction, p. 6, DEEWR, Canberra<br />
Department of Education, <strong>Employment</strong> and Workplace Relations (DEEWR) 2010b, <strong>Employment</strong><br />
outlook for mining, p. 6, DEEWR, Canberra.<br />
Department of Education, <strong>Employment</strong> and Workplace Relations (DEEWR) 2010c, Small area<br />
labour markets Australia, December quarter 2009, DEEWR, Canberra.<br />
Department of Immigration and Citizenship (DIAC) 2010, Subclass 457 Business (Long Stay)<br />
State/Territory Summary Report, 2008-09 Financial year to 31 March 2010, DIAC, Canberra.<br />
<strong>National</strong> <strong>Resources</strong> <strong>Sector</strong> <strong>Employment</strong> <strong>Taskforce</strong>: <strong>Technical</strong> <strong>Paper</strong> | 103
Energy Skills Queensland 2009, Part A – Workforce planning report to inform the workforce<br />
& competency development strategy plan for the Queensland coal seam gas/liquefied natural<br />
gas industry, Energy Skills Queensland, Brisbane.<br />
Graduate Careers Australia 2009, Graduate destinations 2008; the report of the graduate<br />
destinations survey, Graduate Careers Australia Ltd, Melbourne.<br />
Heuris Partners Ltd 2008, Planning for resources growth in the Pilbara: <strong>Employment</strong> and<br />
Population Projections to 2020, Pilbara Industry’s Community Council (PICC), Melbourne,<br />
www.catalyst.org/publication/82/the-bottom-line-connecting-corporate-performanceand-gender-diversity<br />
Karmel, T & Mlotkowski, P 2010, Tradespeople for the resources sector: projections 2010–20,<br />
<strong>National</strong> Centre for Vocational Education Research, Adelaide.<br />
Lampard, M et al. 2010, Minerals and energy, major development projects – April 2010 listing,<br />
ABARE, Canberra, viewed 28 May 2010, www.abareconomics.com/publications_html/<br />
energy/energy_10/ME10_Apr.pdf<br />
Lowry, D Molloy, S & Tan, Y 2006, The labour force outlook for the mineral resources sector:<br />
2005 to 2015, <strong>National</strong> Institute of Labour Studies (NILS), Adelaide.<br />
Mining Industry Skills Centre Inc. (MISC) 2009, <strong>Resources</strong> Industry Heartbeat Project,<br />
MISC, Brisbane.<br />
<strong>National</strong> Centre for Vocational Education (NCVER) 2010, Historical Time Series of<br />
Apprenticeships and Traineeships in Australia, from 1963, NCVER, Adelaide.<br />
<strong>National</strong> <strong>Resources</strong> <strong>Sector</strong> <strong>Employment</strong> <strong>Taskforce</strong> 2010, Resourcing the future: discussion<br />
paper, Department of Education, <strong>Employment</strong> and Workplace Relations, Canberra,<br />
viewed 11 May 2010, www.deewr.gov.au/Skills/Programs/<strong>National</strong>/nrset/Pages/<br />
ResourcingtheFuture.aspx<br />
Queensland Major Contractors Association 2010, 2010 Major projects report: Queensland<br />
engineering construction outlook, QMCA, Brisbane.<br />
Reserve Bank of Australia 2010, Statement on monetary policy May 2010, RBA’s Statements<br />
on Monetary Policy, RBA, Sydney, viewed 4 June 2010, www.rba.gov.au/publications/<br />
smp/2010/may/html/index.html<br />
Richardson, D 2010, ‘Minerals in the Australian economy’, paper presented at the <strong>National</strong><br />
Peak Minerals Forum, The Australian Institute, Canberra, 29 April 2010.<br />
Shah, C and Burke, G 2004, Labour Mobility: Demographic, Labour Force and Education Effects<br />
and Implications for VET, Monash University Centre for the Economics of Education and<br />
Training, Melbourne.<br />
SkillsDMC 2010, Environmental scan 2010: building capacity and capability at enterprises to<br />
support workforce planning & development, SkillsDMC, Sydney.<br />
South Australia Training and Skills Comission (SATSC) 2009 , Skills for Jobs: Priorities for<br />
Developing South Australia’s Workforce, South Australia Training and Skills Commission,<br />
Adelaide.<br />
104 | <strong>National</strong> <strong>Resources</strong> <strong>Sector</strong> <strong>Employment</strong> <strong>Taskforce</strong>: <strong>Technical</strong> <strong>Paper</strong>
WA Department of Training and Workforce Development 2010, Workforce development –<br />
planning and coordination, Pit Crew data quoted p. 6, Government of WA, Perth.<br />
Waller, M 2010, Planning for resources growth in the Pilbara: revised employment and<br />
population projections to 2020, Heuris Partners, Melbourne.<br />
<strong>National</strong> <strong>Resources</strong> <strong>Sector</strong> <strong>Employment</strong> <strong>Taskforce</strong>: <strong>Technical</strong> <strong>Paper</strong> | 105
106 | <strong>National</strong> <strong>Resources</strong> <strong>Sector</strong> <strong>Employment</strong> <strong>Taskforce</strong>: <strong>Technical</strong> <strong>Paper</strong>