National Resources Sector Employment Taskforce Technical Paper
National Resources Sector Employment Taskforce Technical Paper
National Resources Sector Employment Taskforce Technical Paper

You also want an ePaper? Increase the reach of your titles
YUMPU automatically turns print PDFs into web optimized ePapers that Google loves.
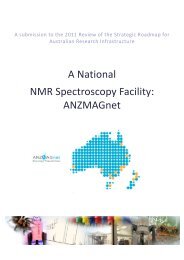
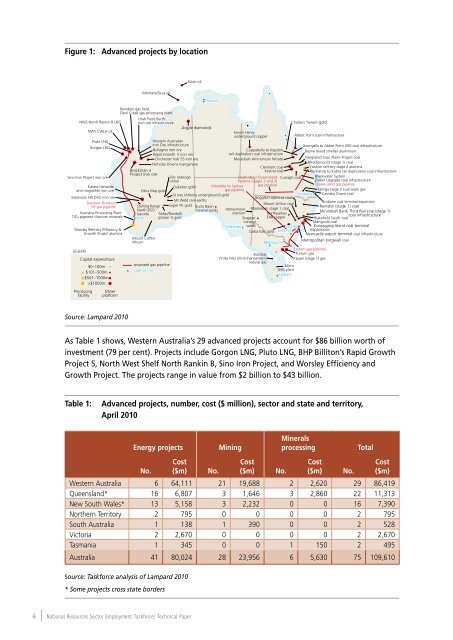
Figure 1: Advanced projects by location<br />
Kitan oil<br />
Montara/Skua oil<br />
Darwin<br />
Karara hematite<br />
and magnetite iron ore<br />
Extension Hill DSO iron ore<br />
Dampier–Bunbury<br />
5B gas pipeline<br />
Kwinana Processing Plant<br />
TiO 2 pigment titanium minerals<br />
Worsley Refinery Efficiency &<br />
Growth Project alumina<br />
LEGEND<br />
NWS North Rankin B LNG<br />
NWS CWLH oil<br />
Pluto LNG<br />
Gorgon LNG<br />
Sino Iron Project iron ore<br />
Capital expenditure<br />
$0–100m<br />
$101–500m<br />
$501–1000m<br />
>$1000m<br />
Processing<br />
facility<br />
Mine/<br />
platform<br />
Reindeer gas field,<br />
Devil Creek gas processing plant<br />
Utah Point Berth<br />
iron ore infrastructure<br />
Charters Towers gold<br />
Argyle diamonds<br />
Ernest Henry<br />
underground copper<br />
Abbot Point coal infrastructure<br />
Western Australian<br />
Iron Ore infrastructure<br />
Goonyella to Abbot Point X50 coal infrastructure<br />
Nullagine iron ore<br />
Coppabella to Ingsdon<br />
Boyne Island smelter aluminium<br />
Rapid Growth 5 iron ore<br />
rail duplication coal infrastructure<br />
Chichester hub 55 iron ore<br />
Moranbah Ammonium Nitrate<br />
Integrated Isaac Plains Project coal<br />
Middlemount (stage 1) coal<br />
Nicholas Downs manganese<br />
Clermont coal<br />
Yarwun refinery stage 2 alumina<br />
Brockman 4<br />
Kestrel coal<br />
Rocklands to Kabra rail duplication coal infrastructure<br />
Project iron ore<br />
Talc redesign<br />
South West Queensland Curragh coal Blackwater System<br />
nickel<br />
Pipeline (stages 2 and 3)<br />
Power Upgrade coal infrastructure<br />
Moomba to Sydney gas pipeline<br />
Queensland gas pipeline<br />
Duketon gold<br />
Edna May gold<br />
gas pipeline<br />
Talinga stage 2 coal seam gas<br />
St Ives (Athena underground) gold<br />
Brisbane<br />
Cameby Down coal<br />
Boggabri opencut coal<br />
Mt Weld rare earths<br />
Brisbane coal terminal expansion<br />
Mount Arthur coal<br />
Darling Range Super Pit gold Eucla Basin<br />
Narrabri (stage 1) coal<br />
North DSO<br />
mineral sands Honeymoon Moolarben stage 1 coal<br />
Minimbah Bank Third Rail Line (stage 1)<br />
bauxite Aldiss/Randalls<br />
uranium<br />
Northparkes<br />
coal infrastructure<br />
Perth (phase 1) gold<br />
Snapper E48 copper<br />
Blakefield South coal<br />
mineral<br />
Mangoola coal<br />
Adelaide sands<br />
Sydney Kooragang island coal terminal<br />
Cadia East gold<br />
Canberra expansions<br />
Newcastle export terminal coal infrastructure<br />
Mount Cattlin<br />
lithium<br />
Melbourne<br />
Metropolitan longwall coal<br />
Eastern gas pipeline<br />
BassGas<br />
Turrum gas<br />
(Yolla Mid Life Enhancement)<br />
Kipper (stage 1) gas<br />
natural gas<br />
proposed gas pipeline<br />
capital city<br />
Micro<br />
LNG plant<br />
Hobart<br />
Source: Lampard 2010<br />
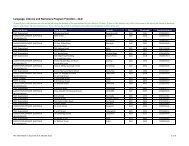
As Table 1 shows, Western Australia’s 29 advanced projects account for $86 billion worth of<br />
investment (79 per cent). Projects include Gorgon LNG, Pluto LNG, BHP Billiton’s Rapid Growth<br />
Project 5, North West Shelf North Rankin B, Sino Iron Project, and Worsley Efficiency and<br />
Growth Project. The projects range in value from $2 billion to $43 billion.<br />
Table 1:<br />
Advanced projects, number, cost ($ million), sector and state and territory,<br />
April 2010<br />
Energy projects<br />
No.<br />
Cost<br />
($m)<br />
No.<br />
Mining<br />
Cost<br />
($m)<br />
Minerals<br />
processing<br />
No.<br />
Cost<br />
($m)<br />
No.<br />
Total<br />
Cost<br />
($m)<br />
Western Australia 6 64,111 21 19,688 2 2,620 29 86,419<br />
Queensland* 16 6,807 3 1,646 3 2,860 22 11,313<br />
New South Wales* 13 5,158 3 2,232 0 0 16 7,390<br />
Northern Territory 2 795 0 0 0 0 2 795<br />
South Australia 1 138 1 390 0 0 2 528<br />
Victoria 2 2,670 0 0 0 0 2 2,670<br />
Tasmania 1 345 0 0 1 150 2 495<br />
Australia 41 80,024 28 23,956 6 5,630 75 109,610<br />
Source: <strong>Taskforce</strong> analysis of Lampard 2010<br />
* Some projects cross state borders<br />
4 | <strong>National</strong> <strong>Resources</strong> <strong>Sector</strong> <strong>Employment</strong> <strong>Taskforce</strong>: <strong>Technical</strong> <strong>Paper</strong>