National Resources Sector Employment Taskforce Technical Paper
National Resources Sector Employment Taskforce Technical Paper
National Resources Sector Employment Taskforce Technical Paper

Create successful ePaper yourself
Turn your PDF publications into a flip-book with our unique Google optimized e-Paper software.
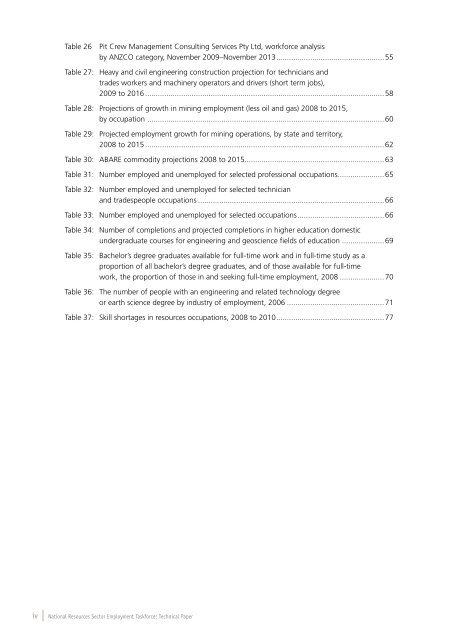
Table 26 Pit Crew Management Consulting Services Pty Ltd, workforce analysis<br />
by ANZCO category, November 2009–November 2013...................................................55<br />
Table 27: Heavy and civil engineering construction projection for technicians and<br />
trades workers and machinery operators and drivers (short term jobs),<br />
2009 to 2016..................................................................................................................58<br />
Table 28: Projections of growth in mining employment (less oil and gas) 2008 to 2015,<br />
by occupation ................................................................................................................60<br />
Table 29: Projected employment growth for mining operations, by state and territory,<br />
2008 to 2015..................................................................................................................62<br />
Table 30: ABARE commodity projections 2008 to 2015..................................................................63<br />
Table 31: Number employed and unemployed for selected professional occupations......................65<br />
Table 32: Number employed and unemployed for selected technician<br />
and tradespeople occupations.........................................................................................66<br />
Table 33: Number employed and unemployed for selected occupations.........................................66<br />
Table 34: Number of completions and projected completions in higher education domestic<br />
undergraduate courses for engineering and geoscience fields of education.....................69<br />
Table 35: Bachelor’s degree graduates available for full-time work and in full-time study as a<br />
proportion of all bachelor’s degree graduates, and of those available for full-time<br />
work, the proportion of those in and seeking full-time employment, 2008......................70<br />
Table 36: The number of people with an engineering and related technology degree<br />
or earth science degree by industry of employment, 2006...............................................71<br />
Table 37: Skill shortages in resources occupations, 2008 to 2010...................................................77<br />
iv | <strong>National</strong> <strong>Resources</strong> <strong>Sector</strong> <strong>Employment</strong> <strong>Taskforce</strong>: <strong>Technical</strong> <strong>Paper</strong>