REVISTA ROMÃNÄ DE AUTOMATICÄ - IPA SA
REVISTA ROMÃNÄ DE AUTOMATICÄ - IPA SA
REVISTA ROMÃNÄ DE AUTOMATICÄ - IPA SA

You also want an ePaper? Increase the reach of your titles
YUMPU automatically turns print PDFs into web optimized ePapers that Google loves.
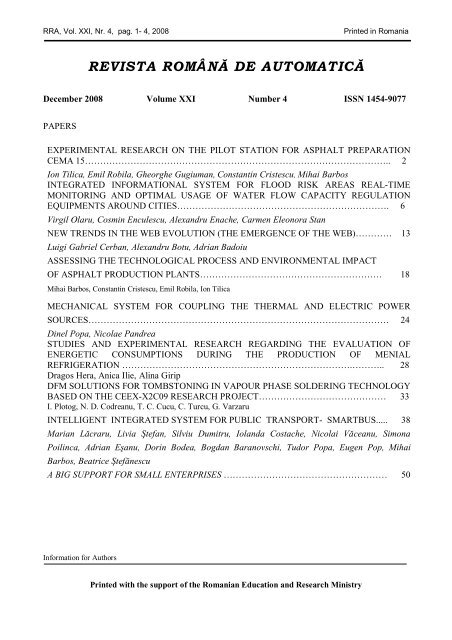
RRA, Vol. XXI, Nr. 4, pag. 1- 4, 2008<br />
Printed in Romania<br />
<strong>REVISTA</strong> ROMÂNĂ <strong>DE</strong> AUTOMATICĂ<br />
December 2008 Volume XXI Number 4 ISSN 1454-9077<br />
PAPERS<br />
EXPERIMENTAL RESEARCH ON THE PILOT STATION FOR ASPHALT PREPARATION<br />
CEMA 15……………………………………………………………………………………….. 2<br />
Ion Tilica, Emil Robila, Gheorghe Gugiuman, Constantin Cristescu, Mihai Barbos<br />
INTEGRATED INFORMATIONAL SYSTEM FOR FLOOD RISK AREAS REAL-TIME<br />
MONITORING AND OPTIMAL U<strong>SA</strong>GE OF WATER FLOW CAPACITY REGULATION<br />
EQUIPMENTS AROUND CITIES……………………………………………………………. 6<br />
Virgil Olaru, Cosmin Enculescu, Alexandru Enache, Carmen Eleonora Stan<br />
NEW TRENDS IN THE WEB EVOLUTION (THE EMERGENCE OF THE WEB)………… 13<br />
Luigi Gabriel Cerban, Alexandru Botu, Adrian Badoiu<br />
ASSESSING THE TECHNOLOGICAL PROCESS AND ENVIRONMENTAL IMPACT<br />
OF ASPHALT PRODUCTION PLANTS…………………………………………………… 18<br />
Mihai Barbos, Constantin Cristescu, Emil Robila, Ion Tilica<br />
MECHANICAL SYSTEM FOR COUPLING THE THERMAL AND ELECTRIC POWER<br />
SOURCES……………………………………………………………………………………… 24<br />
Dinel Popa, Nicolae Pandrea<br />
STUDIES AND EXPERIMENTAL RESEARCH REGARDING THE EVALUATION OF<br />
ENERGETIC CONSUMPTIONS DURING THE PRODUCTION OF MENIAL<br />
REFRIGERATION ………………………………………………………………….……….. 28<br />
Dragos Hera, Anica Ilie, Alina Girip<br />
DFM SOLUTIONS FOR TOMBSTONING IN VAPOUR PHASE SOL<strong>DE</strong>RING TECHNOLOGY<br />
BASED ON THE CEEX-X2C09 RESEARCH PROJECT…………………………………… 33<br />
I. Plotog, N. D. Codreanu, T. C. Cucu, C. Turcu, G. Varzaru<br />
INTELLIGENT INTEGRATED SYSTEM FOR PUBLIC TRANSPORT- SMARTBUS..... 38<br />
Marian Lăcraru, Livia Ştefan, Silviu Dumitru, Iolanda Costache, Nicolai Văceanu, Simona<br />
Poilinca, Adrian Eşanu, Dorin Bodea, Bogdan Baranovschi, Tudor Popa, Eugen Pop, Mihai<br />
Barbos, Beatrice Ştefănescu<br />
A BIG SUPPORT FOR SMALL ENTERPRISES ……………………………………………… 50<br />
Information for Authors<br />
Printed with the support of the Romanian Education and Research Ministry
2<br />
<strong>REVISTA</strong> ROMÂNĂ <strong>DE</strong> AUTOMATICĂ<br />
EXPERIMENTAL RESEARCH ON THE PILOT STATION FOR ASPHALT<br />
PREPARATION CEMA 15<br />
Ion TILICA, Emil ROBILA<br />
MITECO S.A. Iasi, Romania<br />
Gheorghe GUGIUMAN<br />
University “Gh. Asachi” Iasi, Romania<br />
Constantin CRISTESCU, Mihai BARBOS<br />
<strong>IPA</strong> <strong>SA</strong> Bucharest, Romania<br />
Abstract: This paper presents the conclusions of the experimental research on a pilot station CEMA 15<br />
for asphalt preparation, in the scope of validating the technical solutions for further appliance in the<br />
conception of series plants with much bigger capacities, intended for contributing in the economic<br />
competitively growing of the Romanian producer- partner in this project.<br />
Key words: asphalt mixtures, pre-batching, drying, weighing, automation system<br />
1. Introduction<br />
Researches have consisted in experimental<br />
tests, measurements, determinations of<br />
parameters, testing, the programme conceived<br />
by the designer MITECO s.a. Iasi.<br />
Experimental research activities took place<br />
both on the CEMA 15 central pilot<br />
subassemblies, located in operation at S.c.<br />
Nesand Tulcea, as well as in the production<br />
department of TAR s.r.l. Iasi, in the<br />
authorized laboratory of Univ. Tehnica Iasi -<br />
Faculty Construction (Roads Department),<br />
and in specialized equipment for software of<br />
<strong>IPA</strong> Bucharest.<br />
Researches have been developed on the central<br />
pilot - until 27.06.2008 - on 39,412 charges, up<br />
to 20,062 tons of prepared mixtures.<br />
a)<br />
b)<br />
2. Experimental researches regarding the<br />
systems of pre-batching and weighing<br />
The process of preparation of asphalt<br />
mixtures in a CEMA 15 includes:<br />
- pre-batching with precision of the cold<br />
natural aggregates (fig.1);<br />
- weighing with precision of the natural<br />
aggregates, heated and sorted;<br />
- weighing with precision of the hot bitumen<br />
binder at 160 o C (fig. 3).<br />
c)<br />
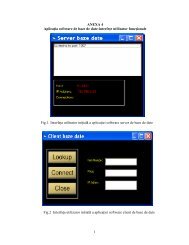
Fig.1 System for pre-batching with precision of the<br />
cold natural aggregates<br />
(4 extracting strips with variable rotation speed<br />
through frequency converters, led by PLC’s)<br />
a – setting pre-weighing; b – extractor band with<br />
sensor; c – measurement of parameters.
<strong>REVISTA</strong> ROMÂNĂ <strong>DE</strong> AUTOMATICĂ<br />
3<br />
The pre-batcher meets both requirements of<br />
capability (productivity, precision dosage,<br />
possible adjustment of recipes for different<br />
asphalt mixtures, run in automatically) and<br />
the requirements of security and<br />
environmental protection.<br />
After experimental research it was developed<br />
productivity chart (fig.2) of the pre-batcher<br />
having Φ 219mm drums at the extracting<br />
bands and with the transmission of i= 40.<br />
The batching gravimetric system for natural<br />
dry aggregates and of the cold filler has a<br />
weighing error less than 1%, within SR<br />
7970:2001[4].<br />
The gravimetric batcher system for hot<br />
bitumen (fig.3) has an weighing error less<br />
than 1%, falling into the limits SR<br />
7970:2001[4].<br />
Regarding automation equipment, its prebatching<br />
and batching functions of the pilot<br />
of the central for the preparation of mixtures<br />
CEMA 15, achieved both by running and<br />
optimizing its implemented software system,<br />
are according the technical requirements<br />
provided for operating the pilot phase.<br />
Fig. 2 The productivity chart of the pre-batcher system<br />
2. Experimental researches regarding the<br />
preparation process for asphalt<br />
mixtures<br />
After the pre-batching a drying phase comes<br />
in the technological process (max. 0,5%<br />
humidity ) and the heating of natural<br />
aggregates (175 -185 o C), a process<br />
experimentally analysed in the dry drum<br />
equipped with the automated burner GAS-G<br />
4000 MN (table 1).<br />
Fig. 3 System for weighing with precision of the hot<br />
bitumen binder<br />
(Thermo-insulated recipient , on three load cells+<br />
recirculation/watering pumps + numerical mass<br />
indicator)<br />
Table 1<br />
Process parameters of burner GAS-G 4000MN<br />
Progressive<br />
Gas<br />
flow of<br />
pressure<br />
gaseous fuel<br />
(mbar)<br />
(m 3 /h)<br />
De-pressure at the Differential Burnt gas composition<br />
frontal plate of the de-pressure<br />
dryer I/O filter sacs<br />
CO 2 CO<br />
(mmH 2 O) (cmH 2 O)<br />
(%) ppm<br />
60 ... 200 200...125 5...3 10...14 11...12 2...3 1,24...1,25<br />
O 2<br />
(%)
4<br />
<strong>REVISTA</strong> ROMÂNĂ <strong>DE</strong> AUTOMATICĂ<br />
Fig. 5 Automated burning system of the<br />
aggregate dryer<br />
The burning system has a continuous<br />
functioning at the parameters designed to<br />
ensure the quantity of heat, temperature and<br />
possibilities for automatic adjustment to the<br />
requirements of the process of heating the<br />
flow of natural aggregate necessary in the<br />
preparation in the pilot CEMA 15.<br />
The equipment for automation ensures the<br />
function / stop of the burner in all situations<br />
caused by lack of fuel, voltage, combustion air,<br />
accidentally extinction of the flame, repeated<br />
stops; is working in accordance with a diagram<br />
of automation envisaged in design and ensures<br />
the safe functioning of the combustion system<br />
within designed parameters.<br />
The dryer’s productivity is higher than that<br />
required by the pilot stationl designed<br />
productivity. The dryer can provide necessary<br />
aggregate flow dried and heated to an initial<br />
moisture of 6 .... 7%.<br />
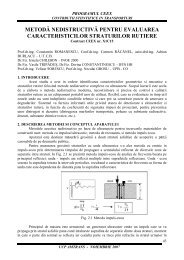
For quality determination of hot-mix produced<br />
in CEMA 15 pilot station, has been preleved<br />
and tested 8 probes in 8 batchs (table 2) of<br />
BA16 asphalt concrete:<br />
- asphalt content;<br />
- granulometric composition;<br />
- mixture aparent density;<br />
- water absorbtion;<br />
- Marshall stability and creep.<br />
Characteristics values of hot-mix BA 16 batchs<br />
Table 2<br />
Characteristics<br />
Limits<br />
SR Hot-Mix<br />
174/1 - Formula<br />
2002<br />
Batch<br />
1<br />
Batch<br />
2<br />
Batch<br />
3<br />
Batch<br />
4<br />
Batch<br />
5<br />
Batch<br />
6<br />
Batch<br />
7<br />
Batch<br />
8<br />
Bitume,% ± 0,30 5,50 5,33 5,69 5,43 5,35 5,37 5,48 5,45 5,51<br />
Aggregate,% - 94,50 94,67 94,31 94,57 94,65 94,63 94,52 94,55 94,49<br />
ρ a ,Kg/m 3 ≥<br />
2.479 2.382 2.477 2.404 2.383 2.387 2.450 2.421 2.470<br />
2.300<br />
A vol , % 2 ... 5 1,458 4,958 1,078 3,574 4,361 4,764 2,306 3,084 1,631<br />
Ø 25 100 100,00 100,00 100,00 100,00 100,00 100,00 100,00 100,00 100,00<br />
Ø 16 83...96 96,10 95,87 90,86 93,97 96,05 95,35 95,07 94,86 93,78<br />
Ø 10 66...85 69,52 74,12 73,02 72,88 74,01 73,73 73,10 72,94 74,07<br />
Ø 8 58...78 58,63 63,51 62,97 62,77 63,00 61,98 62,71 63,31 65,64<br />
# 4 42...66 45,91 46,78 44,13 43,92 43,78 44,21 45,32 46,03 45,12<br />
# 2 30...55 34,35 31,85 34,36 32,84 33,09 32,97 34,18 32,86 35,83<br />
# 1 22...42 27,02 23,24 26,54 24,95 24,81 25,26 26,44 25,17 26,71<br />
# 0,63 18...35 24,04 21,76 26,01 24,86 21,08 22,11 22,93 21,98 23,15<br />
# 0,2 11...25 14,45 13,59 16,65 15,03 14,79 15,30 16,07 15,16 15,98<br />
# 0,1 9...13 9,33 9,34 11,03 10,31 9,88 10,33 10,45 10,08 11,17<br />
# 0,071 - 7,59 7,13 9,00 8,37 7,29 7,54 8,82 7,64 8,86<br />
S, kN ≥ 7,5 8,0 9,8 9,6 10,2 9,3 8,7 10,9 9,1 8,9<br />
I, mm<br />
S/I, kN<br />
1,5 ...<br />
4,0<br />
1,8 ...<br />
5,0<br />
3,90 2,55 3,11 3,13 2,87 2,53 3,40 2,93 2,77<br />
2,051 3,843 3,087 3,259 3,240 3,439 3,206 3,106 3,213
<strong>REVISTA</strong> ROMÂNĂ <strong>DE</strong> AUTOMATICĂ<br />
5<br />
Optimum wet mixing time (37s) was<br />
established at 96% coated particles by similar<br />
procedure with AASHTO T 195 [1].<br />
3. Experimental research regarding the<br />
general automation and information<br />
integrated system of the pilot central<br />
The general integrated automation and<br />
information of the pilot central CEMA 15 has<br />
a modular structure being distributed on two<br />
machines and including 2 levels:<br />
- level one , consisting of field equipment that<br />
command technological installations and<br />
appliances that provide information about the<br />
technological equipment;<br />
- level two, consisting of the PLC, the<br />
cabinets and the computer in which are stored<br />
recipes for asphalt mixtures, screens to<br />
control the technological process and display<br />
data of the process<br />
There were tested the hardware and software<br />
conditions necessary to achieve experiments<br />
with the whole system:<br />
- the PLC installed in the control room and<br />
the cabinet on the machine 1;<br />
- the computer installed in the control room<br />
of the machine 2;<br />
- the PLC drawer on machine 2 connected<br />
through PROFIBUS-DP to the PLC drawer<br />
on machine 1;<br />
- the central unit of the PLC connected to the<br />
PC via ETHERNET;<br />
- connecting all the elements related to the<br />
pre-batch equipment to digital inputs<br />
modules, analogue and digital outputs of the<br />
PLC on machine1.<br />
- the program realized in STEP7<br />
programming language downloaded to the<br />
memory of the PLC;<br />
- WIN CC FLEXIBLE 2005 RUNTIME<br />
installed on the PC in the control room of the<br />
station;<br />
- the software made in WIN CC FLEXIBLE<br />
2005 programming language installed on the<br />
PC in the control room of the station.<br />
4. Conclusions<br />
The validated solutions obtained by the<br />
experimental results on the pilot station<br />
CEMA 15 will by applied at bigger scale in<br />
the structure of asphalt mixing plants, of<br />
larger productivities.<br />
Acknowledgements<br />
Authors acknowledges with thanks the<br />
cooperation of S.c. NE<strong>SA</strong>ND Tulcea, mr.<br />
eng. Virgil Barabangiuc.<br />
References<br />
[1] Asphalt Institute “The asphalt handbook”,<br />
Manual series no.4 (MS-4), no. 3, 1989<br />
edition, Chapter 5 – Manufacture of<br />
Hot-Mix Asphalt, pp. 175-231.<br />
[2] *** SR 174-1/2002 – Lucrari de drumuri.<br />
Imbracaminti bituminoase cilindrate<br />
executate la cald. Conditii tehnice de calitate.<br />
[3] *** SR 7970:2001 – Lucrari de drumuri.<br />
Straturi de baza din mixturi cilindrate<br />
executate la cald. Conditii tehnice de calitate<br />
si prescriptii generale de executie.<br />
[4] Siemens - WinCC V6.0 Basic<br />
Documentation, Edition: 04/03.<br />
[5] Siemens - WinCC User Archives,<br />
Edition: 11/98.<br />
AR4-1.doc
6<br />
<strong>REVISTA</strong> ROMÂNĂ <strong>DE</strong> AUTOMATICĂ<br />
INTEGRATED INFORMATIONAL SYSTEM FOR FLOOD RISK AREAS<br />
REAL-TIME MONITORING AND OPTIMAL U<strong>SA</strong>GE OF WATER FLOW<br />
CAPACITY REGULATION EQUIPMENTS AROUND CITIES<br />
Virgil OLARU, Cosmin ENCULESCU, Alexandru ENACHE<br />
S.C. <strong>IPA</strong> S.A. Bucharest<br />
virgil@ipa.ro, ecosmin@ipa.ro, enachealex@ipa.ro<br />
Carmen Eleonora STAN<br />
ITC S.A. Bucharest, carmen.stan@itc.ro<br />
Abstract: Natural disasters, hazards, cause huge damages every year. Floodings are one of these<br />
hazards. Flood risk management means the application of politics, procedures and practices having as<br />
objective the risks identification, their analysis, evaluation, monitoring and elaboration of solutions for<br />
floods reduction.<br />
The paper describes a project which contributes to national effort for flood risk management. This<br />
project will elaborate an intelligent decisional support solution which will assess in real time the<br />
environmental parameters correlated with infrastructure technical state for flood risk management, based<br />
on advanced technologies such as: automated systems of field data acquisition, radio or GSM/GPRS<br />
communication, Relational Data Based System, integrated analysis mediums of historical data massifs –<br />
Business Intelligence, modeling and prognosis technologies, GIS systems, mobile access devices for<br />
efficiently coordination of the operative activities. Complex S&T monitoring and controlling services will<br />
be provided on this technological platform.<br />
The goal of the project is - vulnerability reduction and prevention of floods in urban areas.<br />
Keywords: Flooding, Flood risk management, Real-time Monitoring, GIS<br />
I. INTRODUCTION<br />
According to the European requirements, the<br />
environmental protection must be approached<br />
in the context of sustainable development<br />
(causes identification of natural disasters,<br />
efficient preventive actions, and a global<br />
approach of the effects with socioeconomical<br />
development consequences on<br />
long and medium term).<br />
Global environmental alteration is a priority<br />
of the European strategy for sustainable<br />
development and Romania assumed thorough<br />
commitments to meet the European Union<br />
joining conditions.<br />
The proposed project frames in category of<br />
research and development projects and it is<br />
still under development.<br />
A. Context and Legal Case<br />
The natural catastrophes are also known as<br />
hazards and they are between the mains<br />
causes that yearly generate huge material<br />
damages, that directly affect the development<br />
of economic and social process and leading to<br />
the human lives losing.<br />
The floodings constitute natural phenomena<br />
and these are a component of the natural<br />
hydrological cycle of the Earth. Romania has<br />
recently confronted with this kind of<br />
phenomena.<br />
Hazard means the probability of a<br />
human/environment harmful phenomenon to<br />
occur during a certain period of time.
<strong>REVISTA</strong> ROMÂNĂ <strong>DE</strong> AUTOMATICĂ<br />
7<br />
Vulnerability indicates the level of damage<br />
caused by a certain phenomenon to humans<br />
and their assets. Risk means the probability of<br />
the humans and of their assets to be harmed<br />
by a phenomenon of a certain size. The<br />
elements that incur risk are the population,<br />
the properties, communications, and<br />
economical objectives in an area (3) .<br />
The causes of these hazards are the climatic<br />
changes, the seismic activity, but also the miss of<br />
the sustained actions for the maintenance and the<br />
modernization of the protection works as well as<br />
the miss of the environmental parameters<br />
monitoring systems.<br />
As a part of European Union, Romania must<br />
have a liability approach of the prejudice of<br />
environment with devastating consequences.<br />
National strategy for flood management risk,<br />
approved on December, 22, 2005, identifies<br />
activities specific to flood management risk:<br />
preventive activities, operational management<br />
activities, activities required to be made after<br />
floods occur; and requires: finding the right<br />
solutions, for applying the approved<br />
environment policies.<br />
The problematical of the environment<br />
protection in the sustainable development<br />
context concentrates on the natural disaster<br />
causes detection, the prevention of possible<br />
deteriorations, the global approach of the<br />
effects with consequences on socio-economic<br />
development on long and medium term.<br />
II. SYSTEM <strong>DE</strong>SCRIPTION<br />
A. System Purpose<br />
The project's aim is to elaborate technological<br />
support, necessary to environmental<br />
parameters acquisition in due time,<br />
evaluation, prognosis, follow evolutions and<br />
intelligent management of risk to flooding in<br />
an exposed area to hazard (2) .<br />
The purpose of the shown system is to<br />
contribute on the national effort of floods risk<br />
management by realization of an intelligent<br />
decisional support which will assess in real<br />
time the environmental parameters required<br />
by floods risk management in urban crowded<br />
places, on the basis of high technology like<br />
integrated mediums for historical data<br />
analysis, technology for modeling (1) and<br />
prognosis, GIS applications and mobile<br />
devices for operative activity coordination.<br />
The system will offer complex services.<br />
The system is meant to floods risk<br />
management and it permits online acquisition<br />
of environmental parameters; assures the<br />
introduction of data about this kind of<br />
hazards, into relational data base; uses a<br />
complex system of data analysis based on<br />
stochastic simulation, numerical method of<br />
evaluation and online analysis techniques of<br />
data storages for simulations, decisions and<br />
population information needful prognoses.<br />
The aim of the system is that of preventing and<br />
prealarming about the imminence of flooding<br />
occurrence in pilot zone. In this purpose, the<br />
system evaluates the real time evolution of the<br />
acquisitioned environmental parameters, on the<br />
basis of stochastic models and calculation<br />
procedure; realizes floodings prognosis that<br />
zone; generates the alerts to inform the decision<br />
factors; relieves the efficiency of consolidation<br />
measures; it informs and forms the staff from<br />
environmental domain.<br />
The project has the following scientific and<br />
technical goals:<br />
- building a real time data acquisition<br />
technological platform, analysis and<br />
decision taking - support of on-line<br />
monitorization of the parameters of the<br />
environment and the intelligent<br />
management of risk to floods;<br />
- implementation of analysis GIS support<br />
(hazard map and risk map of studied area);<br />
- implementation of services of risk<br />
management to floods;<br />
- operative information in due time the<br />
decision factors and population on static<br />
and mobile access devices;<br />
- the elaboration of prognosis solutions and<br />
evaluation of risk to flooding in<br />
determined areas and temporary intervals;<br />
- the evaluation of functioning of the<br />
hydromechanics installation operating<br />
in the dynamic regime to drain away<br />
large water flows;
8<br />
- the elaboration of efficient exploitation<br />
solutions of dam-lakes for safety<br />
functioning and optimization solutions<br />
of the sewage network in urban areas<br />
presenting risk to floods based on water<br />
control at the sources, local climate,<br />
dimensioning of sewage collectors,<br />
local or regional control elements.<br />
Adopted solution is that of an interactive<br />
system accomplishment, based on advanced<br />
technologies, ready to permit on-line flood<br />
risk management and analyze criteria for<br />
reducing the urban area vulnerability against<br />
surface and sewerage waters.<br />
<strong>REVISTA</strong> ROMÂNĂ <strong>DE</strong> AUTOMATICĂ<br />
B. System Structure<br />
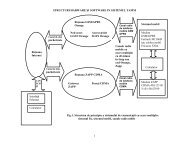
From the architecture point of view, the system<br />
is developed on the model of multiconnected<br />
networks of equipments and microcomputers<br />
based on high technology which accomplish the<br />
quick processing of an important information<br />
amount, the requirements of high reliability and<br />
open access to information system. The system<br />
is based as a SCADA distributed system and the<br />
architecture of the system is presented in Fig. 1.<br />
According with functional proposes<br />
requirements, the system allows the<br />
automatic acquisition of process parameters<br />
from transducers, their processing, the<br />
graphic presentation and GSM/GPRS or radio<br />
transmission to the central dispatcher.<br />
FIREWALL<br />
Data<br />
WEB Server<br />
Map Server<br />
SQL Server<br />
Data Base Server<br />
Local Server<br />
Flowmeter<br />
Pilot Zone 1 Pilot Zone 2 Pilot Zone n<br />
Levelmeter<br />
The chosen solutions consist of an integrated<br />
acquisition and data processing system<br />
distributed and with two levels hierarchy:<br />
- local level<br />
- central level<br />
Local level - the local automated acquisition<br />
system consists of:<br />
- Measuring device for rivers and lakes<br />
level – absolute pressure transducer<br />
mounted in the water of the lake or the<br />
river<br />
- Temperature measuring device –<br />
Figure 1. System architecture<br />
temperature transducer for continuous<br />
measuring of the air temperature<br />
(necessary for the determination of<br />
sudden snow thawing)<br />
- Rainfall measuring device – rain gauge<br />
transmitter for measuring rainfall<br />
quantity on a time unit (h) at ground<br />
level per square (m 2 )<br />
- Flow-meter device for rivers and open<br />
connecting lake channels – automatic<br />
ultrasonic flow-meter. This norm<br />
indicates the way in which open<br />
overflow channels are built, calculation
<strong>REVISTA</strong> ROMÂNĂ <strong>DE</strong> AUTOMATICĂ<br />
9<br />
formulas for the flow and how<br />
calculation is made for linearization.<br />
- Local monitoring equipment - based on<br />
microcontroller which shall be<br />
connected by cable with local<br />
environment parameters acquisition<br />
systems.<br />
This equipment is presented in Fig. 2 and<br />
shall accomplish the following function:<br />
- acquisition and monitoring of<br />
analogical signals from the<br />
transducers;<br />
- acquisition and monitoring of<br />
digital input parameters;<br />
- enabling of digital outputs<br />
(signalization of alert/ pre-alert<br />
thresholds overflow);<br />
- long distance transmission of data<br />
(full duplex RS 485 serial port, or<br />
radio/GSM/GPRS) to server;<br />
Figure 2. Local monitoring equipment<br />
Central level – center of monitoring and<br />
control; web server<br />
At this level it will be organized the control<br />
and monitoring center, where the PC-system<br />
with complex functions of Data Server which<br />
contain the Database, the dispatcher for<br />
receiving environmental parameters, the<br />
software applications meant to management<br />
(introduction of information concerning the<br />
technical state of the infrastructure, other<br />
additional useful information in risk<br />
management, alert management) shall be<br />
installed. From a conceptual viewpoint, the<br />
web Server is placed at central level too, but<br />
it can be installed in the same location or at<br />
distance. On the web server will be installed<br />
applications which will select information<br />
from the database for user services delivery<br />
through an Informatics Portal, accessible on<br />
static devices (PC, informatics kiosk) or<br />
mobile devices (PDA, mobile phone).<br />
The environment parameters acquisition devices<br />
will be transmitted by radio modem or<br />
GSM/GPRS. These will be transmitted<br />
periodically by the monitoring local equipment<br />
and when an event occurs (according to<br />
achieving pre-alert thresholds) and will be stored<br />
in the local database. The local database will be<br />
replicated periodically on the Web Server, thus<br />
ensuring a reliable functioning).<br />
The project also proposes a dissemination<br />
system and information services addressed to<br />
population, mass media and organizations.<br />
Software subsystem for multimedia platform for<br />
flood risk monitoring consist in programs for<br />
supervision and evaluation; geological data base;<br />
data base management application; GIS<br />
application developed for interactive<br />
presentation on digital map of objects and<br />
evacuation routes in pilot routes, risk maps and<br />
hazard maps of pilot zone; pilot zone risk and<br />
hazard maps; system’s Portal for information<br />
and flood risk management – it integrates all<br />
system’s functional components.<br />
The system has service oriented architecture<br />
and will provide:<br />
- integration of all relevant functions and<br />
processes ensuring investments<br />
protection;<br />
- Integration of the existing systems into<br />
the new platform;<br />
- Minimizing risk, quick reaction to<br />
change of requirements;<br />
- Reduced complexity due to the interface<br />
built on specific system integrated services;<br />
- Using XML, XSL, SOAP, UDDI,<br />
WDSL and HTTP;<br />
Flexibility;<br />
- Reliability, possibility to extend the<br />
system according to specific needs;<br />
- Scalability;<br />
- Reduced costs and increased<br />
productivity through quick transfer of<br />
applications on any platform.
10<br />
The intelligent system for flood risk<br />
management is based on GIS technologies<br />
(Geographical Information System)<br />
technologies and advanced IT platforms<br />
which will provide the informational and<br />
decisional support.<br />
The “GIS ESRI technology” is used within<br />
the project that will provide the generation of:<br />
- Digital maps of the studied area with<br />
thematic layers necessary to inform the<br />
population (surveillance devices<br />
placement, pointing out high risk<br />
perimeters, objectives meant to<br />
emergency assistance, evacuation routes<br />
tracing, blocked routes)<br />
- Flood hazard maps (isolines of<br />
geographical plane distribution of the<br />
values of the probabilities of occurrence<br />
of natural catastrophic phenomena)<br />
- Flood Hazard maps (isolines of<br />
geographical plane distribution of the<br />
values of the material and human lives<br />
loss caused by natural catastrophic<br />
phenomena)<br />
The digital maps will be accessible by<br />
internet for an intuitive presentation of the<br />
control information and flood risk<br />
monitoring.<br />
The management services will benefit from<br />
the digital maps interactivity that will allow<br />
access to the optimal escape routes depending<br />
on several criteria (traffic signs, road quality,<br />
minimal distance which avoids dangerous<br />
areas).<br />
C. Significant Results<br />
The significant result which is previsioned<br />
represents creating the technological support<br />
meant to on-line monitoring of environmental<br />
parameters, relevant for evaluating and<br />
predicting the flooding risk, based on an<br />
advanced data acquisition system, wireless<br />
communication, GIS technologies and<br />
integrated analysis software environment<br />
(Business Intelligence) which will explore<br />
massifs of real data and simulated data using<br />
probabilistic methods.<br />
We prevision the following significant<br />
results:<br />
<strong>REVISTA</strong> ROMÂNĂ <strong>DE</strong> AUTOMATICĂ<br />
- Remote control of the functioning<br />
stages of the surveillance devices<br />
installed in the proximity of the zone<br />
with high flooding risk;<br />
- Permanent monitoring of the flood<br />
phenomenon, by the interpretation of<br />
the on-line data;<br />
- Building digital maps of a hazard zone,<br />
using different thematic layers;<br />
- Developing GIS technology for building<br />
the digital hazard and risk maps;<br />
- Developing a relational database for the<br />
flooding risk management in the pilot zone;<br />
- Developing solutions for intervention in<br />
crisis situations (using modeling,<br />
simulation and evaluation technologies)<br />
which can be accessed interactively;<br />
- Developing the software instruments<br />
meant to the risk administrators for<br />
defining the alarming and civil<br />
protection strategies and task<br />
assignment;<br />
- Conducting and co-ordination of the<br />
evacuating actions of the population<br />
through real time access facilities to the<br />
operative information on mobile<br />
devices.<br />
D. Stipulated Benefits<br />
The stipulated benefits are:<br />
- Vulnerability reduction of the elements<br />
exposed to flooding risk by knowledge<br />
and action:<br />
- Location of the vulnerable zones<br />
in case of exceeding normal<br />
intervals of variation of the<br />
parameters and their presentation<br />
on the digital map;<br />
- Estimation of the duration and<br />
dimension of the phenomena<br />
based on experimental studies and<br />
probabilistic models, presentation<br />
of the predicted evolution on the<br />
digital map and on the evolution<br />
diagrams;<br />
- Application of the optimal<br />
solution, integrated for protection<br />
against floods;<br />
- Generation of alerts according to<br />
the alarming procedures.
<strong>REVISTA</strong> ROMÂNĂ <strong>DE</strong> AUTOMATICĂ<br />
11<br />
- On-line information and citizen<br />
education related to the effects of<br />
destroying the ecosystems, to the<br />
measures for civil protection in case of<br />
natural catastrophes.<br />
- Environment protection and sustainable<br />
development in zones with increased<br />
risk to natural disasters;<br />
- Creating the favorable conditions for<br />
integrating the national monitoring<br />
systems in the European informational<br />
system for hazards.<br />
The technological platform that will be<br />
created will allow the interactivity of the<br />
system, on line surveillance services on the<br />
digital map, predictions and control and will<br />
radically change the way of action in case of<br />
natural catastrophes according to the<br />
principles of sustainable management.<br />
Applying these facilities of the system to the<br />
flood risk management will reduce the lives and<br />
goods loses, will reduce the psychological stress<br />
in the crisis situations; will save the resources;<br />
will contribute to the education of the<br />
populations both for the environmental<br />
protection and for the efficient actions in<br />
emergency situations having implicit<br />
contribution to prolonging human life span.<br />
Using the new technologies for complex hazard<br />
risk management will allow new opportunities<br />
for specialization and improvement.<br />
Urban flooding and the implicitly diffuse<br />
pollution are complex phenomena, depending<br />
on random variables related to rainfalls,<br />
chemical and physical processes occurring on<br />
large areas. These phenomena have no<br />
administrative or juridical barriers, they<br />
transport pollutants on large distances; their<br />
sources are not always evident, as the<br />
affected areas can be significantly remote<br />
from the source. The solutions are neither<br />
easy nor cheap, and communities are often<br />
the other side of the problem, as the affected<br />
people demand that those who have created<br />
the problems, often located downstream at<br />
distances of tens of kilometers, should<br />
contribute to their solutions too. Due to their<br />
rapid development, often disregarding the<br />
existing environmental conditions, towns and<br />
cities have created a hardly controllable<br />
situation all over the country. The cumulative<br />
effects of the meteoric waters have a negative<br />
impact upon the development of urban<br />
communities. Even though various countries<br />
experience different stages of approaching<br />
this phenomenon, there is general consensus<br />
and experience exchange at various levels, in<br />
different professional governmental and nongovernmental<br />
organizations, both at<br />
professional and of environmental protection<br />
level. Efficient protection against floods is<br />
closely connected to the amount and quality<br />
of the information forecast before the<br />
dangerous weather phenomena occur, and<br />
also to the awareness the rules of exploiting<br />
the protection system for a large range of<br />
situations, and the ability of the protection<br />
system to respond. Even though all these<br />
conditions are met, the protection system has<br />
its own limitations determined by the design<br />
parameters. The proposed system is aimed at<br />
making the exploitation more efficient within<br />
its own limits, yet without removing the flood<br />
risk completely if the weather forecast<br />
information is highly uncertain.<br />
III. CONCLUSIONS<br />
The most important issues of the project are<br />
the efficient flood risk management in the<br />
urban areas, providing the support for the<br />
study and phenomenon prediction, correct<br />
and real time information of the people in<br />
charge and the population as well in order to<br />
reduce the damages and establishing the<br />
adequate strategies for rehabilitating the<br />
existing infrastructure.<br />
On-line flood risk management is a complex<br />
process, with high implications, which<br />
requires a multidisciplinary approach.<br />
Actual technology makes possible a high end<br />
solution for monitoring and evaluation of<br />
environment parameters decisional support<br />
for specialists involved in prevention actions<br />
of flooding consequences.<br />
Existent competencies within the project’s<br />
consortium will permit elaboration of<br />
Solutions for water flow regulations (lakes,<br />
rivers) situated along urban areas based on<br />
on-line data acquisition on long term time
12<br />
interval. Using them will contribute to risk<br />
reduction on floods in pilot zone, controlling<br />
water flows in lakes and rivers situated near<br />
city borders.<br />
The system’s portal will make data available<br />
to a large category of citizens, which will<br />
contribute to their information and education.<br />
<strong>REVISTA</strong> ROMÂNĂ <strong>DE</strong> AUTOMATICĂ<br />
REFERENCES<br />
[1] Fluvial flood forecasting for flood<br />
warning real time modeling,<br />
<strong>DE</strong>FRA/Environment Agency, 2005<br />
[2] Jia, J., Dyer, J.S. “A Standard Measure of<br />
Risk and Risk – Value Models. Working<br />
Paper No. 1, Risk – Value Study Series”,<br />
Department of Management<br />
[3] Brachinger, H.W., M. Weber “Risk as a<br />
Primitive: a Survey of Measures of<br />
Perceived Risk, ORSpektrum”, Spinger-<br />
Verlag, Berlin, 1997<br />
AR4-2.doc
<strong>REVISTA</strong> ROMÂNĂ <strong>DE</strong> AUTOMATICĂ<br />
13<br />
New Trends in the Web Evolution<br />
(The Emergence of the Web)<br />
Luigi Gabriel CERBAN, Alexandru BOTU, Adrian BADOIU<br />
SC <strong>IPA</strong> <strong>SA</strong>- Bucharest, Romania, luigi@ipa.ro<br />
Abstract: Predicting the future is always a dicey business, and never more so than when the subject is<br />
the Web. The Web has been evolving so quickly that some say one Web year is the equivalent of three real<br />
years. Progress in communication technology has been characterized by a movement from lower to<br />
higher levels of abstraction. The Semantic Web is not just for the World Wide Web. It represents a set of<br />
technologies that will work equally well on internal corporate intranets. This is analogous to Web<br />
services representing services not only across the Internet but also within a corporation's intranet. So, the<br />
Semantic Web will resolve several key problems facing current information technology architectures.<br />
Key words: The Semantic Web, Web of trust, Mobile Web<br />
I. INTRODUCTION<br />
II.<br />
WHAT IS THE SEMANTIC WEB?<br />
"The first step is putting data on the Web in a<br />
form that machines can naturally understand, or<br />
converting it to that form. This creates what I<br />
call a Semantic Web-a web of data that can be<br />
processed directly or indirectly by machines."[7]<br />
The future of the Web lies first with the<br />
convergence of the semantic Web, Web of trust<br />
and Web 2.0, followed by twinning with GRIDs.<br />
This e-infrastructure will allow more or less<br />
unlimited access to information, business<br />
processing, entertainment, education, research<br />
and so forth. [4]<br />
The Semantic Web provides a common<br />
framework that allows data to be shared and<br />
reused across application, enterprise, and<br />
community boundaries. Can think of the<br />
Semantic Web as an efficient way to<br />
represent data on the World Wide Web, or as<br />
a database that is globally linked, in a manner<br />
understandable by machines, to the content of<br />
documents on the Web. Semantic<br />
technologies represent meaning using<br />
ontologies and provide reasoning through the<br />
relationships, rules, logic, and conditions<br />
represented in those ontologies.<br />
It is a collaborative effort led by W3C with<br />
participation from a large number of researchers<br />
and industrial partners. It is based on the<br />
Resource Description Framework (RDF).<br />
Semantic Web aims to assist the web users to<br />
contribute information in ways that<br />
computers can understand, process and<br />
exchange. This will enable the web<br />
applications to perform tedious task of<br />
collating information from varied sources.<br />
And also assist users to find relevant<br />
information, such as, a movie review,<br />
scholarship posting for specific students, a<br />
book order, etc., quickly. The Semantic Web<br />
applications will use languages like Resource<br />
Description Framework (RDF), Extensible<br />
Markup Language (XML), XML Schema and<br />
RDF Vocabulary Description Language 1.0:<br />
RDF Schema (RDFS).<br />
Tim Berners-Lee, James Hendler and Ora<br />
Lassila unveiled a nascent vision of the<br />
Semantic Web: a highly interconnected<br />
network of data that could be easily accessed<br />
and understood by any desktop or handheld<br />
machine. [3] They painted a future of<br />
intelligent software agents that would head
14<br />
out on the World Wide Web and<br />
automatically book flights and hotels for our<br />
trips, update our medical records and give us<br />
a single, customized answer to a particular<br />
question without our having to search for<br />
information or pore through results. [3] They<br />
also presented the young technologies that<br />
would make this vision come true: a common<br />
language for representing data that could be<br />
understood by all kinds of software agents;<br />
ontologies-sets of statements-that translate<br />
information from disparate databases into<br />
common terms; and rules that allow software<br />
agents to reason about the information<br />
described in those terms. The data format,<br />
ontologies and reasoning software would<br />
operate like one big application on the World<br />
Wide Web, analyzing all the raw data stored<br />
in online databases as well as all the data<br />
about the text, images, video and<br />
communications the Web contained. Like the<br />
Web itself, the Semantic Web would grow in<br />
a grassroots fashion, only this time aided by<br />
working groups within the World Wide Web<br />
Consortium, which helps to advance the<br />
global medium.<br />
The Semantic Web is both achievable and<br />
desirable. We will lay out a clear path to the<br />
vision espoused by Tim Berners-Lee, the<br />
inventor of the Web. In general, semantics is<br />
the study of meaning. (The word "semantic"<br />
comes from the Greek semantikos, or<br />
"significant meaning," derived from sema, or<br />
"sign.") Semantic Web technologies help<br />
separate meanings from data, document<br />
content, or application code, using<br />
technologies based on open standards. If a<br />
computer understands the semantics of a<br />
document, it doesn't just interpret the series<br />
of characters that make up that document: it<br />
understands the document's meaning.<br />
The Semantic Web is a web of data. There is<br />
lots of data we all use every day, and its not<br />
part of the web. Can see my bank statements<br />
on the web, and my photographs, and can see<br />
my appointments in a calendar. But can see<br />
my photos in a calendar to see what was<br />
doing when I took them? Can see bank<br />
statement lines in a<br />
<strong>REVISTA</strong> ROMÂNĂ <strong>DE</strong> AUTOMATICĂ<br />
calendar? Why not? Because we don't have a<br />
web of data. Because data is controlled by<br />
applications, and each application keeps it to<br />
itself. The Semantic Web is about two things.<br />
It is about common formats for integration<br />
and combination of data drawn from diverse<br />
sources, where on the original Web mainly<br />
concentrated on the interchange of<br />
documents. It is also about language for<br />
recording how the data relates to real world<br />
objects. That allows a person, or a machine,<br />
to start off in one database, and then move<br />
through an unending set of databases which<br />
are connected not by wires but by being about<br />
the same thing. The following picture<br />
displays the progression of data along a<br />
continuum of increasing intelligence.<br />
Figure 1: The data progression<br />
Figure 1[1] shows four stages of the smart<br />
data continuum; however, there will be more<br />
fine-grained stages, as well as more followon<br />
stages. The four stages in the diagram<br />
progress from data with minimal smarts to<br />
data embodied with enough semantic<br />
information for machines to make inferences<br />
about it.<br />
Let's discuss each stage:<br />
Text and databases (pre-XML) [1] The<br />
initial stage where most data is proprietary to<br />
an application. Thus, the "smarts" are in the<br />
application and not in the data.<br />
XML documents for a single domain [1]<br />
The stage where data achieves application<br />
independence within a specific domain. Data<br />
is now smart enough to move between<br />
applications in a single domain. An example<br />
of this would be the XML standards in the<br />
healthcare industry, insurance industry, or<br />
real estate industry.
<strong>REVISTA</strong> ROMÂNĂ <strong>DE</strong> AUTOMATICĂ<br />
15<br />
Taxonomies and documents with mixed<br />
vocabularies [1] In this stage, data can be<br />
composed from multiple domains and<br />
accurately classified in a hierarchical<br />
taxonomy. In fact, the classification can be<br />
used for discovery of data. Simple<br />
relationships between categories in the<br />
taxonomy can be used to relate and thus<br />
combine data. Thus, data is now smart<br />
enough to be easily discovered and sensibly<br />
combined with other data.<br />
Ontologies and rules [1] In this stage, new<br />
data can be inferred from existing data by<br />
following logical rules.<br />
In essence, data is now smart enough to be<br />
described with concrete relationships, and<br />
sophisticated formalisms where logical<br />
calculations can be made on this "semantic<br />
algebra." This allows the combination and<br />
recombination of data at a more atomic level and<br />
very fine-grained analysis of data. Thus, in this<br />
stage, data no longer exists as a blob but as a part<br />
of a sophisticated microcosm. An example of<br />
this data sophistication is the automatic<br />
translation of a document in one domain to the<br />
equivalent (or as close as possible) document in<br />
another domain. Now, can compose a new<br />
definition of the Semantic Web:<br />
a machine-processable web of smart data[1].<br />
Furthermore, we can further define smart data<br />
as data that is application-independent,<br />
composeable, classified, and part of a larger<br />
information ecosystem (ontology).<br />
III. BENEFITS OF THE SEMANTIC<br />
WEB TO THE WORLD WI<strong>DE</strong> WEB<br />
The World Wide Web is the biggest<br />
repository of information ever created, with<br />
growing contents in various languages and<br />
fields of knowledge. But, in the long run, it is<br />
extremely difficult to make sense of this<br />
content. Search engines might help you find<br />
content containing specific words, but that<br />
content might not be exactly what you want.<br />
What is lacking? The search is based on the<br />
contents of pages and not the semantic<br />
meaning of the page's contents or information<br />
about the page.<br />
Once the Semantic Web exists, it can provide<br />
the ability to tag all content on the Web,<br />
describe what each piece of information is<br />
about and give semantic meaning to the<br />
content item. Thus, search engines become<br />
more effective than they are now, and users<br />
can find the precise information they are<br />
hunting. Organizations that provide various<br />
services can tag those services with meaning;<br />
using Web-based software agents, you can<br />
dynamically find these services on the fly and<br />
use them to your benefit or in collaboration<br />
with other services.<br />
IV. WEB OF TRUST<br />
Web is a collaborative medium that enables<br />
the individuals to contribute, access, and<br />
share contents. To further assist users to<br />
contribute more and to increase cooperation,<br />
W3C aims to develop a “Web of Trust”.<br />
Initiatives like Friend of a Friend (FOAF),<br />
RDF and XML signatures, etc, espouse the<br />
aim to achieve Web of Trust. Recently trust<br />
has been recognized as one of the main<br />
factors affecting electronic commerce.<br />
Information regarding a product, physical or<br />
online business acquired from either the user’s<br />
physical, or the online trusted social network<br />
impacts the user’s initial and subsequent levels<br />
of trust in an online business. The impact is<br />
directly associated with the user’s level of trust<br />
in the information source, in terms of source’s<br />
credibility, honesty and ability.<br />
V. WEB 2.0<br />
Web 2.0 is a trend in World Wide Web<br />
technology, and web design, a second<br />
generation of web-based communities and<br />
hosted services such as social-networking<br />
sites, wikis, blogs, and folksonomies, which<br />
aim to facilitate creativity, collaboration, and<br />
sharing among users. The term became<br />
notable after the first O'Reilly Media Web 2.0<br />
conference in 2004. Although the term<br />
suggests a new version of the World Wide<br />
Web, it does not refer to an update to any<br />
technical specifications, but to changes in the<br />
ways software developers and end-users use<br />
webs. According to Tim O'Reilly:
16<br />
"Web 2.0 is the business revolution in the<br />
computer industry caused by the move to the<br />
Internet as platform, and an attempt to<br />
understand the rules for success on that new<br />
platform."<br />
Web 2.0 websites allow users to do more than<br />
just retrieve information. They can build on the<br />
interactive facilities of "Web 1.0" to provide<br />
"Network as platform" computing, allowing<br />
users to run software-applications entirely<br />
through a browser. Users can own the data on a<br />
Web 2.0 site and exercise control over that data.<br />
These sites may have an "Architecture of<br />
participation" that encourages users to add value<br />
to the application as they use it. This stands in<br />
contrast to very old traditional websites, the sort<br />
which limited visitors to viewing and whose<br />
content only the site's owner could modify.<br />
Web 3.0 is a term used to describe the future<br />
of the World Wide Web. Following the<br />
introduction of the phrase "Web 2.0" as a<br />
description of the recent evolution of the<br />
Web, many technologists, journalists, and<br />
industry leaders have used the term "Web<br />
3.0" to hypothesize about a future wave of<br />
Internet innovation.<br />
The Mobile web is a W3C Initiative. The<br />
Mobile Web refers to the World Wide Web<br />
as accessed from mobile devices such as cell<br />
phones, PDAs, and other portable gadgets<br />
connected to a public network. Access does<br />
not require a desktop computer. However,<br />
Mobile Web access today still suffers from<br />
interoperability and usability problems. This<br />
is partly due to the small physical size of the<br />
screens of mobile devices and partly due to<br />
the incompatibility of many mobile devices<br />
with not only computer operating systems,<br />
but also the format of much of the<br />
information available on the Internet.<br />
VI.<br />
APPLICATIONS OF THE<br />
SEMANTIC WEB TO E-BUSINESS<br />
"The business market for this integration of<br />
data and programs is huge… The companies<br />
who choose to start exploiting Semantic Web<br />
technologies will be the first to reap the<br />
rewards." [10] To develop and sustain<br />
<strong>REVISTA</strong> ROMÂNĂ <strong>DE</strong> AUTOMATICĂ<br />
competitive advantage in the marketplace,<br />
organizations depend critically on<br />
competence and resources, knowledge and<br />
information exchanged both within and<br />
across partner organizations, and on process<br />
integration and management. Semantic Web<br />
Technologies and E-Business: Toward the<br />
Integrated Virtual Organization and Business<br />
Process Automation [9] presents research<br />
related to the application of semantic Web<br />
technologies, including semantic serviceoriented<br />
architecture, semantic content<br />
management, and semantic knowledge<br />
sharing in e-business processes. Semantic<br />
Web Technologies and E-Business: Toward<br />
the Integrated Virtual Organization and<br />
Business Process Automation[9] compiles<br />
research from experts around the globe,<br />
bringing business, managerial, technological,<br />
and implementation issues surrounding the<br />
application of semantic Web technologies in<br />
e-business to the forefront.<br />
The Semantic Web is starting to show its<br />
practical benefits and one key application<br />
domain, where it can show its potential with<br />
great impact, is E-Business. The main<br />
opportunities are anticipated in information<br />
systems interoperation and range from inter<br />
to intra-organizational links. For instance,<br />
one of the main promises is that the Semantic<br />
Web can help develop a webbed economy<br />
where, in spontaneous inter-organizational<br />
relations, the involved parties share data and<br />
integrate their internal business processes in a<br />
transparent and trustful way. [8]. In<br />
knowledge-based economy, businesses<br />
succeed or fail based on how well they are<br />
able to share knowledge and information to<br />
effectively respond to the changing demands<br />
in the marketplace. [9] The Semantic Web<br />
technology brings to the business world a set<br />
of tools that will help in the development of<br />
meaningful shared vocabulary or ontologies<br />
leading to standardization of terms and<br />
concepts related to the descriptions of<br />
products, processes, and coordination<br />
mechanisms both within and across<br />
enterprises. This will lead to the development<br />
of effective knowledge management systems<br />
that are tightly integrated to the business
<strong>REVISTA</strong> ROMÂNĂ <strong>DE</strong> AUTOMATICĂ<br />
17<br />
processes that they are designed to support.<br />
The Semantic Web reaches stability in its<br />
lower layers with the existence of standards<br />
and the upcoming availability of basic<br />
technologies and trialed applications. Still,<br />
the success of the Semantic Web depends on<br />
its capability to deploy in a commercial<br />
setting.<br />
VII. CONCLUSION<br />
Views on the next stage of the World Wide<br />
Web's evolution vary greatly. Some believe that<br />
emerging technologies such as the Semantic<br />
Web will transform the way the Web is used,<br />
and lead to new possibilities in artificial<br />
intelligence. Other visionaries suggest that<br />
increases in Internet connection speeds, modular<br />
web applications, or advances in computer<br />
graphics will play the key role in the evolution<br />
of the World Wide Web.<br />
In this article, you went through the core<br />
standards that make up the Semantic Web's<br />
technologies and learned why organizations<br />
might want to adopt those technologies. With<br />
Semantic Web technologies, organizations<br />
can provide a single, unified view of data<br />
across their applications, which allows for<br />
precise retrieval of information, simplifies<br />
enterprise and SOA integration, reduces data<br />
redundancy, and provides uniform semantic<br />
meaning across applications. All this eases<br />
development, maintenance, and upgrades<br />
across the enterprise.<br />
REFERENCES<br />
[1] Michael C. Daconta, Leo J. Obrst and<br />
Kevin T. Smith, The Semantic Web: A<br />
Guide to the Future of XML, Web<br />
Services, and Knowledge Management ,<br />
ISBN: 0471432571 John Wiley & Sons<br />
© 2003 (281 pages)<br />
[2] Naveen Balani, Ontologies form the<br />
backbone of a whole new way to<br />
understand online data, Technical<br />
Architect, Webify Solutions 18 Oct 2005<br />
[3] Lee Feigenbaum, Ivan Herman, Tonya<br />
Hongsermeier, Eric Neumann and<br />
Susie Stephens, The Semantic Web in<br />
Action; December 2007; Scientific<br />
American Magazine;<br />
[4] The Future WEB, ERCIM News, No.<br />
72, January 2008<br />
[5] *** http://www.w3.org/2001/sw/<br />
[6] ***<br />
http://www.waset.org/pwaset/v18/v18-<br />
24.pdf<br />
[7] Tim Berners-Lee, Weaving the Web,<br />
Harper San Francisco, 1999<br />
[8] Dr. Roberto García, Semantic Web<br />
Methodologies for E-Business<br />
Applications: Ontologies, Processes and<br />
Management Practices, edited by,<br />
Universitat de Lleida, Spain<br />
[9] A. F. Salam, Jason R. Steven, Semantic<br />
Web Technologies and E-Business:<br />
Toward the Integrated Virtual<br />
Organization and Business Process<br />
Automation (Hardcover)<br />
[10] James Hendler, Tim Berners-Lee, and<br />
Eric Miller, "Integrating Applications<br />
on the Semantic Web"<br />
AR4-3.doc
18<br />
<strong>REVISTA</strong> ROMÂNĂ <strong>DE</strong> AUTOMATICĂ<br />
ASSESSING THE TECHNOLOGICAL PROCESS AND ENVIRONMENTAL<br />
IMPACT OF ASPHALT PRODUCTION PLANTS<br />
Eng. Mihai BARBOS, Eng. Constantin CRISTESCU<br />
SC <strong>IPA</strong> <strong>SA</strong> Bucharest<br />
Eng. Emil ROBILA, Eng. Ion TILICA<br />
SC Miteco <strong>SA</strong>, Iasi, Romania<br />
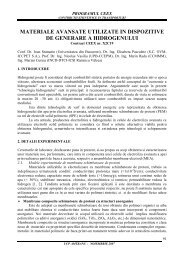
Abstract: An asphalt plant is a plant used for the manufacture of asphalt, macadam and other forms of<br />
coated roadstone, sometimes collectively known as blacktop. The manufacture of coated roadstone<br />
demands the combination of a number of aggregates, sand and a filler (such as stone dust), in the correct<br />
proportions, heated, and finally coated with a binder, usually bitumen based or, in some cases, tar.<br />
Increasingly, recycled asphalt pavement (RAP) is used as part of the mix. Hot mix asphalt (HMA) paving<br />
materials can be manufactured by: (1) batch mix plants, (2) continuous mix (mix outside dryer drum)<br />
plants, (3) parallel flow drum mix plants, and (4) counterflow drum mix plants. This order of listing<br />
generally reflects the chronological order of development and use within the HMA industry. Production<br />
of hot mix asphalt paving materials for large contracts has generally a considerable negative impact on<br />
the environment caused by resulted higly poluting factors. This article will offer a synthetic analysis of<br />
technological processes used with different types of asphalt production plants dealing also with the<br />
environmental impact of the resulting pollution factors involved.<br />
Key words: automation system, process flow, asphalt mixtures, drying, weighing,<br />
I. GENERAL<br />
Hot mix asphalt (HMA) paving materials are<br />
a mixture of size-graded, high quality<br />
aggregate (which can include reclaimed<br />
asphalt pavement [RAP]), and liquid asphalt<br />
cement, which is heated and mixed in<br />
measured quantities to produce HMA.<br />
Aggregate and RAP (if used) constitute over<br />
92 percent by weight of the total mixture.<br />
Aside from the amount and grade of asphalt<br />
cement used, mix characteristics are<br />
determined by the relative amounts and types<br />
of aggregate and RAP used. A certain<br />
percentage of fine aggregate (less than 74<br />
micrometers [µm] in physical diameter) is<br />
required for the production of good quality<br />
HMA.<br />
Hot mix asphalt (HMA) paving materials can<br />
be manufactured by: (1) batch mix plants, (2)<br />
continuous mix (mix outside dryer drum)<br />
plants, (3) parallel flow drum mix plants, and<br />
(4) counterflow drum mix plants. About 85%<br />
of plants being manufactured today are of the<br />
counterflow drum mix design, while batch<br />
plants and parallel flow drum mix plants<br />
account for 10% and 5% percent respectively.<br />
Continuous mix plants represent a very small<br />
fraction of the plants in use (
<strong>REVISTA</strong> ROMÂNĂ <strong>DE</strong> AUTOMATICĂ<br />
19<br />
II. GENERAL PROCESS FLOW FOR<br />
DIFERENT TYPES OF HOT MIX<br />
ASPHALT PAVING MATERIALS<br />
PRODUCTION PLANTS<br />
Batch Mix Plants<br />
Figure 1 shows the batch mix HMA<br />
production process. Raw aggregate<br />
normally is stockpiled near the production<br />
unit. The bulk aggregate moisture content<br />
typically stabilizes between 3 to 5 percent<br />
by weight.<br />
Processing begins as the aggregate is hauled<br />
from the storage piles and is placed in the<br />
appropriate hoppers of the cold feed unit.<br />
The material is metered from the hoppers<br />
onto a conveyer belt and is transported into<br />
a rotary dryer (typically gas- or oil-fired).<br />
Dryers are equipped with flights designed<br />
to shower the aggregate inside the drum to<br />
promote drying efficiency.<br />
As the hot aggregate leaves the dryer, it<br />
drops into a bucket elevator and is<br />
transferred to a set of vibrating screens,<br />
where it is classified into as many as four<br />
different grades (sizes) and is dropped into<br />
individual “hot” bins according to size. At<br />
newer facilities, RAP also may be<br />
transferred to a separate heated storage bin.<br />
To control aggregate size distribution in the<br />
final batch mix, the operator opens various<br />
hot bins over a weigh hopper until the<br />
desired mix and weight are obtained.<br />
Concurrent with the aggregate being<br />
weighed, liquid asphalt cement is pumped<br />
from a heated storage tank to an asphalt<br />
bucket, where it is weighed to achieve the<br />
desired aggregate-to-asphalt cement ratio in<br />
the final mix.<br />
The aggregate from the weigh hopper is<br />
dropped into the mixer (pug mill) and drymixed<br />
for 6 to 10 seconds. The liquid<br />
asphalt is then dropped into the pug mill<br />
where it is mixed for an additional period of<br />
time. At older plants, RAP typically is<br />
conveyed directly to the pug mill from<br />
storage hoppers and combined with the hot<br />
aggregate. Total mixing time usually is less<br />
than 60 seconds. Then the hot mix is<br />
conveyed to a hot storage silo or is dropped<br />
directly into a truck and hauled to the job site.<br />
Parallel Flow Drum Mix Plants<br />
Figure 2 shows the parallel flow drum mix<br />
process. This process is a continuous mixing<br />
type process, using proportioning cold feed<br />
controls for the process materials. The major<br />
difference between this process and the batch<br />
process is that the dryer is used not only to dry<br />
the material but also to mix the heated and<br />
dried aggregates with the liquid asphalt cement.<br />
Aggregate, which has been proportioned by<br />
size gradations, is introduced to the drum at the<br />
burner end. As the drum rotates, the aggregates,<br />
as well as the combustion products, move<br />
toward the other end of the drum in parallel.<br />
Liquid asphalt cement flow is controlled by a<br />
variable flow pump electronically linked to the<br />
new (virgin) aggregate and<br />
RAP weigh scales. The asphalt cement is<br />
introduced in the mixing zone midway down<br />
the drum in a lower temperature zone, along<br />
with any RAP and particulate matter (PM) from<br />
collectors.<br />
The mixture is discharged at the end of the<br />
drum and is conveyed to either a surge bin or<br />
HMA storage silos, where it is loaded into<br />
transport trucks. The exhaust gases also exit the<br />
end of the drum and pass on to the collection<br />
system.<br />
Parallel flow drum mixers have an advantage,<br />
in that mixing in the discharge end of the drum<br />
captures a substantial portion of the aggregate<br />
dust, therefore lowering the load on the<br />
downstream PM collection equipment. For this<br />
reason, most parallel flow drum mixers are<br />
followed only by primary collection equipment<br />
(usually a baghouse or venturi scrubber).<br />
However, because the mixing of aggregate and<br />
liquid asphalt cement occurs in the hot<br />
combustion product flow, organic emissions<br />
(gaseous and liquid aerosol) may be greater<br />
than in other asphalt mixing processes. Because<br />
data are not available to distinguish significant<br />
emissions differences between the two process<br />
designs, this effect on emissions cannot be<br />
verified.
20<br />
<strong>REVISTA</strong> ROMÂNĂ <strong>DE</strong> AUTOMATICĂ<br />
Figure 1.General process flow diagram for batch mix asphalt plants<br />
Figure 2.General process flow diagram for parallel-flow drum mix asphalt plants<br />
Figure 3.General process flow diagram for counter-flow drum mix asphalt plants
<strong>REVISTA</strong> ROMÂNĂ <strong>DE</strong> AUTOMATICĂ<br />
21<br />
Counter-flow Drum Mix Plants<br />
Figure 3 shows a counter-flow drum mix<br />
plant. In this type of plant, the material flow<br />
in the drum is opposite or counter-flow to the<br />
direction of exhaust gases. In addition, the<br />
liquid asphalt cement mixing zone is located<br />
behind the burner flame zone so as to remove<br />
the materials from direct contact with hot<br />
exhaust gases. Liquid asphalt cement flow is<br />
controlled by a variable flow pump which is<br />
electronically linked to the virgin aggregate<br />
and RAP weigh scales. It is injected into the<br />
mixing zone along with any RAP and<br />
particulate matter from primary and<br />
secondary collectors. Because the liquid<br />
asphalt cement, virgin aggregate, and RAP<br />
are mixed in a zone removed from the<br />
exhaust gas stream, counter-flow drum mix<br />
plants will likely have organic emissions<br />
(gaseous and liquid aerosol) that are lower<br />
than parallel flow drum mix plants. However,<br />
the available data are insufficient to discern<br />
any differences in emissions that result from<br />
differences in the two processes. A counterflow<br />
drum mix plant can normally process<br />
RAP at ratios up to 50% with little or no<br />
observed effect upon emissions.<br />
Something about the recycle processes<br />
In recent years, the use of RAP has been<br />
initiated in the HMA industry. Reclaimed<br />
asphalt pavement significantly reduces the<br />
amount of virgin rock and asphalt cement<br />
needed to produce HMA. In the reclamation<br />
process, old asphalt pavement is removed<br />
from the road base. This material is then<br />
transported to the plant, and is crushed and<br />
screened to the appropriate size for further<br />
processing. The paving material is then<br />
heated and mixed with new aggregate (if<br />
applicable), and the proper amount of new<br />
asphalt cement is added to produce HMA that<br />
meets the required quality specifications.<br />
III. EMISSIONS AND CONTROLS<br />
Emissions from HMA plants may be divided<br />
into ducted production emissions, preproduction<br />
fugitive dust emissions, and other<br />
production-related fugitive emissions. Pre-<br />
production fugitive dust sources associated<br />
with HMA plants include vehicular traffic<br />
generating fugitive dust on paved and<br />
unpaved roads, aggregate material handling,<br />
and other aggregate processing operations.<br />
Fugitive dust may range from 0.1 µm to more<br />
than 300 µm in aerodynamic diameter. On<br />
average, 5 percent of cold aggregate feed is<br />
less than 74 µm (minus 200 mesh). Fugitive<br />
dust that may escape collection before<br />
primary control generally consists of PM with<br />
50% to 70% of the total mass less than 74<br />
µm. Production related fugitive emissions<br />
and emissions from ducted production<br />
operations are discussed below. Emission<br />
points discussed below refer to figure 1 for<br />
batch mix asphalt plants and to figures 2 and<br />
3 for drum mix plants.<br />
Emission factors for Batch Mix Plants<br />
As with most facilities in the mineral<br />
products industry, batch mix HMA plants<br />
have two major categories of emissions:<br />
ducted sources (those vented to the<br />
atmosphere through some type of stack, vent,<br />
or pipe), and fugitive sources (those not<br />
confined to ducts and vents but emitted<br />
directly from the source to the ambient air).<br />
Ducted emissions are usually collected and<br />
transported by an industrial ventilation<br />
system having one or more fans or air<br />
movers, eventually to be emitted to the<br />
atmosphere through some type of stack.<br />
Fugitive emissions result from process and<br />
open sources and consist of a combination of<br />
gaseous pollutants and PM.<br />
The most significant ducted source of emissions<br />
of most pollutants from batch mix HMA plants is<br />
the rotary drum dryer. The dryer emissions<br />
consist of water (as steam evaporated from the<br />
aggregate); PM; products of combustion (carbon<br />
dioxide [CO 2 ], nitrogen oxides [NO x ], and sulfur<br />
oxides [SO x ]); carbon monoxide (CO); and small<br />
amounts of organic compounds of various species<br />
(including volatile organic compounds [VOC],<br />
methane [CH 4 ], and hazardous air pollutants<br />
[HAP]). The CO and organic compound<br />
emissions result from incomplete combustion of<br />
the fuel. It is estimated that between 70% and<br />
90% of the energy used at HMA plants is from<br />
the combustion of natural gas.
22<br />
Other potential process sources include the<br />
hot-side conveying, classifying, and mixing<br />
equipment, which are vented either to the<br />
primary dust collector (along with the dryer<br />
gas) or to a separate dust collection system.<br />
The vents and enclosures that collect<br />
emissions from these sources are commonly<br />
called “fugitive air” or “scavenger” systems.<br />
The scavenger system may or may not have<br />
its own separate air mover device, depending<br />
on the particular facility. The emissions<br />
captured and transported by the scavenger<br />
system are mostly aggregate dust, but they<br />
may also contain gaseous organic compounds<br />
and a fine aerosol of condensed organic<br />
particles. This organic aerosol is created by<br />
the condensation of vapor into particles<br />
during cooling of organic vapors volatilized<br />
from the asphalt cement in the mixer (pug<br />
mill). The amount of organic aerosol<br />
produced depends to a large extent on the<br />
temperature of the asphalt cement and<br />
aggregate entering the pug mill. Organic<br />
vapor and its associated aerosol also are<br />
emitted directly to the atmosphere as process<br />
fugitives during truck load-out, from the bed<br />
of the truck itself during transport to the job<br />
site, and from the asphalt storage tank. Both<br />
the low molecular weight organic compounds<br />
and the higher weight organic aerosol contain<br />
small amounts of HAP. The ducted emissions<br />
from the heated asphalt storage tanks include<br />
gaseous and aerosol organic compounds and<br />
combustion products from the tank heater.<br />
The choice of applicable emission controls<br />
for PM emissions from the dryer and vent<br />
line includes dry mechanical collectors,<br />
scrubbers, and fabric filters. Attempts to<br />
apply electrostatic precipitators have met<br />
with little success. Practically all plants use<br />
primary dust collection equipment such as<br />
large diameter cyclones, skimmers, or settling<br />
chambers. These chambers often are used as<br />
classifiers to return collected material to the<br />
hot elevator and to combine it with the drier<br />
aggregate. To capture remaining PM, the<br />
primary collector effluent is ducted to a<br />
secondary collection device. Most plants use<br />
either a fabric filter or a venturi scrubber for<br />
secondary emissions control. As with any<br />
combustion process, the design, operation,<br />
<strong>REVISTA</strong> ROMÂNĂ <strong>DE</strong> AUTOMATICĂ<br />
and maintenance of the burner provides<br />
opportunities to minimize emissions of NO x ,<br />
CO, and organic compounds.<br />
Emission factors for Parallel Flow Drum Mix<br />
Plants<br />
The most significant ducted source of<br />
emissions from parallel-flow drum mix plants<br />
is the rotary drum dryer. Emissions from the<br />
drum consist of water (as steam evaporated<br />
from the aggregate); PM; products of<br />
combustion; CO; and small amounts of<br />
organic compounds of various species<br />
(including VOC, CH 4 , and HAP). The<br />
organic compound and CO emissions result<br />
from incomplete combustion of the fuel and<br />
from heating and mixing of the liquid asphalt<br />
cement inside the drum. Although it has been<br />
suggested that the processing of RAP<br />
materials at these type plants may increase<br />
organic compound emissions because of an<br />
increase in mixing zone temperature during<br />
processing, the data supporting this<br />
hypothesis are very weak. Specifically,<br />
although the data show a relationship only<br />
between RAP content and condensable<br />
organic particulate emissions, 89% of the<br />
variations in the data were the result of other<br />
unknown process variables.<br />
Once the organic compounds cool after<br />
discharge from the process stack, some<br />
condense to form a fine organic aerosol or<br />
“blue smoke” plume. A number of process<br />
modifications or restrictions have been<br />
introduced to reduce blue smoke, including<br />
installation of flame shields, rearrangement of<br />
flights inside the drum, adjustments of the<br />
asphalt injection point, and other design<br />
changes.<br />
Emission factors for Counter-flow Drum Mix<br />
Plants<br />
The most significant ducted source of<br />
emissions from counter-flow drum mix plants<br />
is the rotary drum dryer. Emissions from the<br />
drum consist of water (as steam evaporated<br />
from the aggregate); PM; products of<br />
combustion; CO; and small amounts of<br />
organic compounds of various species<br />
(including VOC, CH4, and HAP). The CO
<strong>REVISTA</strong> ROMÂNĂ <strong>DE</strong> AUTOMATICĂ<br />
23<br />
and organic compound emissions result<br />
primarily from incomplete combustion of the<br />
fuel, and can also be released from the heated<br />
asphalt. Liquid asphalt cement, aggregate,<br />
and sometimes RAP, are mixed in a zone not<br />
in contact with the hot exhaust gas stream. As<br />
a result, kiln stack emissions of organic<br />
compounds from counter-flow drum mix<br />
plants may be lower than parallel flow drum<br />
mix plants. However, variations in the<br />
emissions due to other unknown process<br />
variables are more significant. As a result, the<br />
emission factors for parallel flow and<br />
counter-flow drum mix plants are the same.<br />
IV. CONCLUSIONS<br />
The general process flow of hot mix asphalt<br />
paving materials production plants leads to<br />
the ecrease of major poluting factors.<br />
Emissions from HMA plants may be divided<br />
into ducted production emissions, preproduction<br />
fugitive dust emissions, and other<br />
production-related fugitive emissions. In<br />
order to limit emissions of HMA plants<br />
precise control is a necessity. This can be<br />
achieved by implementing dedicated<br />
monitoring and control systems based on<br />
using a combination of industrial computer<br />
control and programmable logic controllers.<br />
Therefore an increased necessity for newer<br />
and better automation systems dedicated to<br />
limiting the pollution factors in asphalt<br />
production plants is a must.<br />
V. REFERENCES<br />
[1] V. P. Puzinauskas and L. W. Corbett,<br />
Report On Emissions From Asphalt Hot<br />
Mixes, RR-75-1A, The Asphalt Institute,<br />
College Park, MD, May 1975.<br />
[2] J. A. Peters and P. K. Chalekode,<br />
“Assessment Of Open Sources”, Presented At<br />
The Third National Conference On Energy<br />
And The Environment, College Corner, OH,<br />
October 1, 1975.<br />
[3] J. S. Kinsey, “An Evaluation of Control<br />
Systems and Mass Emission Rates from<br />
Dryer Drum Hot Asphalt Plants”, Journal<br />
of the Air Pollution Control Association,<br />
26(12):1163-1165, December 1976.<br />
[4] Emission Factor Documentation For AP-<br />
42 Section 11.1, Hot Mix Asphalt Production.<br />
S. Environmental Protection Agency,<br />
Research Triangle Park, NC, December 2000.<br />
[5] Hot Mix Asphalt Mixing Facilities,<br />
Kathryn O’C. Gunkel, Wildwood<br />
Environmental Engineering Consultants, Inc.<br />
[6] Emission Of Volatile Organic<br />
Compounds From Drum Mix Asphalt Plants,<br />
EPA-600/2-81-026,U. S. Environmental<br />
Protection Agency, Washington, DC,<br />
February 1981.<br />
AR4-4.doc
24<br />
<strong>REVISTA</strong> ROMÂNĂ <strong>DE</strong> AUTOMATICĂ<br />
MECHANICAL SYSTEM FOR COUPLING<br />
THE THERMAL AND ELECTRIC POWER SOURCES<br />
Dinel POPA<br />
University of Pitesti, ROMANIA, dinel_popa@yahoo.com<br />
Nicolae PANDREA<br />
University of Pitesti, ROMANIA, nicolae_pandrea37@yahoo.com<br />
Abstract: In this paper is presented one solution for coupling the power sources. Are made the<br />
movement differential equations for the planetary mechanisms with two degrees of mobility and by using<br />
them the movement is studied. For the permanent movement is studied the mechanisms frequently used<br />
and then is studied the movement stability.<br />
Keywords: power source, hybrid drive, permanent movement.<br />
1. INTRODUCTION<br />
The hybrid automobiles haulage is made with<br />
a heat engine (MT) and an electric engine<br />
(ME) that is powered to a battery of a high<br />
tension accumulation.<br />
The battery is charged from an electric<br />
generator that is powered by the heat engine.<br />
The power sources can be coupled through a<br />
planetary mechanism with two degrees of<br />
mobility. The general draw of such a system<br />
is presented in fig. 1.<br />
1<br />
z" 4<br />
O<br />
4<br />
A<br />
O1 O 3 O 2<br />
3<br />
z' 4<br />
B<br />
2<br />
z 3<br />
z 2<br />
BA<br />
M T G E M E<br />
Fig. 1. The planetary mechanism.<br />
2. MOVEMENT DIFFERENTIAL<br />
EQUATION OF THE COUPLING<br />
SYSTEM<br />
One considered the notations: J i , = 1, 2, 3, 4<br />
axial moments of inertia of the elements<br />
marked with 1, 2, 3, 4; m 4 , weight of the<br />
satellites 4; R 4 , the length of the port-satellite<br />
' "<br />
1; z 2 , z3,<br />
z4,<br />
z4<br />
the number of teeth of the tooth<br />
wheels; i 1 , i the equations defined by the<br />
relations<br />
2<br />
1 ;<br />
'<br />
z4<br />
"<br />
2z4<br />
'<br />
3z4<br />
i ,<br />
z z<br />
i = i = ; (1)<br />
z<br />
- A, B, C, parameters inertial parameters<br />
defined by the relations<br />
2<br />
( 1+<br />
i1<br />
) J 4 + ( − i) J 3<br />
2<br />
1 + m4R<br />
+ 1<br />
A = J<br />
;<br />
( 1−<br />
i) iJ 3 + J 4 ( 1 i 1 ) i 1<br />
2 2<br />
B = −<br />
+ ; C = J + J i + J ; (2)<br />
2 3 4i1<br />
θ 1 , θ2,<br />
θ3<br />
the rotation angles of the elements 1,<br />
2, 3; ω 1 , ω2,<br />
ω3,<br />
ω4<br />
the absolute angular<br />
velocities of the elements 1, 2, 3, 4;<br />
M 1 , M 2 , M 3 moments that act on the elements<br />
1, 2, 3.<br />
The kinetic energy and the generalized<br />
forces. Using the Willis method one read the<br />
relations
<strong>REVISTA</strong> ROMÂNĂ <strong>DE</strong> AUTOMATICĂ<br />
25<br />
ω4<br />
− ω1<br />
z ω3<br />
− ω<br />
= − ;<br />
ω − ω z ω − ω<br />
2<br />
1<br />
2<br />
'<br />
4<br />
4<br />
1<br />
1<br />
"<br />
4<br />
z<br />
= −<br />
z<br />
3<br />
.<br />
(3)<br />
from which, with the notations (1) he or she<br />
deduced the equalities:<br />
ω 3 = ω1<br />
( 1−<br />
i) + ω2i<br />
; ω 4 = ω1( 1+<br />
i1<br />
) + ω2i1<br />
. (4)<br />
The kinetic energy of the system:<br />
1 2<br />
2 2 2 2 2<br />
E C = ( J1ω1<br />
+ m4R<br />
ω1<br />
+ J2ω2<br />
+ J3ω3<br />
+ J4ω4)<br />
. (5)<br />
2<br />
with the notations (4) and (2) has the<br />
equation:<br />
2<br />
2<br />
( Aθ&<br />
− Bθ&<br />
θ&<br />
+ Cθ<br />
)<br />
1<br />
E = 1 2 &<br />
C 1 2 2 . (6)<br />
2<br />
The mechanic power at a certain time is given<br />
by:<br />
P = M<br />
M , (7)<br />
1ω1<br />
+ M 2ω2<br />
+ 3ω3<br />
or on the basis of the other relation (4)<br />
[ M1 + M 3( 1−<br />
i)<br />
] ω1<br />
+ ( M 2 + M3<br />
) ω2<br />
P = i<br />
(8)<br />
and from here are deduced the generalized<br />
equations:<br />
Q1 = M1<br />
+ M3 (1 − i)<br />
; Q2 = M 2 + M3i<br />
. (9)<br />
Lagrange equations. Knowing the fact that<br />
ω 1 = θ & 1 ; ω 2 = θ& 2 , (10)<br />
3. THE MOVEMENTS STUDY<br />
Permanent movement. The permanent<br />
movement is deduced from the conditions<br />
ω 1 = 0;<br />
2 = 0<br />
ω , (13)<br />
that leads to these equations<br />
[ 1 + M3( 1−<br />
i)<br />
] C + ( M 2 + M3i)<br />
B = 0<br />
[ + M 1−<br />
i)<br />
] B + ( M + M i)<br />
A 0<br />
M ;<br />
M (14)<br />
1 3( 2 3 =<br />
and since AC − B 2 > 0 , we obtained the<br />
equations<br />
M + M − i)<br />
0 ; M + M i 0 . (15)<br />
1 3 (1 =<br />
2 3 =<br />
The sources of power are present by the<br />
characteristics movement-angularly speed<br />
through the relations Mi = M i ( ωi<br />
) and goes to<br />
* * *<br />
the values: ω 1 , ω 2 , ω 3 of the angularly<br />
velocities that are obtained the permanent<br />
condition that are deduced from the equation<br />
system:<br />
*<br />
*<br />
*<br />
*<br />
M ( ω ) + (1 − i)<br />
M ( ω ) 0 ; M ( ω ) + i M ( ω ) 0 ;<br />
ω<br />
1 1<br />
3 3 =<br />
*<br />
* *<br />
3 = ( 1−<br />
) ω1<br />
+ iω2<br />
2 2 3 3 =<br />
i . (16)<br />
If these values M ( * 2 ω 2)<br />
, M ( * 3 ω 3 ) are related to<br />
the value of the moment M ( * 1 ω 1)<br />
of the heat<br />
engine, one obtained the relations (17) with<br />
the graphic representations captured in figure<br />
2 and figure 3.<br />
M 2 ( ω ) i<br />
= −<br />
*<br />
M ( ω ) i −1<br />
1<br />
*<br />
2<br />
1<br />
;<br />
M 3 ( ω ) 1<br />
= −<br />
*<br />
M ( ω ) i −1<br />
1<br />
*<br />
3<br />
1<br />
, (17)<br />
from Lagrange equations are obtained the<br />
differential equations<br />
ω &<br />
1 − Bω&<br />
2 = M1<br />
+ M 3( 1−<br />
i);<br />
− Bω&<br />
1 + Cω&<br />
2 = M 2 + M i ,<br />
A 3<br />
or<br />
ω&<br />
1<br />
ω&<br />
2<br />
=<br />
=<br />
[ M + M ( 1−<br />
i)<br />
] C + ( M + M i)<br />
1<br />
[ M − M ( 1−<br />
i)<br />
] B + ( M + M i)<br />
1<br />
3<br />
3<br />
AC − B<br />
2<br />
AC − B<br />
2<br />
2<br />
2<br />
3<br />
3<br />
B<br />
;<br />
A<br />
.<br />
(11)<br />
(12)
26<br />
<strong>REVISTA</strong> ROMÂNĂ <strong>DE</strong> AUTOMATICĂ<br />
*<br />
M 2(<br />
ω2)<br />
*<br />
M1(<br />
ω1<br />
)<br />
4<br />
*<br />
M 2 ( ω2)<br />
*<br />
M1(<br />
ω1<br />
)<br />
3<br />
3<br />
2<br />
2<br />
-4<br />
-3 -2<br />
1<br />
-1<br />
1<br />
-4 -3 -2 -1<br />
-1<br />
1<br />
2 3 4 5<br />
i<br />
-1<br />
1<br />
2<br />
3<br />
4<br />
5<br />
i<br />
-2<br />
-2<br />
-3<br />
-3<br />
-4<br />
-4<br />
Fig. 2. Graphic<br />
M 2 ( ω ) i<br />
= − . Fig. 3. Graphic<br />
*<br />
M ( ω ) i −1<br />
1<br />
*<br />
2<br />
1<br />
M 3 ( ω ) 1<br />
= − .<br />
*<br />
M ( ω ) i −1<br />
1<br />
*<br />
3<br />
1<br />
The displacement moment M ( * 2 ω 2)<br />
, because<br />
the resistant moment is negative, it follows<br />
that the transmission equation i will be from<br />
the domain ( −∞ ,0) ∪ (1, ∞)<br />
.<br />
If i < 0 the values<br />
| M 2(<br />
ω2)<br />
| | M ( ) |<br />
, 3 ω<br />
*<br />
*<br />
M ( ω ) M ( ω )<br />
1<br />
1<br />
1<br />
*<br />
3<br />
1<br />
are subunitary,<br />
if this 1 < i < 2 is over-unitary and this<br />
2 < i the first value is over-unitary and the<br />
second one is sub-unitary.<br />
In conclusion, for the solution where the<br />
values of the resistant moment are low then<br />
we’ll chose i < 0 and for the case when the<br />
resistant moment at the automobiles wheels<br />
are high will be obtained the solution i > 2 .<br />
*<br />
The movements stability. The solution ω 1 ,<br />
*<br />
ω , ω is obtained from the (16) system and<br />
*<br />
2<br />
3<br />
*<br />
it is stabile even if Ωi = ωi<br />
0 − ωi<br />
, i = 1, 2, 3 are<br />
going through zero. In this way will be<br />
studied the stability after the first<br />
approximation. Are obtained the linear<br />
approximations:<br />
*<br />
*<br />
*<br />
M ( ω + Ω ) = M ( ω ) + Ω M ( ) ,<br />
1 1 1 1 1 1 1p<br />
ω1<br />
* * *<br />
2 2 2 2 2 2 2 p ω 2<br />
M ( ω +Ω ) = M ( ω ) +Ω M ( ) ,<br />
*<br />
M ( ω + Ω ) = M ( ω ) + Ω M ( ) (18)<br />
* *<br />
3 3 3 3 3 3 3 p ω 3<br />
where by<br />
M ip were noted the functions<br />
derivates M ( * i ω i ) .<br />
By replacing the equations (12) and taking<br />
into account the notations<br />
α =<br />
AC − B<br />
i 1−<br />
i)<br />
β =<br />
*<br />
2<br />
[ M ( ω ) + (1 − i)<br />
M ( ω )]<br />
1 *<br />
2 1p<br />
1<br />
3 p 3<br />
( *<br />
M<br />
2 3 p 3<br />
AC − B<br />
γ =<br />
AC − B<br />
( ω ) ,<br />
* 2<br />
[ M ( ω ) + i M ( ω )]<br />
1 *<br />
2 2 p 2 3 p 3<br />
,<br />
(19)<br />
one obtained the linearly system of<br />
differential equations<br />
Ω&<br />
Ω&<br />
1 = αC<br />
+βB<br />
) Ω 1+ ( βC+γB<br />
)<br />
( Ω<br />
2 = αB<br />
+βA)<br />
Ω 1+<br />
( βB+γA<br />
)<br />
( Ω<br />
The characteristic equation reads<br />
αC<br />
+ βB<br />
− r<br />
or<br />
αB<br />
+ βA<br />
βC<br />
+ γB<br />
βB<br />
+ γA<br />
− r<br />
= 0<br />
2<br />
2<br />
,<br />
(20)<br />
(21)<br />
2<br />
r + Dr + E = 0<br />
(22)<br />
where<br />
D = −( αC<br />
+ 2βB<br />
+ γA)<br />
,<br />
E = ( αC<br />
+ βB)(<br />
βB<br />
+ γA)<br />
− ( αB<br />
+ βA)(<br />
βC<br />
+ γB)<br />
(23)<br />
By making the calculations, from equations<br />
(23), (19) are obtained the results<br />
1<br />
D = −<br />
AC − B<br />
1<br />
E =<br />
2<br />
AC − B<br />
2<br />
*<br />
* 2<br />
2<br />
{ CM ( ω ) + AM ( ω ) + [ i A + 2i(1<br />
− i)<br />
B + (1 − i)<br />
C]<br />
M }<br />
* *<br />
2 * * 2<br />
[ M ( ω ) M ( ω ) + (1 − i)<br />
M ( ω ) M ( ω ) + i M M ]<br />
1p<br />
1p<br />
1<br />
1<br />
2 p<br />
2<br />
2 p<br />
2<br />
2 p<br />
2<br />
2 p<br />
2<br />
1p<br />
3 p<br />
3 p<br />
(24)
<strong>REVISTA</strong> ROMÂNĂ <strong>DE</strong> AUTOMATICĂ<br />
27<br />
For the evaluation of the signs of the of the<br />
parameters D, E are taking into account the<br />
inequalities:<br />
2<br />
2<br />
A > 0; C > 0; AC − B > 0; i A+<br />
2i(1<br />
− i)<br />
B + (1 −i)<br />
C > 0<br />
2<br />
(25)<br />
that are deduced from the element<br />
calculations from the relation (2)<br />
Therefore, if M ip ( ω<br />
* i ), i = 1, 2, 3 are negative,<br />
then D > 0 ; E > 0 , the equation (22) has real<br />
negative solutions or complex solutions with<br />
the real part negative and thus Ω 1 → 0 ,<br />
Ω and the movement is stabile.<br />
2 → 0<br />
4. CONCLUSION<br />
REFERENCES<br />
[1] Pandrea, N., Popa D.: Mecanisme. Teorie<br />
şi aplicaţii CAD, Ed. Tehnică, Bucureşti,<br />
2000.<br />
[2] Popa, D., Chiroiu, V., L. Munteanu, J.<br />
Onisoru, A. Iarovici: On the modeling of<br />
hybrid systems, Proc. of the Romanian<br />
Academy, Series A: Mathematics,<br />
Physics, Technical Sciences, Information<br />
Science, vol. 8, nr. 1, 2007.<br />
[3] Teodorscu, P. P.: Sisteme mecanice.<br />
Modele clasice, Ed.Tehnică, Bucureşti,<br />
vol. 1-3, 1984-1988-1997.<br />
[4] Dudiţă, FL: Mecanisme, Ed. Universitatea<br />
din Braşov, 1977.<br />
The mechanism used to couple three power<br />
sources is a planetary mechanism with two<br />
degrees of mobility. For such a planetary<br />
mechanism one makes the cinematic and<br />
dynamic analysis, finally resulting the<br />
differential equations of motion. The obtained<br />
equations for the steady-state are simple, they<br />
being useful to model the mechanism that can<br />
equipped a hybrid automobile.<br />
AR4-5.doc
28<br />
<strong>REVISTA</strong> ROMÂNĂ <strong>DE</strong> AUTOMATICĂ<br />
STUDIES AND EXPERIMENTAL RESEARCH REGARDING THE<br />
EVALUATION OF ENERGETIC CONSUMPTIONS DURING THE<br />
PRODUCTION OF MENIAL REFRIGERATION<br />
Dragos HERA, Ph-D, Anica ILIE, Ph-D, eng. Alina GIRIP<br />
dragos@instal.utcb.ro; anica@eits.mediasat.ro; agirip_4yahoo.com<br />
Faculty of Building Services and Equipment,<br />
Technical University of Civil Engineering 66, Pache Protopopescu Bd. Bucharest 2, Romania<br />
Abstract: The present paper brings out to knowledge the results of the studies and the experimental<br />
research, carried out during a project belonging to the National Program of Excellency Research,<br />
regarding the evaluation and analysis of energy consumptions during the production of menial<br />
refrigeration in Romania.<br />
The authors analyze the refrigerating equipment categories and present the graphic evolution in time of<br />
afferent energy consumptions (time versus energetic consumption).<br />
Also, specific consumption indexes, for the manager refrigerating equipment used in Romania, are being<br />
defined and determined, both theoretically and experimentally. The equipment mentioned previously is<br />
either used for producing alimentary refrigeration or for producing ventilation refrigeration.<br />
Key words: energetic consumptions, cooling systems, menial refrigeration<br />
1. INTRODUCTION<br />
Within a national research project of<br />
Energsys Excellence, along with the energetic<br />
rehabilitation analysis of the menial<br />
consumers’ charging systems, with either<br />
thermal or electrical energy, in Bucharest, the<br />
energetic consumption for the production of<br />
menial refrigeration and the refrigeration<br />
used in the comfort air-conditioning, were<br />
theoretically and experimentally analyzed, as<br />
well.<br />
Lately, a continuous rise of the electric<br />
energy’s consumption which insures the<br />
alimentary menial refrigeration, has been<br />
noticed. We are witnessing a continuous<br />
change in Terra’s climate, Romania being<br />
affected, as well, by the atmosphere warming,<br />
and with this, the home air-conditioning<br />
becoming more of a necessity.<br />
2. THE ENERGETIC CONSUMPTION’S<br />
EVOLUTION FOR THE MENIAL<br />
REFRIGERATION AND FOR THE<br />
AIR CONDITIONING IN ROMANIA<br />
2.1. THE ENERGETIC<br />
CONSUMPTIONS FOR MENIAL<br />
REFRIGERATION<br />
Using the statistic data, given by specialized<br />
institutions, we distinguished graphically the<br />
evolution in time of the equipments’<br />
categories used in the menial refrigeration<br />
(refrigerators, freezers, combines)<br />
represented by the cooled volume<br />
encountered with a frequency of more than<br />
95% among the menial consumers. We must<br />
add the fact that in 1975, refrigerators were<br />
represented by one door refrigerators, in<br />
1985, refrigerators with freezer and<br />
combines, made in Romania, begin to be used
<strong>REVISTA</strong> ROMÂNĂ <strong>DE</strong> AUTOMATICĂ<br />
29<br />
(Arctic and R12), and, by 1990 numerous<br />
major equipments in producing menial<br />
refrigeration start to be commercialized<br />
(Zanussi, Electrolux, Indesit, Gorenje, etc),<br />
with thermodynamical performances and<br />
with various effects on the medium. If, in<br />
the beginning, the commercialization was<br />
accessible enough, allowing also<br />
equipments using refrigerants forbidden by<br />
the Montreal Protocol, after it’s ratification<br />
by Romania (1993) only refrigerating<br />
equipments with ecological working fluids<br />
have been imported (R134a, R600). In<br />
figure 1, we can observe a continuous<br />
volume rise of the cooling volume for the<br />
menial consumption. Simultaneously,<br />
because of the increased comfort and the<br />
need of a more reduced specific energy’s<br />
consumption, the population turns to more<br />
advanced equipments (with larger volumes, but<br />
more efficient), a contribution to this being<br />
brought by the energetic labeling of these<br />
equipments. More and more used are the<br />
refrigerators with more efficient equipments<br />
(compressors, heat exchangers), in search of<br />
placing them within the energetic classes A and<br />
A+. In figure 2 one can notice a drop of the<br />
specific energy’s consumption (W/l). The<br />
highest specific consumptions correspond to the<br />
more reduced volumes (65….1251), a<br />
characteristic of the less advanced Romanian<br />
equipments (ARCTIC- the old generation).<br />
Along with the rise of the cooled volume (the<br />
ones used lately being the equipments with<br />
higher volume), but also with the use of<br />
advanced equipments, one can observe a<br />
continuous diminish of the specific energy<br />
consumption.<br />
Cooled volume, [l]<br />
600<br />
500<br />
400<br />
300<br />
200<br />
100<br />
Specific consumptions,<br />
[kW/dayl]<br />
0,007<br />
0,006<br />
0,005<br />
0,004<br />
0,003<br />
0,002<br />
0,001<br />
0<br />
65 145 215 235 275 350 400<br />
0<br />
1975 1985 1990 2005<br />
Eyar<br />
Cooled volume, [l]<br />
Figure 1: The required cooled volume vs. year<br />
Figure 2: The variation of the energy specific<br />
consumption vs. cooled volume<br />
2.2. ENERGETIC CONSUMPTIONS<br />
FOR AIR CONDITIONING<br />
For home air conditioning, the corresponding<br />
rise of the electrical energy consumption is<br />
even more spectacular, being almost absent<br />
before 1990 and reaching today to a point<br />
with air conditioning installation in almost<br />
50% of homes. This phenomenon is due to<br />
the continuous rise of the air’s temperature in<br />
summer, on one hand, and to the comfort<br />
conditions inside the houses, which are<br />
higher by day, on the other hand. Considering<br />
the importance of electric energy<br />
consumption for building air conditioning out<br />
of the total of menial consumptions, we<br />
consider adequate the analysis of these<br />
individual consumptions, as well as the<br />
necessity of their reduction by adopting new<br />
design solutions and new exploitation<br />
techniques.<br />
Two systems for comfort ventilation inside<br />
buildings are being used: systems with direct<br />
evaporation (split, multisplit) and systems<br />
with indirect cooling with secondary<br />
refrigerant (chiller and fan coils).
30<br />
2.2.1. Systems with direct evaporation<br />
For small cooling capacity (for a surface of<br />
25÷120m 2 ), the system which imposed itself<br />
is the one with direct evaporation, with one or<br />
more inner units. Studies and experimental<br />
researches regarding the performance of the<br />
systems with direct evaporation (Table 4)<br />
show their electric energy consumptions (Pc),<br />
in various working conditions: ambient air<br />
<strong>REVISTA</strong> ROMÂNĂ <strong>DE</strong> AUTOMATICĂ<br />
temperatures, evaporation temperatures (t 0 )<br />
and condensation temperatures (t C ), of the<br />
common refrigerating agents used in<br />
installations (R134a, R404A, R410A).<br />
Romania, as a country in progress, has<br />
benefited up until this year of facilities<br />
regarding the Montreal Protocol exigency,<br />
and so, in the present study the only<br />
refrigerant taken into account is R134a, as it<br />
is the most often used at this moment.<br />
Table 1: COP for air conditioning systems with direct evaporation<br />
t amb., t int t 0 , t C ,<br />
R 134a R404A R410A<br />
Q & ,<br />
[°C] [°C] [°C] [°C] Pc, COP, Pc, COP, Pc, COP,<br />
[kW]<br />
[kW] [-] [kW] [-] [kW] [-]<br />
30.00 20.00 8.00 45.00 9.60 2.24 4.29 2.52 3.81 2.43 3.95<br />
32.50 20.00 8.10 47.50 9.60 2.42 3.96 2.76 3.47 2.65 3.61<br />
32,50 20.00 8.30 50.00 9.60 2.61 3.68 3.02 3.17 2.89 3.32<br />
37.50 20.00 8.40 52.50 9.60 2.81 3.42 3.31 2.90 3.15 3.04<br />
40.00 20.00 8.60 55.00 9.60 3.01 3.19 3.62 2.65 3.43 2.80<br />
The average electric consumption for homes’<br />
air conditioning was calculated for a<br />
functioning period of 10 hours a day, having<br />
as a result the data in table 2.<br />
Table 2: The performance of air-conditioning systems with direct evaporation<br />
Living space Living Technical features of cooling plants<br />
surface<br />
[m 2 ] Cooling capacity, [kW] COP,<br />
[- ]<br />
Average consumption of<br />
electrical power<br />
[kWh/24h]<br />
Studio flat 25 1.5 4,61 3,25<br />
Ap. 2 rooms 40 2.4 4,61 5,2<br />
Ap. 3 rooms 60 3.6 4,61 7,81<br />
Ap. 4 -5rooms 80-120 4.8 – 7.2 4,61 10,4…15,61<br />
2.2.2. Indirect cooling systems (with<br />
secondary refrigerant)<br />
In conditions identical to the ones of the<br />
direct cooling (the same spaces, the same<br />
inner and outer temperatures and the same<br />
functioning period), the cooling capacity and<br />
the driving electrical power are presented in<br />
table 3.<br />
Table 3. The performances of air conditioning systems with secondary refrigerant<br />
No. Living space Living<br />
surface<br />
Technical features of cooling<br />
plants<br />
Average consumption<br />
of electrical power<br />
[m 2 ] Cooling capacity, COP,<br />
[kWh/24h]<br />
[kW]<br />
[- ]<br />
1. Studio flat 25 1.5 3,77 3,98<br />
2. Ap. 2 rooms 40 2.4 3,77 6,37<br />
3. Ap. 3 rooms 60 3.6 3,77 9,55<br />
4. Ap. 4 -5 rooms 80-120 4.8 – 7.2 3,77 12,73…19,1<br />
It is clearly seen that the systems with a direct 3. SPECIFIC INDICATORS
<strong>REVISTA</strong> ROMÂNĂ <strong>DE</strong> AUTOMATICĂ<br />
31<br />
cooling are more economical (the electric<br />
consumption is reduces with 18%).<br />
Nevertheless, the systems with indirect<br />
cooling are being used due to the advantages<br />
given by: the possibility of using ammonia,<br />
the most advanced, the cheapest and most<br />
ecological refrigerant; it uses a low quantity<br />
of refrigerant with a favorable influence over<br />
the ambient; the possibility of being used in<br />
district cooling systems.<br />
Both systems have evolved towards variants<br />
with reversible functioning (insuring both the<br />
air conditioning and the building heating) or<br />
with heat recovery, which improve more and<br />
more their performances.<br />
Further, we present the experimental data for<br />
the specific indicators, for the production of<br />
menial refrigeration and air conditioning,<br />
using the most customary refrigerant<br />
(R134a).<br />
3.1. MENIAL REFRIGERATION<br />
The average energy consumption was<br />
calculated for certain equipments in<br />
accordance with the size of the menial<br />
consumer.One observes a continuous drop of<br />
the specific consumption caused by the<br />
equipment’s performance improvement.<br />
Table 4. Energy consumption for the production of menial refrigeration<br />
No. Living space Cooling volume of<br />
refrigerator, [l]<br />
Average<br />
consumption of<br />
Specific<br />
consumption<br />
Refrigeration Freezing electrical power, [10 -3 kW/(day,l)]<br />
[kWh/24h]<br />
1. Studio flat 228 20 0,71 2,87<br />
2. Ap. 2 rooms 322 70 0,89 2,37<br />
3. Ap. 3 rooms 425 99 1,17 2,22<br />
4. Ap.4-5 rooms 522 165 1,43 2,08<br />
3.2. AIR CONDITIONING ENERGY CONSUMPTION (working time 10 hours/day)<br />
3.2.1. Direct evaporation systems<br />
Tabel 5. Specific air conditioning indicators with direct evaporation systems<br />
No. Living space Type of air<br />
conditioning<br />
unit<br />
Cooling<br />
capacity,<br />
[kW]<br />
Electrical<br />
power,<br />
[kW]<br />
Average<br />
consumption<br />
of electrical<br />
power<br />
[kWh/24h]<br />
Specific<br />
consumption<br />
[kW/(m 2 ,zi)]<br />
1. Studio flat Monosplit 1,5 0,325 3,25 0,13<br />
2. Ap.2 rooms (2 UI) 2,4 0,47 4,7 0,1175<br />
3. Ap.3 rooms (3 UI) 3,6 0,72 7,2 0,12<br />
4. Ap.4-5 rooms (4-5 UI) 4,8 – 7,2 0,94….1,37 9,4…13,7 0,1175 ..0,114<br />
3.2.2. Indirect cooling systems with secondary refrigerant.<br />
Tabel 6. Specific air conditioning indicators with indirect cooling systems<br />
No. Living space Cooling<br />
capacity,<br />
[kW]<br />
Electrical<br />
power,<br />
[kWh/24h]<br />
Average<br />
consumption of<br />
electrical power<br />
[kWh/24h<br />
Specific<br />
consumption<br />
kW/(m 2 ,zi)]<br />
1. Studio flat 1,5 0,398 3,98 0,159<br />
2. Ap. 2 rooms 2,4 0,572 5,72 0,143<br />
3. Ap.3 rooms 3,6 0,855 8,55 0,1425<br />
4. Ap. 4 -5 rooms 4,8 – 7,2 1,12….1,68 11,2…16,8 0,14
32<br />
From the data in tables 5 and 6, one can<br />
observe that the specific indicator has higher<br />
values in the case of the indirect evaporation<br />
with cca 21%, in rapport with the direct<br />
evaporation; the same dropping tendency can<br />
be observed in the case of the specific<br />
indicator’s value the same as the decrease of<br />
the cooled volume.<br />
4. DISCUSSION<br />
The data regarding the energy consumption<br />
for the production of menial refrigeration and<br />
air conditioning are specific to Romania<br />
today. Between the years 1975 and 2005, it<br />
has been canned a ascending evolution of the<br />
cooled volume for menial refrigeration,<br />
determined by the continuous rise of the<br />
lifestyle. The specific consumptions for the<br />
production of menial refrigeration have<br />
canned a continuous drop determined by the<br />
increase of equipment’s performances. The<br />
air conditioning has also canned major<br />
increases and determined, at the same time,<br />
the electric energy’s menial consumption rise.<br />
The average energy consumption necessary<br />
to the air conditioning depends on the volume<br />
of the cooled space and on the cooling system<br />
type. Nevertheless, in spite of their reduced<br />
electric consumption of the air conditioning<br />
system with direct evaporation, they are not<br />
recommended.<br />
<strong>REVISTA</strong> ROMÂNĂ <strong>DE</strong> AUTOMATICĂ<br />
REFERENCES<br />
1.Hera, Dragos, Refrigeration systems, vol I,<br />
Refrigerants, Ed. Matrix Rom, Bucuresti,<br />
2004.<br />
2. Hera, Dragos, Handbook for building<br />
services, Ventilation and air conditioning<br />
systems, Vol. II. Refrigerating systems, Ed.<br />
Artecno Bucuresti, 2002;<br />
3. Hera, Dragos, 2006, Durable management<br />
of natural clean water resources from hydro<br />
geological drills, for rural and subrural<br />
communities;<br />
4.Hera, Dragos, Ilie, Anica, 2006, Modeling<br />
of energetic processes characterized by<br />
variable loads in building and in energy<br />
supply systems;<br />
5. Hera, Dragos, Girip, Alina, – The real<br />
efficiency increase of menial refrigerator,<br />
(Conf. a XII-a ,, Efficiency, comfort, energy<br />
preservation and ambient protection’’,<br />
Bucuresti 24-25 nov. 2005).<br />
7.Standard Method of Test for the Evaluation<br />
of Building Energy Analysis Computer<br />
Programs (ANSI/ASHRAE STANDARD<br />
I40-2004);<br />
8.Hera, Dragos, Drughean, Liviu, Parvan,<br />
Alina, Refrigerating schemes and cycles for<br />
mechanical compression systems, Ed. Matrix<br />
Rom 2001.<br />
NOMENCLATURE<br />
- UI – interior unit; COP - coefficient<br />
of performance.<br />
AR4-6.doc
<strong>REVISTA</strong> ROMÂNĂ <strong>DE</strong> AUTOMATICĂ<br />
33<br />
DFM Solutions for Tombstoning in Vapour Phase Soldering<br />
Technology based on the CEEX-X2C09 Research Project<br />
I. PLOTOG, N. D. CODREANU, T. C. CUCU<br />
Center for Technological Electronics and Interconnection Techniques (UPB-CETTI),<br />
POLITEHNICA University of Bucharest, Spl. Independentei 313, 060042-Bucharest, Romania,<br />
Phone: +40 21 3169633 E-mail: norocel.codreanu@cetti.ro;<br />
C. TURCU, G. VARZARU<br />
Intrarom S.A, 17 Fabrica de Glucoza St., 020331-Bucharest, Romania,<br />
Phone: +40 21 2040702<br />
Abstract: The physics and chemistry of lead-free reflow soldering process phenomena’s revealed the<br />
inter-dependency between the solder paste, the component, the printed circuit board characteristics and<br />
reflow parameters, especially temperature versus time oven profile, going from the ambient value,<br />
approximately 25ºC, to over melting points, in order to assure liquid status of the solder paste. The paper<br />
presents the applied research performed in order to increase the quality of Lead-Free (LF)<br />
reflow/double-reflow VPS, by ruling out especially tombstoning.<br />
Keywords: VPS, vapour phase technology, lead-free alloy, tombstoning, SMT soldering process<br />
1. Introduction<br />
The goal of this paper is to determine the<br />
general requirements for PCBs and stencils<br />
design when using the „Vapour Phase<br />
Soldering” (VPS) technology in SMT<br />
reflow/double reflow process and to optimize<br />
VPS process parameters. The first<br />
experiments had shown an unacceptably large<br />
number of a specific defect, tombstoning<br />
(figure 1), the partial or complete lifting of<br />
passive SMT components during reflow,<br />
which is the phenomenon whereby small chip<br />
components, which are being soldered on<br />
SMT pads at opposite or polar ends, suddenly<br />
flip up vertically; sometimes the lifting is<br />
partial, and sometimes the chips are staying<br />
on one end like tombstones in a cemetery, on<br />
one of the pads.<br />
a.<br />
b.<br />
Fig. 1a, b. Tombstoning after VPS
34<br />
2. Phenomenon analysis<br />
The tombstoning phenomenon is generally<br />
determined by an imbalance of the forces<br />
which take action over the composition when<br />
the solder paste laid-down in the form of<br />
paste is in a liquid state. An analysis of the<br />
forces (figure 2) shows that the surface<br />
tension of the solder will produce a turning<br />
moment. The condition under which the<br />
turning moment will be large enough to lift a<br />
component is:<br />
F1 + F2 < F3, (1)<br />
<strong>REVISTA</strong> ROMÂNĂ <strong>DE</strong> AUTOMATICĂ<br />
where F1 = vertical component of chip<br />
weight; F2 = vertical component of surface<br />
tension force acting under the chip; F3 =<br />
vertical component of surface tension force<br />
acting on the top of chip.<br />
Detailing, (figure 3) with: m = chip mass; γ =<br />
surface tension of molten solder paste; H =<br />
thickness of chip; T = soldering zone of chip:<br />
Mg[(H+L)/2]cos(α+θ) + σT cos(α/2)< σ H<br />
cos(α+φ) (2)<br />
Fig. 2. The turning moment condition<br />
Normally, the surface tension forces F2 and<br />
F3 take action in both ends of the chip<br />
component with the same values in opposite<br />
directions. All the surface tension forces are<br />
in equilibrium. F1, the chip weight in this<br />
situation, presses the chip on pads (figure 4)<br />
Fig. 4. Forces equilibrium<br />
The tomstoning phenomenon appears when<br />
the surface tension forces from the ends of<br />
the chip component are unbalanced by<br />
different causes and once lifting starts, the<br />
forces that cause the tombstoning effect will<br />
increase. Occurrence of phenomenon<br />
increases for smaller components only the<br />
solder paste from one end of the chip<br />
component becomes liquid passing through<br />
molten phase. The risk of tombstoning<br />
Fig. 3. Unbalancing forces in liquid phase<br />
appearance is very high, especially for<br />
smaller chips. The thermal mass of the solder<br />
joints and for beginning of the process, the<br />
thermal mass of solder paste at either end of<br />
the passive component have a direct effect on<br />
the cause of tombstoning. The key for good<br />
quality reflow soldering process will be a<br />
result of the following congruently factors:<br />
solder paste characteristics, PCB design,<br />
components tolerances, parameters and<br />
tolerances of SMT reflow process in all<br />
phases.<br />
3. Experiments<br />
During the experiment, the authors have used<br />
NCAB type test PCBs, with the following<br />
classification: 1. (Chem. Ni/Au) Electroless<br />
Nickel Immersion Gold / 2. (Leadfree HASL)<br />
Hot Air Surface Leveling) / 3. (OSP) Organic<br />
Solderability Preservative / 4. (Chem. Tin)<br />
Immersion Tin / (Chem. Ag) Immersion<br />
Silver.
<strong>REVISTA</strong> ROMÂNĂ <strong>DE</strong> AUTOMATICĂ<br />
35<br />
Because the tombstoning affects especially<br />
the small chip components, the package types<br />
of lead-free chip components used was 0402,<br />
0603, 0805, 1206.<br />
For the experiment lead-free was used , noclean<br />
solder paste OM338T, type 3, (25-<br />
45µm per IPC J-STD-005) from Coockson<br />
Electronics, selected before after special<br />
experiments. The references for the dates of<br />
case dimensions (table 1 – IPC 782) and pads<br />
geometry (table 2) are given in fig. 5a, b.<br />
Tab. 1. Case dimensions<br />
According to geometrical references for cases<br />
and pads, the authors take into consideration<br />
the following hypothesis for stencils<br />
apertures design (table 2): - apertures<br />
dimensions identical with corresponding pads<br />
dimensions; with axial replacement to assure<br />
Smin (Ya4, Xa4); increasing 20% axial and<br />
10% radial (Ya1, Xa1); increasing 10% axial<br />
and 20% radial (Ya3, Xa3,). axial reducing<br />
(Ya1, Xa1), according with:<br />
Xa1 = Wmax, Ya1 = Tmax+2(Cp-Lmin)<br />
(3)<br />
Fig. 5. a. Case dimensions,<br />
b. Pads geometry<br />
In order to assure different volume of solder<br />
paste two stencils were made with different<br />
thickness 0.125mm and 0.150mm according<br />
with apertures from table 4. The authors also<br />
take into consideration one classical solution<br />
for stencils, 0.150mm thickness with 10%<br />
reducing apertures dimensions compared to<br />
pad dimensions and one stencil 0.125mm<br />
without reduction.<br />
Tab. 2. Stencil apertures dimensions<br />
For reflow soldering, the VPS SLC504 equipment from IBL company was used.<br />
4. Results<br />
The solder joints were analyzed according to<br />
the IPC-A-610 D. The solder joints grown<br />
from solder paste deposits follow out stencils<br />
apertures type 1 - 4 shown in figure 6c, d.<br />
The results regarding tombstoning after<br />
thermal profile optimization (figure 7) are<br />
presented in tables 3 and 4.
36<br />
<strong>REVISTA</strong> ROMÂNĂ <strong>DE</strong> AUTOMATICĂ<br />
a. b.<br />
The apertures with tombstoning were type 2<br />
for 0.125 stencil (figure 6a-0603 case, OSP<br />
finished) and for 0.150 stencil, type 1 (figure<br />
6b-0402 case, OSP finished, 6d-0402 case,<br />
NiAu finished), also type 2 for NiAu , 0603<br />
case and 3, 4, for chemical Tin.<br />
Fig. 7. VPS thermal profile<br />
c. d.<br />
Fig. 6a-d. Solder joints follow up apertures type<br />
For NiAu pads finished, cases type 0402,<br />
0.150mm stencil, the number of tombstoning<br />
was bigger, but at the limits, with a small<br />
angle lifting. It is important that NiAu for<br />
0.125 stencil, chemical silver and HASL for<br />
both stencils have not tombstoning. The<br />
solder joints resulting after stencils apertures<br />
type 2 and 3 present to much solder. In<br />
connection to the tombstoning results, the<br />
conclusion is that 2 and 3 apertures type<br />
especially on 0.150mm stencil, NiAu pads<br />
finished and case smaller than 0805, must be<br />
avoided. The parameters of VPS process are<br />
position on levels, period on position and<br />
heating power. The SLC504 machine offers<br />
20 levels with 0 – 100% power range. In<br />
order to obtain the optimum thermal profile,<br />
the authors used temperature sensors to<br />
measure temperatures distributions on pcb<br />
surface. The result emphasizes differences<br />
between temperatures measured on PCB<br />
surface and machine reference temperature.<br />
Tab. 3. Tombstoning for 0.125 Stencil Printing<br />
Tab. 4. Tombstoning for 0.150 Stencil Printing
<strong>REVISTA</strong> ROMÂNĂ <strong>DE</strong> AUTOMATICĂ<br />
37<br />
5. Conclusions<br />
The quality analysis and tombstoning<br />
appearances situations demonstrated that the<br />
type 2 and 3 apertures assure solder paste on<br />
pads in excess. As upshot the wetting angle<br />
of solder joints are close to 90°, the limit of<br />
quality acceptance. Also, the solder paste in<br />
excess offers condition for spread solder balls<br />
on pcb surface. The theoretical analysis and<br />
practical results show the importance of<br />
solder paste deposit’s axial dimension<br />
compared to chip component axial dimension<br />
as a tombstoning factor.<br />
Based on the practical results of experiments,<br />
the generally accepted criteria for a chip,<br />
component solder adequacy, the joint should<br />
extend up the component termination for a<br />
minimum of one-third of the component<br />
height, or 0.4 mm, whichever is less, the<br />
tolerance of chip components cases, the<br />
variability of pad dimensions, the authors are<br />
proposing the following requirements for<br />
stencil design regarding chip components<br />
assembling in vapour phase technology:<br />
radial apertures dimension, Xa :<br />
Xa = W+H (4)<br />
axial apertures dimension, Ya :<br />
Cp – Ya = S, Cp + Ya = L=T, Ya = (L+T) /<br />
2 (5)<br />
stencil thickness: 0.125mm<br />
As a result, the team defined the necessary<br />
criteria in order to obtain optimum thermal<br />
profile by measuring temperatures directly on<br />
pcb surface: preheating with 1.4 °C/s until<br />
185-190°C and go to range of melting point<br />
with 0.66 °C/s until maximum temperature<br />
230 °C.<br />
References<br />
[1] T. C. Cucu, N.D.Codreanu, I. Plotog,<br />
"Reflow process using lead free materialsbasics<br />
and comparison with tin-lead process",<br />
Proceedings of the 2005 Interntional<br />
Symposium for Design Technology and<br />
Electronics Packaging (SIITME 2005), Cluj-<br />
Napoca, Romania, September 22-25, 2005,<br />
pp. 250 - 255.<br />
[2] I. Plotog, S. Jianu, C. Turcu, T. C. Cucu,<br />
N.D.Codreanu, “Multi-criterial Approach for<br />
Implementing of Lead-free Technology”, 4th<br />
European Microelectronics and Packaging<br />
Symposium, May 21-24, Terme Catez,<br />
Slovenia, pp. 301-306.<br />
[3] I Plotog, S. Jianu, C. Turcu, A. Stan,<br />
T.C.Cucu, N.D.Codreanu, DFM Concept for<br />
Wave Soldering Technology, SIITME 2006,<br />
Iasi, September 2006 Romania<br />
[4] Klein Wassink, Soldering in Electronics<br />
(2nd Edition), Electrochemical Publications,<br />
Port Erin, Isle of Man, Great Britain, 1989<br />
[5] S. Jianu, I. Plotog, C.Turcu, A. Stan,<br />
T.C.Cucu, N.D.Codreanu, Reliability Aspects<br />
for optimal Implementation of Lead-free<br />
Technology, SIITME 2006, Iasi, September<br />
2006 Romania<br />
[6] ***, Internet web sites related to<br />
DFM topics.<br />
[7] ***, www.ipc.org<br />
AR4-7.doc
38<br />
<strong>REVISTA</strong> ROMÂNĂ <strong>DE</strong> AUTOMATICĂ<br />
INTELLIGENT INTEGRATED SYSTEM FOR<br />
PUBLIC TRANSPORT- SMARTBUS<br />
Marian LĂCRARU, Livia ŞTEFAN, Silviu DUMITRU,<br />
Iolanda COSTACHE, Nicolai VĂCEANU, Simona POILINCA<br />
Institute for Computers, Bucharest, mlacraru@itc.ro<br />
Adrian EŞANU, Dorin BO<strong>DE</strong>A, Bogdan BARANOVSCHI, Tudor POPA<br />
SIAT, Bucharest, aesanu@itc.ro<br />
Eugen POP, Mihai BARBOS<br />
<strong>IPA</strong>, Bucharest, epop@ipa.ro<br />
Beatrice ŞTEFĂNESCU<br />
SSI Bucovina, Suceava, office@ssi-bucovina.ro<br />
Abstract: “SMARTBUS” it is the result of a R&D project under the national programme CEEX,<br />
developed during 2006-2008, with the objective to implement innovative and integrated solutions as a<br />
support of the "smart bus" concept, capable to respond to the requirements for an effective public<br />
transportation management and passenger information in the context of a sustainable development of the<br />
transportation services. The project is also in line with the challenges of the Strategic Research Aggenda<br />
of the ERTRAC (European Road Transport Research Advisory Council) and with the requirements of the<br />
Romanian EU adherence.<br />
The paper presents an integrated pilot system comprising the following subsystems: a) a pilot e-ticketing<br />
subsystem, b) a pilot passenger information subsystem, c) a pilot management subsystem for<br />
transportation services as implemented by the SMARTBUS project. The implementated systems are:<br />
electronic titles and integrated ticketing system with contactless cards, readers and validators, vehicle<br />
localization by GPS and GSM/GPRS mobile communications, GIS solution for tranportation systems,<br />
specialized command and control applications and equipments, specialized back-end applications and<br />
reporting system, web site and information kiosk application for traveller support . The solutions were<br />
experimented for route 5 of the main local public transport operator in Suceava city (N-E Romania). The<br />
project is disseminated online on the dedicated web site http://smartbus.itc.ro<br />
Keywords: public transportation, on-vehicle systems, on-vehicle computer, e-ticketing, travel cards,<br />
AVL, passenger information systems, bus monitoring, transportation management systems, decision<br />
support, OLAP, data warehouses, mobile applications, Wi-Fi, embedded systems<br />
1. Introduction<br />
The present paper describes the results of a<br />
research project financed within the<br />
framework of the National Program for<br />
Research Excellency - CEEX 2006-2008.<br />
The project was coordinated by ITC<br />
Bucharest and implemented in partenership<br />
with other two research institutes in the<br />
domain of industrial automation (<strong>IPA</strong><br />
Bucharest, SIAT Bucharest), two<br />
universitary centers (UPB-CEPETET in<br />
Politechnic Institute Bucharest and "Lucian<br />
Blaga" University from Sibiu) and a private<br />
company for IT research, development and<br />
client services (SSIB Suceava). The project was<br />
developed with the advice from the main public<br />
transport operator from Suceava city - TPS and<br />
from local Authority Suceava.<br />
The project is online disseminated in the<br />
dedicated website http://smartbus.itc.ro<br />
The SMARTBUS project aimed to contribute<br />
to the public transport development on a<br />
technological, economical and social level.
<strong>REVISTA</strong> ROMÂNĂ <strong>DE</strong> AUTOMATICĂ<br />
39<br />
2. The project results<br />
The project is an integrated system and<br />
services designed for public transport<br />
travellers, operators and administrators.<br />
The integrated system is illustrated in the<br />
below figure.<br />
Figure 1 logical architecture of the<br />
SMARTBUS system<br />
The SMARTBUS system is comprised of:<br />
A. the ticheting system which implements:<br />
• electronic travel cards,<br />
• system for travel card issuance and<br />
reload,<br />
• system for card validation aboard the<br />
vehicle;<br />
• system for card inspection based on<br />
mobile equipments Pocket PC (PDA)<br />
compatibile;<br />
• communication system at small and<br />
remote distance;<br />
• back-office information system.<br />
B. automatic vehicle localization system<br />
(AVL) which implements:<br />
• AVL system aboard the vehicle for<br />
localization using the GPS system and<br />
mobile data communication with the<br />
dispatcher using GSM/GPRS;<br />
• central system for mobile<br />
communication with the vehicles;<br />
• software dispatcher for monitoring and<br />
analysis of the transport vehicle<br />
circulation.<br />
C. passenger information system:<br />
• aboard the vehicle, regarding the current<br />
route, the next bus station, the links to<br />
other bus routes, other general interest<br />
informations. The system comprises:<br />
o the information system provided by<br />
the bus manufacturer,<br />
o "SMARTBUS" information system,<br />
which localizes the bus on a route<br />
map, controlled by the board<br />
computer.<br />
• in the bus stations, regarding the<br />
estimated arrival minutes of the nearest<br />
bus, information about the routes<br />
(modifications, traffic and weather<br />
information). The system consists of:<br />
o alphanumeric displays (signs);<br />
o embedded system for sign control<br />
and data communication;<br />
o software dispatcher for the<br />
management of the mobile<br />
communications with the bus<br />
stations;<br />
o software application for prediction<br />
of the vehicle arrival minutes in<br />
each bus station.<br />
D. board computer/master driver console,<br />
implemented with a portable computer,<br />
which performs data storage, integration and<br />
management of the "SMARTBUS"<br />
functionalities aboard the vehicle (driver<br />
authentication, route configuration, travel<br />
card validation, GPS data reception and<br />
transmission using GSM/GPRS channels,<br />
driver and passenger information).<br />
E. public information and support<br />
applications, accessed from various<br />
software/hardware platforms: info-kiosk,<br />
SMARTBUS ONLINE website.<br />
F. back-office information system for<br />
"SMARTBUS" services for data<br />
monitoring, dispatching, management,<br />
analysis, reporting, decision support, which<br />
consist in computer network, data bases,<br />
data warehouses, multidimensional cubes,<br />
OLTP (transactional) and OLAP<br />
(operational) applications and services. It is<br />
sustained by two categories of services and<br />
applications:<br />
a) operational management applications:<br />
a1) support for financial clearing<br />
operations for the ticketing system; a2)<br />
graphic dispatcher for the AVL system;<br />
a3) activity reports;
40<br />
• business intelligence applications: b1)<br />
multidimensional analysis applications<br />
for the ticketing system; b2) OLAP<br />
reports for decision support.<br />
3. Tehnical description<br />
3.1 The ticketing system<br />
The ticketing system implements the travel<br />
cards in keeping with different transport<br />
requirements. The structure of the travel card<br />
is complying with the European standard<br />
ENV 1545 regarding the transport data, but<br />
simplified according to the specific of the<br />
national public transport services. The<br />
ENV1545 standard defines the codification of<br />
the specific data elements for public<br />
transport (the transportator, the validation<br />
transaction, history, a.s.o).<br />
For card implementation the project used<br />
plastic-based Mifare Philips Classic 1K and<br />
paper-based Mifare Philips Ultralight<br />
contactless cards.<br />
As for the contactless card the standard in use<br />
is ISO 14443-1,2,3,4, which establishes a<br />
data transsmision up to 10 cm at a 13,56 MHz<br />
operation frecquency. Within the present<br />
standard there are 2 sub-types of contactless<br />
cards, depending on the modulation method:<br />
• Type A (from Mikron, Philips, Siemens)<br />
• Type B (from Motorola, SGS Thomson)<br />
Starting from ISO 14443-A standard it was<br />
created the industrial standard MIFARE<br />
(Philips registered mark), both for contactless<br />
cards and for dual interface cards. This<br />
standard is at present the most used RF<br />
technology for data communication between<br />
a contactless card and a reader.<br />
Within the project the following travel cards<br />
were implemented:<br />
• Limited-use tickets (using Mifare<br />
Ultralight cards): for 2 or 10 travels<br />
or for one-day travel;<br />
Reusable cards (using Mifare Classic 1K cards):<br />
driver and inspectors cards, one-month cards,<br />
free travel cards.<br />
<strong>REVISTA</strong> ROMÂNĂ <strong>DE</strong> AUTOMATICĂ<br />
It was implemented a flexible travel<br />
payment system based on user profile -<br />
students, elder people, ordinary travellers,<br />
and also a fidelization system based on<br />
usage criteria and collected card points.<br />
The board computer (the driver master<br />
console) it is implemented using a portable<br />
computer at which were connected 2 contactless<br />
card validators, a GPS/GSM modem and it was<br />
used the internal Wi-Fi adaptor.<br />
The validators are controlled by the master<br />
console using a RS485 interface and a<br />
master/slave protocol. The validators are<br />
equipped with a graphic display, 3 lights and<br />
a sound system for display and<br />
communication of text, visual and auditive<br />
messages regarding the status of the card<br />
being validated. The processing and storage<br />
of the validation transactions is performed<br />
“online” by a specialized application in the<br />
master console, not by the validator which<br />
has a limited processing capacity.<br />
At the vehicle depot it is implemented a<br />
WLAN (WiFi LAN) consisting in the local<br />
Ethernet network, an Access Point and 2<br />
workstations equipped with wireless adaptors.<br />
The card issuing system is implemented using<br />
USB 2.0 desktop contacteless readers ARC<br />
1003 which is multi-standard and offers a 2-<br />
light signalization: RED: power/error;<br />
GREEN: data transfer.<br />
The issuance transactions are locally stored<br />
using a Microsoft Access 2003 database.<br />
Figure 3 ARC 1003 Contactless reader
<strong>REVISTA</strong> ROMÂNĂ <strong>DE</strong> AUTOMATICĂ<br />
41<br />
These readers make use of a ACG proprietary<br />
protocol named “Ratatosk”.<br />
For implementation of the vehicle validation<br />
system for the travel cards, the ARC1007<br />
validators were used, which are connected to the<br />
PC through an adaptor RS-485/RS-232. The<br />
adaptor powers on from the serial ports, and<br />
ensures an automatic bidirectional<br />
communication, without software control.<br />
Figure 2 ARC 1007 Validator<br />
For communications between the master console<br />
and the Arcontia validator it is used a low level<br />
protocol, corresponding to the OSI model 2–4,<br />
named Gleipner, which was created by the<br />
validator's manufacturer - Arcontia. The protocol<br />
it is used to send/read simple commands, to the<br />
keyboard and display.<br />
The serial bus can support up to 8 validators<br />
but the ASCII protocol allows the dialog with<br />
one validator at a time (non-bus architecture).<br />
Consequently, the control applications from<br />
the master console implements an internal<br />
multi-tasking in order to communicate in real<br />
time with all the validators.<br />
The default data transfer speed is 57.6 kbit/s<br />
and can reach up to 460.8 kbit/s.<br />
For passenger information regarding the card<br />
validation it was established visual and<br />
audible secquences on the validator.<br />
The validation transactions are stored on the<br />
computer board application in a Microsoft<br />
SQL Server 2005 Compact Edition database<br />
and transmitted to the dispatcher using RDA<br />
(Remote Data Access) sinchronization<br />
operations with the central Microsoft SQL<br />
Server 2005 database.<br />
Microsoft SQL Server 2005 Compact Edition<br />
(SQL Server CE) is the present compact<br />
edition which evolved from Microsoft SQL<br />
Server 2005 Mobile Edition having no<br />
restrictions regarding its use on the desktop<br />
computers.<br />
Microsoft SQL Server 2005 Compact Edition<br />
it is a small database engine with a footprint<br />
of 1.8 MB; it can store single-file databases<br />
up to 4 GB; it supports 128-bits SSL for<br />
security, including the firewalls; it supports<br />
128-bits R<strong>SA</strong> encryption for devices; it<br />
provides a password encrypted format.<br />
The data propagation from an SQL Server<br />
database to a local SQL Server Compact<br />
Edition database it is called data pull. The<br />
reverse propagation from an SQL Server<br />
Compact Edition database to an SQL Server<br />
it is called data push.<br />
The synchronization process between the two<br />
databases follows the data modifications in<br />
the local database which are then send.<br />
The download of the validation transactions<br />
to the dispatcher it is performed in welldefined<br />
moments, when the vehicles arrive at<br />
the depot. The drivers are authorized by<br />
presenting their card at the service start.<br />
In order to implement the travel card mobile<br />
inspection system it was used a mobile device<br />
PocketPC compatible and a contactless reader<br />
for CompactFlash interface – ARC 1006.<br />
The control transactions are also stored in a local<br />
Microsoft SQL Server 2005 Compact Edition<br />
database. The inspectors are authorized by<br />
presenting their card at vehicle boarding.<br />
The communication between the dispatcher and<br />
and PDA is similar to the communication<br />
between the dispatcher and the vehicle, having<br />
the role to parameterize the PDA. The data<br />
transmission can take place at vehicle departure<br />
or arrival, in this case, simultaneously with the<br />
validation transactions download.<br />
Figure 2 ARC 1006 contactless reader
42<br />
Data communications for the ticketing<br />
System<br />
The large number of the daily transactions<br />
resulted from the card validation and the<br />
issuing processes requires a decentralized<br />
architecture for data collection.<br />
This architecture allows data collection from<br />
the subsidiary systems and from those to the<br />
central management system, to be used for<br />
data processing, analysis and reports. The<br />
data processing can be performed both at a<br />
local (depot) and at a central level of the<br />
transport operator.<br />
The data communications take place as<br />
follows:<br />
• From the depot dispatcher to the card<br />
issuing centers and to the information<br />
kiosks, in order to update the system<br />
data (tariffs, black list a.o.) – remote<br />
data transmissions using GSM/GPRS;<br />
• From the issuing centers and the<br />
information kiosks to the depot<br />
dispatcher, in order to transmit the daily<br />
issuing transactions and the card<br />
incidents declared from the kiosks –<br />
remote data transmissions using<br />
GSM/GPRS;<br />
• inside the vehicle, between the<br />
validators and the board computer,<br />
through the RS232/RS485 interface;<br />
• between the depot dispatcher and the<br />
vehicle or the PDA device, in order to<br />
update the system data – small distance<br />
data communications using Wi-Fi;<br />
• between the vehicle, PDA and the<br />
dispatcher in order to transmit the daily<br />
validation and control transactions -<br />
small distance data communications<br />
using Wi-Fi (WLAN).<br />
The hardware infrastructure for data<br />
communications between the dispatcher<br />
and the distributed points of sale is the<br />
following:<br />
1. PC stations installed in the client<br />
points of sale that are distributed<br />
throughout the target area;<br />
2. Telit EZ-10 GPS modems, installed<br />
and configured through serial<br />
<strong>REVISTA</strong> ROMÂNĂ <strong>DE</strong> AUTOMATICĂ<br />
connections on computers located in<br />
the client points of sale;<br />
3. Central server/dispatcher for data<br />
centralization;<br />
4. GPRS Internet connections for the<br />
distributed client service points of<br />
sale, through Orange cellular network<br />
services (the GPRS communication<br />
channels are opened with EZ-10 GPS<br />
modems);<br />
5. Wired Internet connection with<br />
routable (forward) IP for the central<br />
server/dispatcher.<br />
Technical characteristics of the EZ-10 GPS<br />
modem:<br />
Receiver: EGSM 850/900/1800/1900<br />
MHz quad-band;<br />
Power: Class 4 (2W) for<br />
850/900MHz, class 1 (1W) for<br />
1800/1900MHz;<br />
Temperature working interval: -20 /<br />
+70 o C ;<br />
I/O: 4 I/O general purpose channels.<br />
Software components of the ticketing<br />
system:<br />
• specific proprietary libraries for the<br />
Arcontia reader;<br />
• specific C++.NET 2005 project<br />
libraries;<br />
• desktop applications for ticketing, built<br />
in Visual Studio.NET 2005 C#:<br />
o software application for pre-issuing<br />
travel cards;<br />
o application for issuing travel cards;<br />
o application for the onboard computer;<br />
o application for travel cards validation;<br />
o application for the traveller info<br />
kiosk;<br />
o application for GPRS data<br />
transmissions.<br />
• local Microsoft Access 2003<br />
databases;<br />
• central Microsoft SQL Server 2005<br />
database;<br />
• Microsoft SQL Server 2005 Compact<br />
Edition compact databases.
<strong>REVISTA</strong> ROMÂNĂ <strong>DE</strong> AUTOMATICĂ<br />
43<br />
3.2. The SMARTBUS-AVL system<br />
Figure 3 The travel card issuing application.<br />
The info kiosk application<br />
Figure 4 The mobile validation application.<br />
The driver console – the “Ticketing” module<br />
Figure 5 GPRS communications in the ticketing<br />
system<br />
The AVL system is implemented in order to<br />
monitor and administrate the vehicle fleet,<br />
and to maintain an operative link with<br />
vehicles in the traffic.<br />
The following hardware infrastructure was<br />
implemented:<br />
1. a server cabled to the Internet having<br />
a forward IP, to be used by the AVL<br />
server application;<br />
2. a central server which hosts the<br />
database SQL SMARTBUS,<br />
connected to the server network with<br />
forward IP;<br />
3. PC workstations and a laptop which<br />
emulates the on-board computers,<br />
having dynamic IP (assigned through<br />
DHCP by Orange mobile network<br />
operator) and the network connections<br />
made through GPRS modems;<br />
4. GPRS modems Telit EZ-10 GPS,<br />
each one connected on a PC/laptop<br />
serial port, which allows both the<br />
determination of the geographic<br />
position through GPS system and also<br />
data mobile connections.<br />
The AVL and communication component<br />
aboard the vehicle<br />
A software module was implemented with the<br />
role to automaticaly determine the geographic<br />
position of the vehicle through the satellites<br />
of the Global Localisation System - GPS, and<br />
also with the role of a GSM-GPRS mobile<br />
data communication for a real time link<br />
between the on-route buses and the central<br />
dispatcher.<br />
The transmitted information types are:<br />
vehicle localization messages sent to the<br />
dispatcher, respectively bidirectional text<br />
messages (the driver can announce to the<br />
dispatcher, for example, unexpected traffic<br />
situations or tehnical issues, but can also be<br />
notified by the dispatcher).
44<br />
<strong>REVISTA</strong> ROMÂNĂ <strong>DE</strong> AUTOMATICĂ<br />
The component implementation as a<br />
personalized control for Windows Forms in<br />
Microsoft Visual Studio 2005 environment was<br />
required by the necessity to integrate it into the<br />
driver console application in order to have a<br />
single user interface and also for an autonomous<br />
functionality, with the minimum necessary<br />
interaction from the parent application.<br />
The central AVL and communications<br />
component<br />
It is a complementary application of the<br />
communication component aboard the<br />
vehicle. It has the role to manage the<br />
bidirectional data flow between the buses on<br />
the route and the dispatcher, by receiving and<br />
storing in the main database the geographic<br />
position messages for all the buses, and to<br />
manage the transmision and the reception of<br />
the text messages between the central<br />
dispatcher and the drivers.<br />
The application allows to simultaneously<br />
open Internet communication channels,<br />
through forward IP network connection,<br />
callable by the mobile clients from the buses<br />
having GPRS modems installed.<br />
Software components of the AVL system:<br />
• software applications made in Visual<br />
Studio.NET 2005 C#:<br />
AVL component aboard the<br />
vehicle;<br />
Central AVL component;<br />
• Microsoft SQL Server 2005 Compact<br />
Edition database;<br />
• ActiveX control developed with<br />
Borland Delphi, representing the<br />
interactive map of the Suceava city.<br />
Figure 7 The driver console application – “AVL”<br />
section<br />
Figure 8 AVL communication server<br />
3.3. The passenger information system –<br />
“SMARTBUS-SICS”<br />
The following hardware infrastructure was<br />
implemented:<br />
• a passenger information system for public<br />
transportation bus stations composed of:<br />
a local system with microcontroller<br />
(embedded) for data acquisition and<br />
communication;<br />
alphanumeric signs;<br />
software applications.<br />
• GPRS communication support;<br />
• a central post with the following<br />
functionality:<br />
remote configuration of the system;<br />
bus arrival minutes prediction;<br />
centralized monitoring of the<br />
positions and status of the on-route<br />
buses;<br />
management of the text messages<br />
exchanged with the local signs.<br />
Figure 6 AVL component aboard the vehicle
<strong>REVISTA</strong> ROMÂNĂ <strong>DE</strong> AUTOMATICĂ<br />
45<br />
Software components of the passenger<br />
information system:<br />
• software applications made in<br />
assembler and in VB.NET language:<br />
embedded application for local<br />
data acquisition and display;<br />
desktop application for central<br />
communications with the bus<br />
<br />
stations;<br />
desktop application for prediction<br />
of the bus station arrival.<br />
• Microsoft SQL Server 2005<br />
SMARTBUS central database.<br />
The prediction application for bus station<br />
arrivals<br />
The prediction application for the bus station<br />
arrivals of the VTP (Public Transport<br />
Vehicles) has the role to treat in real time the<br />
received position data from the buses and to<br />
provide estimated values for the bus station<br />
arrivals.<br />
The SMARTBUS software applications from<br />
the central level communicate with each other<br />
through common SMARTBUS SQLServer<br />
database tables.<br />
The updates interval for the bus station signs<br />
is 1 minute, and during this time the<br />
prediction application makes at least two<br />
estimations to calculate the prediction value.<br />
The application has been made to monitor the<br />
bus line 5 from Suceava city.<br />
The prediction algorithm is based on periodic<br />
readings of the bus coordinates and their<br />
comparison with the N points vectorized bus<br />
route. Thus the current positions are<br />
estimated and the delay values for each bus<br />
station are chosen relative to the current bus<br />
position (the calculated values are<br />
summarized to obtain the delay of the bus<br />
from the current position to the monitored<br />
station). The calculations are repeated for all<br />
buses on the route. The minimum value of<br />
these values for each bus station represents<br />
the estimated arrival time of the first bus.<br />
This value and the command buffer for the<br />
bus station sign are written in a database<br />
table, used by the local control application for<br />
the station signs.<br />
The delay values estimated and stored are<br />
obtained taking into account a value of 36<br />
km/h as a medium speed planned to cover<br />
the current line route. These values can be<br />
dinamicaly modified, applying a correction<br />
factor according to a particular case.<br />
In order to perform bus monitoring it was<br />
also implemented an algorithm which has as<br />
inputs the bus planned schedule taken from a<br />
database table and as output the analysis data<br />
regarding the realized bus schedule,<br />
depending on the information collected in<br />
real time. The status of the on-route vehicles<br />
can take 4 values: in time, in delay, in<br />
advance (headway), stopped because of<br />
technical problems.<br />
The informational panel<br />
The information panel is an alphanumeric<br />
display, AlphaEclipse type, used for public<br />
information. This is composed of a display<br />
panel made up by LED display modules, in a<br />
metal enclosure with the command and power<br />
elements.<br />
The displayed information is: the hour, date<br />
and temperature, the buses that are nearby the<br />
station; a summary description of the current<br />
routes (most significant points), text<br />
messages or graphic images.<br />
The main units that compose the electronic<br />
sign are: a) the controller board; b) the<br />
display module; c) the comon supply source;<br />
d) the thermostat.<br />
The text messages are sent from the software<br />
dispatcher described below.<br />
The software dispatcher for data<br />
communications with the bus stations<br />
The application for communication with the<br />
bus stations has the considerable role to<br />
render valuable the informations obtained<br />
from the equipments aboard the vehicles,<br />
transmitting the prediction data obtained at<br />
the central level to the local equipments in the<br />
bus stations, to display useful passenger<br />
information.
46<br />
<strong>REVISTA</strong> ROMÂNĂ <strong>DE</strong> AUTOMATICĂ<br />
The corresponding software application for<br />
this function is running in a minimized state<br />
in the default receiver mode or in fullwindow<br />
state when it is necessary to change<br />
certain parameters, to run individual<br />
interrogations of the local equipments.<br />
For data communications it was implemented<br />
a device called Data Concentrator (DCD)<br />
which is an interface of the communication<br />
application with the GSM/GPRS network and<br />
implicitly with the local equipments and<br />
devices.<br />
The device has a GSM/GPRS modem with a<br />
suitable antenna and communication<br />
interfaces with the computer of the<br />
communication application and also an<br />
AC/DC power adapter.<br />
Figure 11 The data concentrator device. Dispatcher<br />
appplication for bus station data communications.<br />
Figure 12 Display panels in the bus stations<br />
Figure 13 Prediction application for bus station<br />
arrivals<br />
4. Back-office information system for the<br />
"SMARTBUS" services<br />
The back-office component represents the<br />
computing systems, database servers, the<br />
services and applications needed to collect,<br />
process, administrate and analyze data from<br />
SMARTBUS system, having an essential role<br />
for the functionality of the whole<br />
SMARTBUS system as an integrated system.<br />
The back-office component functions are:<br />
• to collect OLTP (Online Transactional<br />
Processing) data – the system used to<br />
collect data in real time and to make the<br />
operative management;<br />
• to manage OLTP data;<br />
• to manage OLTP system reporting<br />
services;<br />
• to collect OLAP (Online Analytical<br />
Processing) data – the system used to<br />
build historical data and to ensure a<br />
decision support by means of the<br />
“business intelligence” applications;<br />
• to manage OLAP reporting services;<br />
• to support analysis and decision<br />
making;<br />
• to provide user information and<br />
support.<br />
Services and applications for operative<br />
management:<br />
• application for the management of<br />
the reference data from the ticketing<br />
system (fees, titles, etc);<br />
• application for reporting the reference<br />
data and the daily activity in the<br />
ticketing system (fees, titles,<br />
transactions);
<strong>REVISTA</strong> ROMÂNĂ <strong>DE</strong> AUTOMATICĂ<br />
47<br />
• application for planning the schedule<br />
of the buses, lines and drivers;<br />
• OLTP SQL Server 2005 services for<br />
the automatic collection and<br />
processing of the distributed data<br />
from the ticketing system.<br />
• OLTP reports for the daily activities<br />
(summerized transactions for points of<br />
sales, bus lines, a.s.o.);<br />
• computer assisted graphic dispatcher<br />
for the AVL system.<br />
Services and applications for "business<br />
intelligence”:<br />
• OLAP SQL Server 2005 services for<br />
data preparation for the ticketing<br />
system datawarehouse (historic,<br />
synthetic data);<br />
• OLAP SQL Server 2005 services for<br />
creation and procession of the<br />
datawarehouse for the ticketing system;<br />
• application for multidimensional<br />
analysis of the ticketing system, a<br />
decision support tool;<br />
• OLAP reports (route/bus utilization,<br />
system trends s.a.).<br />
The application for bus and driver<br />
schedule planning<br />
The application is an important tool both for<br />
SMARTBUS system operation and also for<br />
its testing stage.<br />
The application has the following main<br />
functionalities:<br />
• automatic generation of the departure<br />
hours and minutes for each route lap<br />
according to a planned bus time<br />
succession, dependant on the hour<br />
intervals (normal hours, rush hours);<br />
• automatic generation of the arrival hours in<br />
each bus station for each route lap, starting<br />
with the departure hours defined above.<br />
This two functions are based on general<br />
information stored in a database table,<br />
provided by the transport operator. The<br />
application also allows:<br />
• manual route/laps allocation for each bus;<br />
• manual driver/bus allocation, taking into<br />
account that the drivers have two<br />
working shifts and two days off;<br />
• definition of a route from predefined and<br />
geo-referenced route stops.<br />
The departures of the buses are defined for a<br />
specific route and have as a parameter the<br />
code of the departure location, usually a<br />
depot. The data views can be filtered by<br />
route, bus or driver.<br />
The software dispatcher GIS/AVL<br />
This application monitors the on-route buses,<br />
in order to supervise the bus schedule and<br />
route adherence, and also to capture the<br />
possible route incidents, thus allowing for<br />
adecquate action taking. Furthermore, the<br />
application offers the possibility to view and<br />
analyze the data according to some<br />
performance indicators. The application also<br />
allows the communication with the on-route<br />
bus drivers by text messages: view input<br />
messsages, create new output message, view<br />
message status. The message distribution is<br />
handled by the AVL central application by<br />
means of the database.<br />
The application offers data views both in<br />
datagrids and also in a visual form on an<br />
interactive map of Suceava city, which is<br />
performed by means of an ActiveX control<br />
implemented within the project. The map<br />
allows manipulations by zoom and pan<br />
operations and also the display of information<br />
labels attached to the bus and station map<br />
objects.<br />
The application allows: map views of the bus<br />
current (real time) position on the route of<br />
the monitored lines 5 and 2 in Suceava city;<br />
data regarding the bus circulation filtered by<br />
date, hour, route, vehicle, work shift, route<br />
lap, pointing out the schedule adherence;<br />
display of reports stored on the Microsoft<br />
SQL Server report server.<br />
The analysis and decision support<br />
component<br />
It has been designed and implemented for the<br />
ticketing system taking into account the<br />
specific requirements. Analysis<br />
instruments/reports took into consideration<br />
performance indicators, the e-ticketing<br />
system as a whole, based on historical data:
48<br />
<strong>REVISTA</strong> ROMÂNĂ <strong>DE</strong> AUTOMATICĂ<br />
system as a whole, based on historical data:<br />
• the structure of electronic travel cards usage;<br />
• client profiles;<br />
• incomes compared to costs;<br />
• fraud attempts;<br />
• comparative analysis of several<br />
transportation operators;<br />
• possible runtime errors in the operational<br />
system (OLTP).<br />
The analysis of these parameters will allow<br />
the users to visualize the weak points in the<br />
ticketing system and to adapt it in a timely<br />
fashion to real user requirements.<br />
The reporting component has the role of<br />
automatic report delivery toward designated<br />
users, by level of responsibility, and also of<br />
maintaining a report history.<br />
Figure 12 Ticketing and AVL reports<br />
Implementation of support applications for<br />
experimental purposes<br />
Figure 9 GIS/AVL graphic dispatcher<br />
Figure 10 Traffic planner for the buses and drivers,<br />
by laps and shifts<br />
Figure 11 SMARTBUS – OLTP and OLAP Integration<br />
Services. The analytical Server – multidimensional<br />
cubes<br />
The AVL simulator<br />
The application has been developped to<br />
respond to the need for coherent real-time<br />
data from vehicles in traffic, necessary for the<br />
development and testing of AVL and<br />
passenger information applications (the<br />
GIS/AVL dispatcher, the bus arrival<br />
prediction application) in laboratory<br />
conditions, without a real data source (a real<br />
bus equipped with the necessary hardware<br />
devices, to transmit positioning data in realtime<br />
from the field).<br />
In order to generate the data, primary points<br />
of known geo-coordinates (longitude and<br />
latitude) were used to define the shape of the<br />
route (modulation points, which allow a<br />
rough segment-based digitization of the<br />
route). An algorithm, simulating gradual<br />
acceleration of the bus as it leaves the station<br />
and slowing down when approaching the next<br />
station, manages to deliver a plausible dataset<br />
of geo-positions by interpolating through the<br />
known coordinates mentioned above. The<br />
speed of the vehicle gets a random value in 3<br />
set intervals (3 gears), simulating
<strong>REVISTA</strong> ROMÂNĂ <strong>DE</strong> AUTOMATICĂ<br />
49<br />
unpredictable traffic conditions specific to<br />
public transportation without a reserved<br />
traffic lane. The interface allows the user to<br />
configure a range of parameters that would<br />
enforce referential integrity of other data<br />
tables which are linked to the table where the<br />
simulated dataset is stored. After a test<br />
dataset has been generated, it is possible to<br />
visually verify its quality either in auto-play<br />
mode, or by testing individual points of<br />
interest, selectable in a table next to the map<br />
of the target region. If the dataset is<br />
considered to be accurate, it can be saved into<br />
the SQL Server database, thus becoming<br />
available for applications that require data<br />
simulating the bus movement.<br />
The application offers several viewing<br />
modes, both in data table form as well as in a<br />
table / interactive region map combination.<br />
By offering the possibility to configure the input<br />
data (line of transportation, day and hour,<br />
vehicle, the rate of transmission of the geopositions<br />
a.o.), to visualize and manually edit the<br />
generated records, the application is also usable<br />
as a working instrument for optimum georeferencing<br />
of the bus routes, calculation of<br />
station distances in space and time, for a better<br />
compatibility with the GIS application.<br />
Windows Mobile 6.0, Microsoft Analysis<br />
Services, NET Framework 2.0, Compact<br />
Framework 2.0, Office XP/2003 OWC<br />
(Office Web Components), Excel 2003, One-<br />
Click deployment, TCP/IP sockets.<br />
6. CONCLUSION<br />
In the proposed R&D area, the<br />
"SMARTBUS" project offers various<br />
implementations for public transport in a<br />
medium size city.<br />
Many complex systems have been<br />
developped and integrated, that can provide<br />
the basis for the infrastructure and for the<br />
informational framework for the<br />
improvement of the existing services for<br />
travellers and the introduction of new<br />
services.<br />
The back-office applications offers the<br />
informational support tools for the<br />
operational and strategic management process<br />
for the transportation services, which<br />
includes planning, management, reporting,<br />
correlation with real requirements, financial<br />
clearing for multi-operator transport services.<br />
The electronic ticketing system can<br />
contribute to an increased urban mobility,<br />
fraud control, and in a long term to the<br />
harmonization of the different transportation<br />
infrastructures and vehicles as well as of the<br />
multi-operator fare integration.<br />
Bibliografie<br />
Figure 13 The AVL bus position data simulation<br />
application window - the position data table and<br />
region map view<br />
5. Software technologies<br />
Software technologies are based on the<br />
Microsoft platform: Visual Studio.NET<br />
2005, Microsoft SQL Server 2005<br />
Enterprise with Reporting Services,<br />
Microsoft SQL Server Compact Edition,<br />
[1] ISO 14443, Identification cards –<br />
Contactless integrated circuit(s) cards<br />
[2] Sim, L.S.K., Seow, E.A.C. and Prakasam,<br />
S Implementation of an enhanced integrated<br />
fare system for Singapore (2003), Proc. RTS<br />
Conference, Singapore, 2003<br />
[3] Fleet solutions for the working world,<br />
CES Technologies, 2002<br />
[4] Developing Advanced Traveler<br />
Information Systems (ATIS), ITS America,<br />
2003<br />
AR4-8.doc
50<br />
<strong>REVISTA</strong> ROMÂNĂ <strong>DE</strong> AUTOMATICĂ<br />
A big support for small enterprises<br />
Since January 2008, it was created and operates in our country a network, Enterprise Europe<br />
Network Romania, a member of the European homonymous network, coordinated by DG<br />
Enterprise and Industry.<br />
Enterprise Europe Network Goal is to help small and medium enterprises to develop their potential<br />
for innovation and to raise awareness on the Commission's policies.<br />
This new initiative of the European Commission gives entrepreneurs a type unique inquiry office<br />
where it may require counseling and benefit from a wide range of easily accessible services to<br />
support business.<br />
Often, small businesses, particularly when they are at the beginning, do not have the resources to<br />
follow up the many types of assistance that can ensure the EU programs or are not always able<br />
to fully exploit the potential of innovation and market their products or to take advantage of<br />
new business opportunities, especially outside of those already known.<br />
Enterprise Europe Network covers this gap. With over 500 contact points and nearly 4 000<br />
employees with experience, it is the most extensive network in Europe that provides expertise and<br />
services for businesses. These are available to companies of any size, whether they are engaged in<br />
production or provide services, although it is targeted primarily to SMEs , research institutes,<br />
universities, technology centers, development and business innovation agencies.<br />
The network can help customers when they seek business partners, especially outside their own<br />
countries, to prepare individual visits on the premises to assess the needs of companies and provides<br />
advice on a broad range of commercial issues. A database check allows different points of contact<br />
to keep constantly in touch with each other and to match the offers with the requests for<br />
partnership.<br />
Although providing money directly to companies is not possible, the network can explain the<br />
funding opportunities that exist in the various EU programs, in a one-stop-shop for all services, to<br />
encourage knowledge-based economy.<br />
The advantage of Enterprise Europe Network is that all services are offered under a single<br />
entity, reducing bureaucracy and confusion that occur when nobody knows clearly to which<br />
organizations one should address a specific issue.<br />
Consequently, the network proposes in particular to encourage the knowledge-based community.<br />
Innovative processes not only allow companies to develop goods and services and decrease costs by
<strong>REVISTA</strong> ROMÂNĂ <strong>DE</strong> AUTOMATICĂ<br />
51<br />
improving production techniques, but may also contribute to energy efficiency - a priority which<br />
arrived quickly at the forefront of the EU agenda.<br />
The network provides not only the possibility of stronger synergies, but also of a greater proximity<br />
of potential customers.<br />
The large number of contact points in each geographic region makes entrepreneurs to benefit from<br />
assistance in business even "gate" company.<br />
In the 4 macro-regions of development of Romania, we have formed consortia with network<br />
partners.<br />
<strong>IPA</strong> is represented by two of its branches : <strong>IPA</strong> CIFFAT Craiova which is part of the consortium 4<br />
<strong>IPA</strong> Europe and <strong>IPA</strong> Galati Branch partner in the consortium ERBSN (2).<br />
The main services provided are:<br />
- Information about policies, programs and funding opportunities offered by the EU and help to<br />
obtain access to them;<br />
- Assist companies to identify potential trading partners, particularly in other countries;<br />
- Helping SMEs to develop new products, to access to new markets and inform them about<br />
activities and opportunities offered by the EU;<br />
- Advising SMEs to achieve transnational technology transfer;<br />
- Advise small enterprises in relation to some technical issues such as intellectual property rights,<br />
standards and legislation;<br />
- Act as a two-way road between entrepreneurs and decision makers of the EU, transmitting points<br />
of view in both directions.<br />
Author<br />
Dipl.eng. Florian UDRESCU<br />
Useful addresses:<br />
Enterprise Europe Network<br />
http://ec.europa.eu/enterprise-europe-network<br />
Direcţia Generală Întreprinderi și Industrie<br />
http://ec.europa.eu/enterprise/<br />
Agenţia Executivă pentru Competitivitate și Inovare (EACI)<br />
http://europa.eu/agencies/executive_agencies/eaci/index_en.htm<br />
Portalul IMM-urilor<br />
http://ec.europa.eu/enterprise/sme/<br />
Comitetul Regiunilor<br />
http://www.cor.europa.eu<br />
Comitetul Economic şi Social European<br />
http://eesc.europa.eu<br />
<strong>IPA</strong> CIFFAT Craiova<br />
• http://www.ipacv.ro/ro4een/<br />
<strong>IPA</strong> Sucursala Galati<br />
• http://www.ipagl.ro