0_ CUPRINS - IPA SA
0_ CUPRINS - IPA SA
0_ CUPRINS - IPA SA

Create successful ePaper yourself
Turn your PDF publications into a flip-book with our unique Google optimized e-Paper software.
RRA, Vol. XXIII, Nr. 1, 2010<br />
REVISTA ROMÂNĂ DE AUTOMATICĂ<br />
July-December 2010 Volume XXIII Number 1 ISSN 1454-9077<br />
PAPERS:<br />
The increase of human capital performance cause increase the organizational<br />
performance -ID 49763 pages 1-6<br />
Author: Roxana Antohi SC <strong>IPA</strong> <strong>SA</strong><br />
Traffic management solution to improve the fluency of traffic flow, road safety and<br />
security in urban areas pages 7-11<br />
Marius Minea, Radu Şerban Timnea, Telematics and Electronics for Transports Dept. (TET) University Politehnica<br />
of Bucharest, Transports Fac., 313, Splaiul Independenţei, Bucharest, Romania<br />
Carmen Eleonora Stan Ana-Maria Martin Andrei Iancu Dan Dumitrescu Institute for Computers (ITC-<strong>SA</strong>) Research<br />
Dept. 167, Calea Floreasca, Bucharest, Romania<br />
Some technical solutions related to integration of PV Modules in Existing Romanian<br />
Buildings pages 12-17<br />
Silvian Fara 1 , Dumitru Finta 1 , Mihai Iancu 1 , Laurentiu Fara 2 , Dragos Comaneci 3 , Ana-Maria Dabija 3 , Eugenia<br />
Tulcan- Paulescu 4 , Marius Paulescu 4 , Traian Jurca 5<br />
1 <strong>IPA</strong> <strong>SA</strong> Bucharest; 2 University ‘Politehnica’ Bucharest; 3 University of Architecture and Urbanism ‘Ion Mincu’,<br />
Bucharest; 4 West University Timisoara; 5 Politehnical University of Timisoara<br />
On MADM E-Course pages 18-23<br />
CORNEL RESTEANU 1 , MIHAELA RESTEANU 2 National Institute for Research and Development in Informatics<br />
(ICI) Economic Studies Academy<br />
Integrated transportation and raw material handling system based on RFID technology<br />
and wireless data transmission. A case study for thermo power industry pages 24-27<br />
eng. Marian Lăcraru, eng. Livia Ştefan, eng. Liviu Nicolae Jalbă, eng. Iolanda Costache, eng. Ovidiu Anicăi – ITC<br />
Bucuresti eng. dr. Eugen Pop – <strong>IPA</strong> Bucuresti<br />
Pluri-Vectors Renewable Energies & Hydrogen Complex Research, Educative, Training,<br />
Production Park, AT <strong>IPA</strong> <strong>SA</strong>, Bucharest. Pages 28-33<br />
Gheorghe Mincu Săndulescu, Univ. Professor Dr., Mariana Bistran, Principal Research Scientist, Florian Udrescu,<br />
Principal Research Scientist <strong>IPA</strong> <strong>SA</strong>, Bucharest,<br />
Hydrogen and Renewable Energies in fighting against the 3-rd Millenium crisis.<br />
Connections to the New European Directive on Renewables. Pages 34-43<br />
GHEORGHE MINCU SĂNDULESCU Univ. Professor Dr. Eng., <strong>IPA</strong> <strong>SA</strong>, FLORIAN FILIP<br />
Academician, Vice President of the Romanian Academy, Academia Română, MARIANA BISTRAN Principal<br />
Research Scientist <strong>IPA</strong> <strong>SA</strong>, FLORIAN UDRESCU Principal Research Scientist <strong>IPA</strong> <strong>SA</strong>, Cornelia BISTRAN<br />
University of Medicine and Pharmacy “ Carol Davila “<br />
Measurement methods regarding the quotations of a Permanent GNSS station in<br />
altitudinal system MN 75 pages 44-53<br />
PhD. Eng STOIAN Ioan , PhD. Eng. OLARU VIRGIL<br />
ZONING OF AREAS AND POPULTED CENTERS FOR REDUCING THE EFFECTS OF<br />
NATURAL DI<strong>SA</strong>STERS pages 54-63<br />
PhD. Eng STOIAN Ioan , PhD. Eng. OLARU VIRGIL
• <strong>IPA</strong> <strong>SA</strong> - - in cadrul proiectului "Cresterea performantelor capitalului uman premiza pentru cresterea<br />
performantelor organizationale" Proiect cofinantat din Fondul Social European prin "Programul<br />
Operational Sectorial Dezvoltarea Resurselor Umane 2007-20013- Investeste in oameni este<br />
interesata de urmatorul pachet de servicii de instruire : Dezvoltare competente cheie comune tuturor<br />
ocupatiilor ce contine urmatoarele module :<br />
1. Comunicare si Managementul timpului<br />
2 Accesare fonduri structurale<br />
3 Formator<br />
Durata de desfasurare a pachetului de instruire trebuie sa fie 10 zile periodele sunt iulie –octombrie 2010<br />
si noiembrie 2010 –februarie 2011 si locatiile sunt Bucuresti , Cluj si Craiova<br />
Pentru informatii suplimentare : Cristina Ogescu tel 021380032<br />
Anuntul este valabil pana in data de 15 iulie 2010<br />
• <strong>IPA</strong> <strong>SA</strong> - - in cadrul proiectului "Cresterea performantelor capitalului uman premiza pentru cresterea<br />
performantelor organizationale" Proiect cofinantat din Fondul Social European prin "Programul<br />
Operational Sectorial Dezvoltarea Resurselor Umane 2007-20013- Investeste in oameni este<br />
interesata de urmatorul pachet de servicii de instruire EXPERT TEHNIC EXTRAJUDICIAR si<br />
CONSULTANT<br />
Pentru informatii suplimentare : Cristina Ogescu tel 021380032<br />
Anuntul este valabil pana in data de 15 august 2010<br />
• <strong>IPA</strong> <strong>SA</strong> - - in cadrul proiectului "Cresterea performantelor capitalului uman premiza pentru cresterea<br />
performantelor organizationale" Proiect cofinantat din Fondul Social European prin "Programul<br />
Operational Sectorial Dezvoltarea Resurselor Umane 2007-20013- Investeste in oameni este<br />
interesata de urmatorul pachet de servicii de instruire Cursuri pentru domeniul calitatii si mediului<br />
(Auditori si specialist in domeniul calitatii, Manager si auditor sisteme de mediu ,Specialist in<br />
domeniul deseurilor si Auditor pentru sisteme de management al sanatatii si securitatii<br />
ocupationale )<br />
Pentru informatii suplimentare : Cristina Ogescu tel 021380032<br />
Anuntul este valabil pana in data de 15 octombrie 2010<br />
• <strong>IPA</strong> <strong>SA</strong> - - in cadrul proiectului "Cresterea performantelor capitalului uman premiza pentru cresterea<br />
performantelor organizationale" Proiect cofinantat din Fondul Social European prin "Programul<br />
Operational Sectorial Dezvoltarea Resurselor Umane 2007-20013- Investeste in oameni este<br />
interesata de urmatorul pachet de servicii de instruire Expert fiscal<br />
Pentru informatii suplimentare : Cristina Ogescu tel 021380032<br />
Anuntul este valabil pana in data de 15 decembrie 2010<br />
• <strong>IPA</strong> <strong>SA</strong> - - in cadrul proiectului "Cresterea performantelor capitalului uman premiza pentru cresterea<br />
performantelor organizationale" Proiect cofinantat din Fondul Social European prin "Programul<br />
Operational Sectorial Dezvoltarea Resurselor Umane 2007-20013- Investeste in oameni este<br />
interesata de urmatorul pachet de servicii de instruire Inspector protectia muncii<br />
Pentru informatii suplimentare : Cristina Ogescu tel 021380032<br />
Anuntul este valabil pana in data de 15 decembrie 2010<br />
• <strong>IPA</strong> <strong>SA</strong> - - in cadrul proiectului "Cresterea performantelor capitalului uman premiza pentru cresterea<br />
performantelor organizationale" Proiect cofinantat din Fondul Social European prin "Programul<br />
Operational Sectorial Dezvoltarea Resurselor Umane 2007-20013- Investeste in oameni este<br />
interesata de urmatorul pachet de servicii de instruire Limba engleza pentru avansati<br />
Pentru informatii suplimentare : Cristina Ogescu tel 021380032<br />
Anuntul este valabil pana in data de 15 februarie 2011<br />
1
The increase of human capital performance cause increase the organizational performance<br />
-ID 49763<br />
Author: Roxana Antohi SC <strong>IPA</strong> <strong>SA</strong><br />
Introduction<br />
As we know is necessary a real political to use EU funds for invest “ in public and private property for<br />
generate economic growth and real development of Romania and thus to support long –term of interest of our<br />
country<br />
In OPERATIONA L SECTORIAL HUMAN RESOURCES DEVELOPMENT PROGRAMME 2007<br />
2013 <strong>IPA</strong> <strong>SA</strong> has present a project in March 2009 for state aid scheme for training general and specific ID 77<br />
within 3.2 "Training and support for companies and employees promoting adaptability "-training general<br />
Today organizations are not only valued according to quality. The modern organization is valued beyond its<br />
economic performances, quality management and communication policy and depending on the contribution to social<br />
life<br />
From the legal point of view, a company is a legal entity , the concept of Corporate Social Responsibility CSR<br />
underlines the size of "person" at the expense of the "legal “.In other words, ask the company as a "person" to be a<br />
citizen, a resident of the city, member of the local community. Each company operates in a competitive context<br />
which significantly affects its ability to meet its strategy , especially for long term . Social conditions are an<br />
important part of this context Competitive context has much less attention than the impact of the production chain,<br />
but may have a much greater strategic importance for both business and society.<br />
In conclusion we can say that by this project SC <strong>IPA</strong> <strong>SA</strong> invests in its people<br />
Project Presentation<br />
.<br />
The overall objective of the project is to help strengthen corporate competitiveness <strong>IPA</strong> <strong>SA</strong>, through<br />
training of employees in order to increase adaptability to the pressures caused by economic and social environment<br />
in constant change.<br />
Through the socio-economic impact of the training program, the project will contribute to achieving<br />
priority axis 3, "Training and support for companies and employees to promote adaptability. "Increasing the level of<br />
specialization of workers and improving access and participation in continuing training, will generate positive effects<br />
on medium and long term both at the organization and for each employee who will attend.<br />
The specific objective of the project is to increase skill levels of employees by improving access and<br />
participation in training programs<br />
Development of general skills meet increasingly complex demands in the work process.<br />
The skills distribution of the participants in courses concerned are :<br />
- Auditors in quality field. Initiation and training- COR code 242303; Will follow the course<br />
four employees<br />
- Specialist in quality field - COR code 242 301 Will follow the course one employee<br />
2
.<br />
- Environmental systems manager COR code 242304 ; Will follow the course four employees<br />
- Environmental auditors. Initiation and training COR code 242305 Will follow the course ten<br />
employees<br />
- Waste Management Specialist COR code 242319. Will follow the course five employees<br />
- Extrajudicial technical expert and consultant COR code 24180 Will follow the course six<br />
employees<br />
- Management systems auditors for occupational health and safety. Initiation and training COR<br />
code 242317 Will follow the course eight employees<br />
- Tax Expert COR code 241178 Will follow the course seven employees<br />
- Developing core competencies common to all occupations which will contain the following<br />
modules<br />
1. Communication and Time Management<br />
2. Structural funds<br />
3. Trainer<br />
- Work safety inspector COR code 241204. Will follow the course two employees<br />
- Using computers, ECDL certification Will follow the course twenty employees<br />
- English Advanced course Will follow the course fifteen employees<br />
The primary benefit of achieving specific objective of the target group - employees of <strong>IPA</strong> <strong>SA</strong> lies in harnessing<br />
individual potential and developing individual capability to cope with the dynamics of social, economic, political,<br />
cultural, scientific and technological.<br />
In addition, it develops the ability to analyze, evaluate, make quick decisions and be accountable for individual<br />
results but also of the team under severe pressure , without erode the quality of human capital<br />
Projects Activities<br />
The project is designed so that its activities to materialize the identified needs of target group and lead to results<br />
which minimize or eliminate the causes that have generated needs<br />
Achieving these activities will lead to the overall objective and specific project<br />
.<br />
The First activity<br />
:<br />
1.1 Seminar presentation of the project –<br />
1.2 Article in a magazine<br />
1.3 Poster<br />
The second activity “ General organization of courses in the firs four months of the project (July –October 2010):<br />
2.1 Advisory services on project selection and training<br />
2.2 The training courses<br />
Drafting of necessary documentation and training process for each course will be as follows:<br />
Using Computer and Managing Files<br />
<br />
<br />
Word processing (Microsoft Word)<br />
Information and Comunication (Internet and E-mail) first part<br />
2.3 The Delivery courses<br />
Using Computer and Managing Files<br />
<br />
Word processing (Microsoft Word) first part<br />
Developing core competencies common to all occupations in two groups Bucuresti and Craiova<br />
<br />
Extrajudicial technical expert and consultant - COR Cod 241801 ;<br />
2.4 Course Evaluation Raports<br />
3
The third activity “ General organization of courses in four months (November –February 2011):<br />
3.1 Advisory services on project selection and training<br />
3.2 The training courses<br />
Drafting of necessary documentation and training process for each course will be as follows:<br />
Information and Communication (Internet and E-mail) last part<br />
3.3 The Delivery courses:<br />
Word processing (Microsoft Word) last part<br />
Information and Communication (Internet and E-mail)<br />
Specialist in quality field COR Cod 242301<br />
Environmental auditors. Initiation and training COR Cod 242305<br />
Management systems auditors for occupational health and safety. Initiation and training COR<br />
code 242317<br />
Developing core competencies common to all occupations in Cluj –Napoca<br />
Work safety inspector COR Cod 241204<br />
3.4 Course Evaluation Raports<br />
The four Activity General organization of courses in four months (March –June 2011 ) 2010<br />
4. 1 Advisory services on project selection and training<br />
4. 2 3 The Delivery courses:<br />
Auditors in quality field. Initiation and training- COR code 242303;<br />
Waste Management Specialist COR code 242319;<br />
Environmental systems manager COR code 242304.<br />
Tax Expert COR code 241178;<br />
English Advanced course<br />
4.3 Course Evaluation Raports<br />
The fith Activity Project Completion<br />
5.1 Dissemination of results in a final seminar<br />
Article in local press<br />
Final Raport<br />
For all external courses will choose foreign suppliers based on selection of tenders. Eligibility condition is that<br />
suppliers be accredited to issue certificates CNFPA to issue certificates of graduation rates. Recruitment activities<br />
and selection of suppliers is in : Advisory services on project selection and training<br />
The Courses content for use of computer and English, it will be making by each trainer , a training needs analysis to<br />
establish the knowledge gap to fill, level of each participant. The courses will be built under the average<br />
accessibility of the target group.<br />
This investigation is based on a multiple choice question and a questionnaire for each course.<br />
Making the questionnaire, data collection and processing takes two weeks for each course module. Training course<br />
supports respectively and drafting documentation, exercises and auxiliary materials necessary training process will<br />
be ongoing for each course in part, an estimated time schedule stipulated in the activity schema .<br />
.<br />
Delivery Courses will be based on a delivery schema throughout the project, in chronological order of their<br />
support. Delivery is presented quarterly distribution . Effective provision of courses will cover about 10 months.<br />
Each course ends with examination of knowledge in order to emphasize the qualitative leap in the assimilation of<br />
information, every course of the activity 2, 3 and 4 will take into consideration how many achieve a progress report<br />
on evaluation of the participant satisfaction in relation to content and how was organization<br />
.<br />
4
Results which we expect to end of the project<br />
- Increasing institutional capacity and competitiveness <strong>IPA</strong> <strong>SA</strong>, to face the challenges imposed by<br />
changes in national and international business, expressed by increasing efficiency indicators of<br />
contracting by 10% the number of agreements / number of employees in 2011 compared to 2008:<br />
- Acquiring new technical skills certificates in the same area of employee occupational SC <strong>IPA</strong> <strong>SA</strong>:<br />
increase from 16% to 66% of all certified personnel competent Employees<br />
- Increasing adaptability of career growth in line with the needs of the organization's performance;<br />
- Decrease the rate of fluctuation of labor under <strong>IPA</strong> <strong>SA</strong> from 10% in 2008 to 7% in 2011/2012..<br />
- Reduction in the incidence of conflict and increase cohesion among team members, develop leadership<br />
skills, increase motivation and involvement in the organization's goals<br />
- Demonstrating teamwork and certification of trainers in accordance with the European CV format<br />
- Create a team for setting up technical traning center<br />
We estimate that these results can be expected afactate risk of abandonment. The Voluntary abandonment risk is<br />
covered by signing a participation agreement by employees involved in the project. Ensuring workplace risk<br />
prevents voluntary abandonment of the program and ensure employee involvement in the project, which contributes<br />
to the project success. Regarding the risk of abandonment involuntary, based on previous experience, we estimate a<br />
risk of being involuntarily as more than 5% and maximum 6 persons<br />
Dissemination of project results will be made by ::<br />
- Web site dedicated to the project which will be the main objectives pursued by the project, as well as partial and<br />
final results obtained during the project;<br />
- Project presentation and results obtained in two seminars organized at the beginning and end project<br />
- Press article<br />
Resources allocated for project implementation :<br />
Material resources, existing human and financial <strong>IPA</strong> <strong>SA</strong> provides its base material for the project which includes<br />
training rooms equipped with projector sceen flipchart , blackboard network with acces to Internet for about 25<br />
people ( in Bucharest and all branches of the country )<br />
Human resources of the project consist of three members of the project implementation team, advising on training<br />
project and the three internal trainers<br />
Financial resources are provided by non-reimbursable financial assistance requested for this project that will add<br />
co-provided by <strong>IPA</strong> <strong>SA</strong><br />
Project Manager<br />
• Project management system will provide the five basic elements for its success :<br />
• Planning: to elaborate the project plan to achieve the characteristics of unity, continuity,flexibility and<br />
precision<br />
• Organization: to establish the structure material, financial and human resources necessary for project<br />
• Leadership: to create appropriate organizational structures to achieve objectives<br />
• Coordination: made link, unify and harmonize all activities and efforts<br />
• Control: surveillance project done so that everything is conducted in accordance with established rules and<br />
orders submitted.<br />
• Implementation team consists of project manager ,responsable for financial and human resource<br />
The project will comply with procedures and quality assurance system EN ISO 9001:2001<br />
Project implementation team will coordinate the project through :<br />
Coordination and evaluation meetings: be organized to assess progress of the project, compliance with work<br />
schedules, deadlines, and estimated expenses incurred, and estimated resources allocated to ensure decisions and<br />
determining project success. It organizes monthly.<br />
workshops: is held whenever necessary in order to solve problems arising in the project. At the end of the project<br />
Will end with reports that will be used to assess the project execution<br />
5
Project sustainability is ensured by the fact that <strong>IPA</strong> <strong>SA</strong>, using experience gained in national and<br />
European project and certification of personnel, will try to continue establishing a training center for employees in<br />
the industry. Within this center, through training activities, the applicant will contribute to promoting and certifying<br />
professionals professions and technical skills to develop occupational standards, respectively.<br />
.<br />
Transferability <strong>IPA</strong> <strong>SA</strong> initiated the project results through seminars and press articles, the site, some results can be<br />
transferred by providing training to other economic agents who are interested in raising the level of training and<br />
acquiring new technical skills and conceptual their employees in niche areas that it covers the applicant, namely<br />
automation, information technology (ICT) and environmental<br />
Integrated approach. In accordance with the policies and experience in mainstreaming project results will be a<br />
prerequisite for equal participation of both the training process and the other project activities for people who want to<br />
become permanent trainers in the training center will continue to be founded using results obtained in this project<br />
Financial sustainability. For further professional training in the years following the end of the project, the<br />
applicant will use its own funds. As a training provider to other users in industry and environmental protection will<br />
provide extensive training and internal funds from these collections<br />
Equal Opportunities For <strong>IPA</strong> <strong>SA</strong> social responsibility a priority in the strategic development and there is a constant<br />
concern that by training to ensure equal opportunities not only vulnerable age groups, but to ensure equal<br />
opportunities for women and men.<br />
Equal Opportunities The structure aims to answer the needs of target group specific training for youth career<br />
development, but also provide opportunities to adapt to social and economic changes of the internal environment and<br />
external technical organization for people over age 50<br />
It aims at providing conditions that allow access and participation of target group of employees in the activities of<br />
the <strong>IPA</strong> project and to avoid discrimination on any grounds: gender, age, race, religion etc.<br />
6
Traffic management solution to improve the fluency of traffic flow,<br />
road safety and security in urban areas<br />
Marius Minea,<br />
Radu Şerban Timnea<br />
Telematics and Electronics for Transports Dept. (TET)<br />
University Politehnica of Bucharest, Transports Fac.,<br />
313, Splaiul Independenţei, Bucharest, Romania<br />
Carmen Eleonora Stan<br />
Ana-Maria Martin<br />
Andrei Iancu<br />
Dan Dumitrescu<br />
Institute for Computers (ITC-<strong>SA</strong>)<br />
Research Dept.<br />
167, Calea Floreasca, Bucharest, Romania<br />
Abstract — This paper presents a integrated solutions with the<br />
purpose of increasing the road traffic safety and security, via an<br />
intelligent management of sensor data and image fusion. The<br />
integrated platform for traffic safety monitoring includes a sensing<br />
section, equipped with non-intrusive sensors and a camera for data<br />
collection, a central dispatching computer and connections with the<br />
traffic controllers.<br />
The novelty of the system consists in the solutions adopted, including<br />
the mobile data collection facilities, available on handheld devices for:<br />
(i) field data acquisition (ii) traveler information via Internet, along the<br />
roadways.<br />
The components that are integrated result in synergetic effect in<br />
service oriented solution for improving traffic flow and reducing<br />
congestion in the cities, useful for decision-makers and for citizens.<br />
Keywords – signalling infrastructure; sensor; safety;<br />
reliability; operability.<br />
I. INTRODUCTION<br />
Road transport for people and freight represents the<br />
dynamical factor, the key element of knowledge based<br />
economy and social cohesion. Within the past decades there<br />
has been a continuous growth of the number of private<br />
transportation vehicles while the public transportation has<br />
been in a continuous decline. The current transportation<br />
infrastructure no longer copes with the demand.<br />
Accidents and congestions caused by the traffic have<br />
a bad influence on the quality of life, lower the productivity<br />
and diminish the energy. The traffic congestion, which<br />
determines environmental problems and accidents, is getting<br />
worse. The benefit of the road transportation is decreasing<br />
more and more every day, due to the side effects (pollution<br />
and accidents) the result being a vicious circle in the public<br />
transport. In the last few years the density of the traffic in<br />
the big cities of the developed countries has reached<br />
impressive quotas.<br />
If the right corrective measures are not taken, the cost<br />
of traffic jams will represent, by 2010, 1% of the gross<br />
revenue of the EU and will worsen the link between central<br />
markets and neighboring regions. The transportation sector<br />
is a major source of air pollution.<br />
The solution presented here describes a technological<br />
platform, of European standards level, able to be used to<br />
collect on line information concerning road traffic, in an<br />
urban street network. The platform will integrate on line<br />
road traffic information, representing main traffic<br />
parameters, transmitted by the traffic data collection<br />
systems, GIS environment featured digital maps,<br />
multimedia technologies able to directly show the traffic<br />
conditions and broadband wireless communications to set<br />
up an advanced procedure for traffic monitoring. This will<br />
be a premise for the improvement of the life of the<br />
inhabitants and of the traffic participants in an urban area.<br />
The platform will be set up of the following<br />
components:<br />
• Traffic information data collection subsystem, with<br />
non intrusive sensors (PIR) and video cameras,<br />
aimed to monitor traffic conditions<br />
• Communication system based on the items<br />
providing remote data communication and several<br />
field items control; information concerning traffic<br />
related parameters will be transmitted via either<br />
GPRS or internet and images will be provided by<br />
video cameras using IP based communication<br />
technologies<br />
• Central dispatcher, set up of the main processing<br />
systems which will concentrate the data from field<br />
devices. These will run specialized programs in<br />
order to provide system user interface. These will<br />
also allow estimating the congestion rate of the<br />
road traffic, to make small short time predictions<br />
and statistic reports.<br />
• Web information portal enabling system users to<br />
access updated data, related to the monitored street<br />
network status, traffic levels and routing<br />
information towards different points of interest and<br />
obstructions on chosen paths. The information will<br />
be accessed both from fixed locations and from<br />
mobile devices, during the vehicles movement.<br />
7
sections (excepting the Introduction), starting with the with<br />
the presentation of the state of art in the field, the<br />
concept/architecture of the system, results of some field tests,<br />
and conclusions regarding the advantages that the solution<br />
presents.<br />
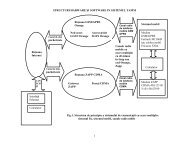
Fig 1. <strong>SA</strong>FETRAFF – General architecture<br />
On line monitoring of the road vehicles flow and the<br />
detection of the traffic incidents will be accomplished by<br />
installing several web cameras provided fixed IP and<br />
featuring images storage on a central server. Collected data<br />
will be on line transmitted to the data server, installed at the<br />
premises of the Monitoring and Control Center. The<br />
information will be accessed by fixed or mobile devices<br />
The pilot system has been tested in several cities of<br />
Romania, namely Suceava, Sibiu and Bucharest.<br />
There are many levels where such systems may be<br />
implemented, depending on the traffic volumes, starting<br />
from the simple static signaling systems and going up to<br />
management systems based on complex algorithms that<br />
consider a series of key factors. There are, also, several ways<br />
that the traffic fluency, safety and the level of emissions can<br />
be kept under control . Studies and implementations of<br />
different traffic management systems, combined with<br />
geometric re-arrangement of the road infrastructure showed<br />
that the best approach is to employ a combined strategy: with<br />
a contribution of 5% to 15% in traffic fluency improvement,<br />
the Urban Traffic Control systems cannot be completely<br />
effective without introducing also modifications in the road<br />
geometry, or other factors that help increase overall road<br />
infrastructure capacity. However, the less expensive in this<br />
equation is the introduction of intelligent transport systems<br />
technologies. Recently, Multimodal Real Time Traffic and<br />
Travel Information (RTTI) [2] services proved to be an<br />
effective instrument to decrease energy consumption in<br />
urban areas across the different modes of transport, by<br />
changing the mobility behavior (the modal shift) for the<br />
single traveler. The European Union has also a permanent<br />
concern in reducing the number of traffic incidents and<br />
injuries. The EC documents [1], related to traffic, clearly<br />
state that road safety is one of the major concerns and<br />
“finally, users expect more rational transport in towns and<br />
cities. Noise and air pollution and their effects on health are<br />
of greater concern in towns and cities, and a clear line needs<br />
to be drawn urgently between the respective roles of private<br />
cars and public transport.” The paper is structured in four<br />
II.<br />
CONCEPT AND SYSTEM’S ARCHITECTURE<br />
Safetraff system is designed to produce relevant safety<br />
and quantitative information regarding the road traffic itself.<br />
This contributes to traffic safety, having embedded specific<br />
functions for law enforcement.<br />
The architecture traffic monitoring subsystem consists of<br />
the following functional components:<br />
• The data collection component;<br />
• The central dispatcher component;<br />
• The CCTV (web-based) component for traffic<br />
monitoring and video management of traffic<br />
incidents;<br />
• The web interface.<br />
Fig. 2 The functional architecture of the traffic information subsystem<br />
Figure 2 depicts the physical architecture of the<br />
“SafeTraff” platform. The main part is the infrastructure for<br />
data collection. This component employs non-intrusive,<br />
passive infrared (PIR) sensors for vehicle sensing. Specific<br />
modules employ local data processing in order to build<br />
traffic information messages that are sent in specific blocks<br />
to the communication functional block. The vehicle sensors<br />
are capable of detecting presence, occupancy, speed, and<br />
vehicle classification. These categories of traffic sensors do<br />
not need civil construction works for mounting, therefore<br />
their installation costs is being kept low. The sensors are<br />
used to form data messages from each intersection, which<br />
are locally processed in a special unit, called device for<br />
traffic data processing and communications (TDPC). The<br />
device also ensures the local power supply control, local<br />
communications with the sensors and the communication<br />
monitoring with the central dispatcher unit. The set of<br />
detection sub-systems communicate via the same GSM<br />
GPRS network with the central computer. Data from the<br />
sensors is locally stored in a temporary memory (for safety<br />
purposes) and periodically read (each 5 s – to 5 min,<br />
configurable). A specific set of messages containing<br />
information regarding the number of vehicles counted,<br />
classification, the degree of occupancy etc. is formed after.<br />
8
This set of messages is forwarded via the wireless<br />
communication to the central dispatcher computer, where<br />
they populate a specific database.<br />
Fig 3 The architecture of the central component (Traffic Information<br />
Subsystem)<br />
The architecture of the central component is depicted in<br />
Figure 3. The central component allows for information<br />
storage, reporting, GIS presentation of information and<br />
information regarding the intersection level of service. The<br />
messages received via GPRS from the Data Collection Sub-<br />
System are translated into coherent information which is<br />
afterwards associated with the position of the sensors on a<br />
GIS, so that the operator and the external users can see, via a<br />
web connection, the traffic density in the network. As<br />
mentioned before, the system is able to calculate the level of<br />
service in a junction: it counts the number of vehicles and<br />
compares this information with a specific set of values.<br />
According to the comparison results, a message is produced<br />
and distributed to a VMS installed in the field. The following<br />
table presents the levels of service associated to an<br />
intersection. The level of service is an important indicator of<br />
congestion:<br />
Qv<br />
LS= (1)<br />
C<br />
In Equation (1), LS represents the level of service, Q v the<br />
actual vehicle flow in vehicles per hour [veh/h], or traffic<br />
volume, and C the capacity [veh/h] of the intersection.<br />
Another important indicator that the subsystem uses is<br />
the occupancy degree, measured as percent of time when a<br />
traffic sensor is occupied by a vehicle, divided to the period<br />
of time considered.<br />
O= (2)<br />
T<br />
where O represents the occupancy, τ<br />
v<br />
the duration of time<br />
when a vehicle is in the sensor detection area and T<br />
represents the total measurement interval (e.g. 24 h). Table 1<br />
below presents the standardized levels of service categories,<br />
dependant on the traffic volumes.<br />
τ<br />
v<br />
Level of<br />
service<br />
category<br />
TABLE I.<br />
LEVEL OF SERVICE DEFINITIONS<br />
Specifications<br />
Traffic volumes /<br />
capacity ratio<br />
A Free vehicle flowing 0 – 0,60<br />
Mild congestion, without<br />
B hindering the changing of one 0,61 – 0,70<br />
lane to the other<br />
C<br />
Crowded, but the flow of 0,71 – 0,80<br />
vehicles has a stable motion<br />
The flow of vehicles begins to<br />
have irregularities regarding<br />
D<br />
0,81 – 0,90<br />
speed. Changing lane is more<br />
difficult.<br />
Maneuvering very limited.<br />
E<br />
Unstable flow of traffic. Long<br />
queuing that produces delays<br />
0,91 – 1,00<br />
at transit intersections.<br />
F<br />
Traffic jam. Travel in small<br />
hops. Large delay in transit<br />
intersections. Queues are long<br />
and occupy the upstream<br />
intersections. In extreme cases<br />
traffic volumes fall to zero.<br />
≥ 1,01<br />
Due to the level of service, a specific intersection will be<br />
able to deliver transit times directly dependent on the traffic<br />
volumes. The typical delays recorded, as functions of the<br />
levels of service are presented in table 2.<br />
TABLE II.<br />
DELAY FOR TRANSITING A JUNCTION, ACCORDING TO THE<br />
LEVEL OF SERVICE<br />
Delay experienced for transiting<br />
Level of<br />
the junction<br />
service<br />
[s]<br />
A < 5<br />
B 5 ÷ 15<br />
C 15 ÷ 25<br />
D 25 ÷ 40<br />
E 40 ÷ 60<br />
F > 60<br />
Due to its experimental phase, the system is now<br />
calibrated at selecting three levels of congestion, in-between<br />
A-B levels (”Free flowing”), C-D levels (”Congestion”) and<br />
E-F (”Traffic Jam”).<br />
For the safety monitoring purpose, the SafeTraff system<br />
has also a module for the detection of traffic incidents (like<br />
crossing the red light by a vehicle). For this functionality, a<br />
logical ”AND” has been defined between the moment where<br />
a red light for a certain direction is on and a vehicle crosses a<br />
”virtual loop” marked after the pedestrian crossing. When<br />
these two conditions are true in the same time, a sequence of<br />
video frames is recorded (three seconds before and after the<br />
incident), in order to use them as a proof in post traffic<br />
incident analysis.<br />
III.<br />
FIELD TESTS OF THE COMPONENTS<br />
In order to ensure that the system hardware components<br />
are functioning properly, a series of tests have been<br />
performed, both in the laboratories and in the field. The field<br />
9
tests were oriented mostly to check the accuracy of the<br />
sensors and the possibility of functioning in outdoor<br />
conditions for the specific equipment. These outdoor tests<br />
were carried on in Bucharest, in urban environmental<br />
conditions (above an underground passage), employing a set<br />
of 3 PIR sensors, and on a highway (for high vehicles’<br />
speeds conditions in extra-urban traffic), on a bridge located<br />
on A1 highway.<br />
• Automatic data acquisition of information with<br />
specific sensors mounted in the traffic controllers<br />
(items and status to be controlled: opening of the<br />
front door of the traffic controller cabinet, presence<br />
and voltage of the power supply, different stages of<br />
the traffic controller etc.);<br />
• The integration of the management for all resources,<br />
with emphasize to the operator’s assistance;<br />
• Design of a versatile web portal for the information<br />
of the authorized operators and users and with<br />
selected information for all users of the urban road<br />
signaling infrastructure (large public);<br />
• Design of a traffic information subsystem for safety<br />
monitoring (includes traffic parameters measurement<br />
and video streaming of the locations).<br />
Employing the special developed webpage for the traffic<br />
safety component, an external user will be able to access<br />
information regarding the traffic conditions in the area of<br />
travel , or regarding road closures, incidents, weather reports<br />
etc. The video streaming ensures direct observation of<br />
selected locations.<br />
Fig. 4 The physical architecture of the test system<br />
Figure 4 presents the general physical architecture of the<br />
test system that was employed. The PIR sensors drive<br />
modules are used to temporarily store data streams from the<br />
sensors and to communicate locally with the Data<br />
Acquisition and Communication Device. Here the messages<br />
are concatenated and transmitted centrally to the dispatching<br />
point via the GPRS modems. The tests showed good<br />
functionalities of the system. A very important influence in<br />
the precision of the system has the way the sensors are<br />
mounted, as significant errors of vehicles lengths and speeds<br />
can occur if the height and tilting of the PIR sensors are not<br />
correct. The measurements and tests performed in Bucharest<br />
and environment showed appropriate results for the<br />
necessities of the system. The errors recorded in vehicles<br />
speeds and lengths measurements were corrected by<br />
adjusting the positions of the sensors. Also, the components<br />
showed a good performance in high EM environment.<br />
IV.<br />
CONCLUSIONS<br />
The novelty of the adopted solution consists of several<br />
approaches designed to improve efficiency and to add more<br />
services in a single application.<br />
One advantage is that the integrated platform is designed<br />
to be scalable and configurable, according to the signaling<br />
infrastructure equipments used. There are several specific<br />
components, with specific or improved design, as following:<br />
• A geo-referenced database containing information<br />
regarding the type, location, technical and functional<br />
specifications and information regarding the<br />
maintenance scheduled for all types of road<br />
signaling elements and markings;<br />
Fig. 5 Screenshot from the GIS application SafeTraff<br />
As a whole, the solution presented for traffic and<br />
signaling infrastructure safety is considered an innovative<br />
and economic approach for small and medium cities , where<br />
the necessity for traffic information systems is important and<br />
the authorities do not wish, or do not have the possibility of<br />
spending big amounts of funding. With minimal investment<br />
and a scalable architecture, the solution presented here can<br />
satisfy the necessity of increased road safety and can<br />
contribute to the reduction of accidents and injuries due to<br />
road traffic, to the decrease of stress that participants to<br />
traffic may experience when arriving at a congested<br />
intersection where the traffic lights fail to operate.<br />
ACKNOWLEDGMENT<br />
The authors would like to thank all partners involved in<br />
the projects (SC SIAT <strong>SA</strong>, CEPETET, ULB Sibiu ) for their<br />
fruitful cooperation and results obtained.<br />
10
REFERENCES<br />
[1] * * *. “White Paper. European Transport Policy for 2010: Time to<br />
Decide”. Commission of the European Communities, Brussels,<br />
12.9.2001. COM (2001) 370 Final.<br />
[2] * * * . ICT PSP Support Programme, CIP-ICT-PSP-2008-2, ICT for<br />
Addaptive Urban Transport Management Infrastructure and Services.<br />
Project 238880: “Intelligent and Efficient Travel Management for<br />
European Cities – In Time”<br />
[3] Minea, M., Stan, G., and Nemţanu, F. C. “Incidence of New<br />
Telematic Systems for Treansports in Romanian Information<br />
Society”. Proceedings of ICCC 2004 (International Conference on<br />
Computers and Communications) – University of Oradea, Baile Felix,<br />
27-29 Mai 2004, pp.248-254;<br />
[4] Alexandrescu, C. M., Stan, G., and Minea, M. „Managementul<br />
centralizat al traficului rutier urban”. 214 pag., Centrul Tehnic<br />
Editorial al Armatei, Bucureşti 2007;<br />
[5] Alexandrescu, C. M., Minea, M. and Gheorghiu A. R. – „RoSaRo – A<br />
Platform for Increasing the Intrinsic Reliability of the Road<br />
Signalling Infrastructure”, Ecellence Research Conference – A Way<br />
to Innovation (CEEX 2008), Volume 1, pp. 45-1 – 45-6, ISSN 1844-<br />
7890, Braşov, Romania, 27-29.07.2008;<br />
[6] Minea, M. and Cormoş, A. C. „EMC and Related Problems in the<br />
Implementation of Urban Traffic and Public Transport Management<br />
Systems in Several Cities of Romania”. ICATE 2006 (8 th International<br />
Conference on Applied and Theoretical Electricity – Băile Herculane,<br />
26-28.10.2006) Anelele Universităţii din Craiova, Anul 30, nr. 30,<br />
2006, Ed. Universitaria 2006, pp. 73-78, ISSN 1842 – 4805; (2006)<br />
Craiova;<br />
[7] Minea, M. and Dumitrescu, S. „Vehicle to Infrastructure<br />
Communications – Technologies and EMC Problems in Public Transport<br />
Management System”. IEEE 9 th International Conference on<br />
Telecommunications in Modern Satellite, Cable and Broadcasting<br />
Services. TELSIKS 2009, Niš, Serbia, 7- 9 October 2009;<br />
[8] Minea, M. „Implementation of the Bucharest Traffic Management<br />
System – solutions to problems and In-Time Project” – Invited speaker at<br />
16 th World ITS Congress, Special Interest Session SIS 33, Stockholm,<br />
Sweden, 21-25 September 2009<br />
[9] Stan, C. E., Minea, M., Gheorghiu, R. A., and Popa, T. „Sistem on-line<br />
de monitorizare a traficului rutier pentru asigurarea siguranţei şi fluenţei<br />
circulaţiei în aglomeraţii urbane şi îmbunătăţirea calităţii vieţii”- ITS<br />
Romania 2009 Conference & e-CALL Workshop”, Bucharest, 2009.<br />
[10] * * *. “Safetraff. On-Line System for Road Traffic Monitoring, Traffic<br />
Fluency and Safety Provision and Life Quality Improvement”, Project<br />
No. 1882/71018, CMP (National Centre for Research Projects<br />
Management - Romania), VII Thematic Area. Partners: ITC S.A.<br />
Bucharest, UPB-CEPETET, SIAT, ULB Sibiu<br />
11
Some technical solutions related to integration of PV<br />
Modules in Existing Romanian Buildings<br />
Silvian Fara 1 , Dumitru Finta 1 , Mihai Iancu 1 , Laurentiu Fara 2 , Dragos Comaneci 3 , Ana-Maria Dabija 3 , Eugenia<br />
Tulcan- Paulescu 4 , Marius Paulescu 4 , Traian Jurca 5<br />
1 <strong>IPA</strong> <strong>SA</strong> Bucharest; 2 University ‘Politehnica’ Bucharest; 3 University of Architecture and Urbanism ‘Ion Mincu’,<br />
Bucharest; 4 West University Timisoara; 5 Politehnical University of Timisoara<br />
Abstract - The paper is based on an on-going national research<br />
project focused on the promotion of new architectural concepts<br />
i.e. BIPV systems, which include active solar systems (PV<br />
generators) and solar tunnels. The advantages of using the<br />
distributed solar architecture are more remarkable in the case of<br />
large network-connected PV systems, such as the PV systems in<br />
the urban area, installed on building’s façades or roofs. Thus, in<br />
contrast to other EU states, in Romania there is no photovoltaic<br />
building construction branch, the limited number of isolated<br />
cases being not enough to argue the start if a photovoltaic market<br />
in the building industry. The major purpose of the project is to<br />
demonstrate the efficiency of integrating various PV elements in<br />
buildings, to test them and to make them known so that they can<br />
be used on a large scale. To do this, the new products will be<br />
installed on three pilot buildings (two in Bucharest and one in<br />
Timisoara) and the PV modules will be integrated in consonance<br />
with their architecture. One of them will be a historical building<br />
and the other two will be new buildings; they will have different<br />
typologies and they will be located in different areas. The installed<br />
power for each building will be of approximately 1.000 Wp,<br />
including some technologies with PV modules integrated in the<br />
architecture of the buildings.<br />
I. INTRODUCTION<br />
A. RES Policy<br />
In Romania the main policy instrument to support RES-E<br />
at national level is the quota system based on tradable green<br />
certificates (TGC) as introduced in 2004. The mandatory quota<br />
for electricity suppliers increases from 0.7% in 2005 to 8.3%<br />
in 2010. Wind, solar, biomass or hydro power generated in<br />
plants with less than 10 MW capacity (new or refurbished<br />
since 2004) are eligible for certificates. A minimum and<br />
maximum price for the TGCs is determined annually by the<br />
Romanian Energy Regulatory Authority (ANRE). A supplier<br />
who fails to fulfil his quota has to pay the maximum price – at<br />
least in theory. Arguing with the large imbalance between<br />
supply and demand for RES-E, it is the common practice of<br />
ANRE to adjust the quota at the end of each year to the amount<br />
of offered TGCs. This means for example that the quota for<br />
2008 was modified from 5.3% to 0.32% ex-post.<br />
Consequently, almost no penalties are paid. Obviously this<br />
reduces the effectiveness of the penalty and destroys the proper<br />
functioning of the overall RES trading scheme.<br />
In 2008 a new law was introduced, which stated important<br />
improvements on the existing regulations of the RES trading<br />
regime. However, no secondary legislation has yet been<br />
approved by the Government in order to make the law<br />
operational. An entry into force is expected for 2010. A key<br />
element of the new law is to establish technology-specific<br />
weighting factors in the RES trading system. Estimated<br />
development of electricity production from photovoltaics in<br />
Romania: for 2005 (0MW/0GWh); Average for 2011-2012<br />
(26MW/30GWh); Average for 2013-2014 (61MW/69GWh);<br />
Average for 2015-2016 (102MW/116GWh); Average for 2017-<br />
2018 (169MW/192GWh); 2020 (313MW/357GWh).<br />
At this moment, the necessity of the use of new forms of<br />
energy in Romania is politically stated. According to the<br />
proposal for a Directive of the European Parliament and of The<br />
Council on the promotion of the use of energy from renewable<br />
sources, given in Brussels in January 2008, there is an aim “to<br />
establish an overall binding target of a 20% share of renewable<br />
energy sources in energy consumption to be achieved by each<br />
Member State, as well as binding national targets by 2020 in<br />
line with the overall EU target of 20%”.<br />
Since 2005, a number of laws were elaborated and released<br />
by the Ministry of the Environment and Sustainable<br />
Development. The most recent Order, emitted in 2008, states<br />
that up to 90% of the costs of a solar system that is installed by<br />
a Local Authorities can be taken over by the Government. It is<br />
expected that the Order will stimulate the increase of the<br />
interest for solar systems. During the last few years, the users<br />
that have been emphasizing the possibilities opened by<br />
alternative energy sources increased. However, although we<br />
have regulations regarding energy efficiency in buildings and<br />
methodologies to evaluate the buildings, the actions that have<br />
been taken are mainly aiming to increase the thermal insulation<br />
of the envelope and to work on the installations within the<br />
building. A number of pilot projects have been carried out,<br />
during the past decade, alongside with building regulations that<br />
support the interventions. Not much has been done so far in<br />
terms of implementing solar energy systems. No building<br />
regulations regarding the use of PV systems exist so far.<br />
B. ”Solar Architecture”<br />
Solar Architecture is a general term which implies the<br />
integration of photovoltaic system into classical building design<br />
[1]. The key concept here is represented by the photovoltaic<br />
modules, which substitute some façade or roof components. For<br />
the design and construction of solar/PV systems it is necessary<br />
to have information about the solar energy collectable on tilted<br />
surfaces. In Romania, the meteorological stations have no such<br />
databases and do not perform such measurements. During the<br />
past 20 years the building activity has flourished in Romania.<br />
Along with the construction of new buildings – mainly<br />
residential parks and office buildings - the activity of<br />
12
etrofitting the existing stock of buildings is intense. Taking<br />
advantage of the necessity to up-grade the structural system of<br />
the buildings - as we are a country with severe seismic activity<br />
- the owners of the buildings are trying to improve the living<br />
conditions also from the hygro-thermal, acoustic, functional<br />
and (more in a declarative manner, still), environmental point<br />
of view. While the state is getting more involved in the activity<br />
of structural consolidation and thermal rehabilitation of the<br />
mass dwellings that were built mainly before 1990 (some of<br />
them dating since the thirties), owners of individual houses are<br />
more and more interested in the use of alternative energy<br />
sources (sun and wind based) as complementary measures to<br />
decrease the energy costs while using the energy their<br />
equipment requires.<br />
Although in Romania the building market is rapidly<br />
developing, the building contractors do not promote PV<br />
technologies and new materials used for high performance day<br />
lighting, either because of their ignorance or their<br />
conservativeness, or the high costs related to importing such<br />
systems from the European market. Though during the last<br />
years more private companies in Romania offered to<br />
merchandise and install PV systems, one can not discuss of a<br />
proper PV market. Thus, in contrast to other EU states, in<br />
Romania there is no photovoltaic building construction<br />
branch, the limited number of isolated cases being not enough<br />
to argue the start if a photovoltaic market in the building<br />
industry [2].<br />
In general, the design of such buildings one should pursue<br />
the optimization of the processes of dimensioning and<br />
orienting the surfaces on which the components collecting<br />
solar energy are to be placed in order to obtain a maximum of<br />
collected energy, satisfying at the same time the quality with<br />
regard to destination of the building, the designing and<br />
aesthetics rules. Therefore, the data regarding the solar energy<br />
collectable on tilted surfaces represent a vital prerequisite for<br />
architects and engineers who have to size the PV or thermosolar<br />
systems, for the specialists who have to elaborate<br />
feasibility studies associated to the implementation of solar<br />
installations [3].<br />
Compared with other European countries, Romania has an<br />
above-average solar irradiation in the summer, comparable to<br />
the one of Greece, country in which the solar/photovoltaic<br />
technology is highly developed. Stand-alone private PV<br />
systems and the ones supplying energy also into the grid can<br />
be an attractive investment solution. A key element for the<br />
promotion of these renewable energy sources is the education<br />
for the sustainable development of the economic and social life<br />
of the population, especially young people; future inhabitants<br />
of houses designed and built using the new concepts of solar<br />
architecture. The effort to carry out a project of such a span<br />
requires human resources highly qualified in different areas of<br />
study such as urban architecture, the physics of photovoltaic<br />
devices, the physics of atmosphere (solar radiation), applied<br />
electronics (electrical measurement methods), data<br />
transmission, informatics, database administration.<br />
II. PROJECT DESCRIPTION<br />
The PV architecture is a new concept for Romania.<br />
Consequently, the project aims to achieve demonstrative<br />
designs of ecological solar buildings containing in their<br />
structure photovoltaic elements, passive solar elements, and<br />
modern systems for day lighting. These are available on-line on<br />
the web-site of the project (http://renerg.pub.ro/pasor) and,<br />
additionally, will be presented to building contractors and to the<br />
public. For users who desire to access the meteo data by WUT<br />
station they can work with site<br />
http://solar.physics.uvt.ro/srms. In this section of the<br />
project we have in view the practical construction of three<br />
BIPV (building integrated PV) systems which are integrate in<br />
the structure of buildings. The two systems were equipped with<br />
monitoring systems and the necessary infrastructure for<br />
transmitting the data to the web-site. A computer-based<br />
displaying system placed in public domain will permit real-time<br />
visualisation of the parameters of the installation and,<br />
additionally, will transmit technical and economical<br />
information referring to the solar/ photovoltaic architecture to<br />
the large public [1].<br />
A holistic analysis of the building has been before<br />
introducing a BIPV system [4]. The main criteria of such<br />
analysis would be as follows:<br />
- opportunity of the BIPV utilisation;<br />
- involvements of the built environment (urban, rural,<br />
industrial) towards the building;<br />
- involvements of the BIPV placement towards the building<br />
itself (these criteria are linked with volumetric analysis, style,<br />
general and particular look of the building envelope);<br />
- specific requirements of the building envelope based on the<br />
type of selected BIPV;<br />
- optimum action type and place (analysis of the BIPV systems<br />
corresponding with the envelope parts where it would be<br />
intended to act and not shading the modules);<br />
- technical and operational involvements on the envelope<br />
components;<br />
- efficiency of the agreed system;<br />
- financial and payback period involvements of the investment;<br />
- type and way of the produced electrical energy management.<br />
A. The project partners:<br />
<strong>IPA</strong> <strong>SA</strong> (Project coordinator), West University of<br />
Timisoara (WUT), Polytechnic University of Bucharest (PUB),<br />
Polytechnic University of Timisoara (PUT), University of<br />
Architecture and Urbanism “Ion Mincu” (UAUIM) in<br />
Bucharest<br />
B. Project results at this moment [1]:<br />
1. Quantitative results:<br />
- Centre for measuring the solar energy that can be collected<br />
from tilted surfaces (unique in Romania) at WUT;<br />
- Modernization and installation, by applying the project’s<br />
energy concepts, at the roof of WUT, and at the roof of the<br />
UAUIM –Bucharest. Additionally, mounting of solar windows<br />
in the solar PV Laboratory from PUB;<br />
- Project website, containing: software and guide, accessible<br />
13
online, for: estimation of the solar energy that can be collected<br />
from tilted surfaces; PV system design; architectural solutions;<br />
- Database containing measurements of solar energy<br />
collectable from tilted surfaces;<br />
- Submission to the authorities of the legal requirements<br />
related to the authorisation of the operation of distributed<br />
electric power sources;<br />
- Organisation of a thematic competition („Solar house”) for<br />
students;<br />
- Organisation of workshop for discussing the results of the<br />
project with representatives of the target groups;<br />
- Brochures, guidelines, bibliographies for the different target<br />
groups<br />
2. Main results:<br />
- Development of a database regarding the measurement of<br />
solar radiation on tilted surfaces in various points on<br />
Romania’s territory, with the involvement of the National<br />
Institute for Meteorology and Hydrology;<br />
- Specialisation of young architects (students in the last years<br />
or studying for the master’s or doctor’s degree) in the<br />
problems specific to solar architecture within the Universities<br />
in Bucharest and Timisoara;<br />
- Raising the awareness of local authorities and building<br />
contractors with regard to the benefits of using solar<br />
architecture;<br />
- Increasing the level of information of the population<br />
regarding distributed photovoltaic systems.<br />
3. Estimated profits and profitability:<br />
- Development of specialization in solar architecture, with<br />
great opportunities within the EU market;<br />
- Achievement of important steps in the development of the<br />
photovoltaic industry in Romania;<br />
- Possibility of capitalization of the results obtained<br />
by the project in Romania’s neighbouring countries;<br />
-Easy to install: Our attractive, flexible solar roof<br />
panel literally rolls right on. We manufacture the solar roofing<br />
systems in easy to handle modular rolls to allow for rapid<br />
installation at our customer’s sites. We employ experienced<br />
roofing professionals to install our products, with no disruption<br />
to your business.<br />
-Light weight: The solar panel weighs only 3.7kg/m 2<br />
allowing installation on existing facilities without exceeding<br />
roof loading limitations.<br />
-Powerful: The amorphous silicon panels enable<br />
maximum kilowatt-hour output, producing electricity using a<br />
wider spectrum of light than traditional crystalline technology.<br />
This feature enables the panels to produce electricity all day<br />
long, even when it is cloudy.<br />
-Rugged and durable: Durability to cope with<br />
challenging weather conditions, and stability to handle<br />
changing light and shade conditions, have been built into all<br />
our roofing products. In addition, our roof is sealed and<br />
bonded, providing a weather-tight, long-lasting roof that has<br />
no penetrations. All our roofs are backed by a 20 year<br />
guarantee and an operations & maintenance program.<br />
-Attractive appearance: Our unique electrical engineering<br />
integrates the solar array within the roofing assembly<br />
providing a neat and uncluttered roof surface.<br />
III. SHORT DESCRIPTIONS OF THREE DEMO PV SYSTEMS<br />
A. Demo System PV at UAUIM<br />
Four PV modules composed of mono-crystalline silicon<br />
SRP (270Wp, 26 kg, 1047 x 2028 x 89 mm) were mounted on a<br />
roof versant of the historical building of UAUIM –Bucharest.<br />
In order to find the optimal location for the PV modules one<br />
carried out a study of the building’s solar irradiance for each<br />
season. One analyzed several possibilities in terms of location<br />
and types of constructive assemblies. Along with the<br />
reconsolidation process an architectural and functional<br />
conversion of the attic took place, through setting up new office<br />
spaces. Illumination of the hall resulted on the axis of the attic,<br />
was achieved through solar tunnels. For night lighting one<br />
installed lamps in each terminal space covered by natural light<br />
through the solar tunnels. The reconsolidation and<br />
rehabilitation process also implied the replacement of both the<br />
roof framing and the roof covering, making it easier to integrate<br />
the PV modules in the roof [3][4].<br />
Figure 1. Electrical scheme of the PV system<br />
The versant on which the PV modules were mounted is<br />
south-west oriented, with a tilt angle of around 15 0 . The solar<br />
irradiance study showed that there were no objects that could<br />
shade the respective versant.<br />
Figure 2. PV modules mounting<br />
The Velux solar tunnel has a fixed tube (35 cm in diameter)<br />
with an inner reflector surface with 98% degree of reflection; it<br />
ends up with an internal lighting fitting with 4 mm thick heat<br />
insulation glass.<br />
14
Figure 3. Solar tunnel: the glass covers on the roof, and the lighting fittings in<br />
the hallway working during the day<br />
surfaces with different spatial orientation. These data are used<br />
at developing the numerical algorithms and at integrating them<br />
in computer applications used by architects and engineers<br />
developing solar energy projects in Romania.<br />
2. The data base resulting form the monitoring of solar<br />
irradiation on tilted surface. The fine sampling of the data<br />
base, the entries for tilted surfaces, the simultaneous<br />
registration of the solar irradiation data and of the electrical<br />
parameters of the photovoltaic generators, are attributes of the<br />
data base that makes it unique in Romania. It represents the<br />
basis for developing numerical algorithms for estimating solar<br />
irradiation.<br />
3. Experimental stand for studying the power delivered under<br />
load, in the case of installing photovoltaic modules with<br />
different fixed spatial orientations. This is the most common<br />
situation in urban photovoltaic architecture.<br />
4. Facilities for characterizing the operation of photovoltaic<br />
modules and systems under concrete ambient conditions. Under<br />
real atmospheric conditions, temperature and solar irradiance<br />
change continuously and in such non-standard situations, the<br />
characteristics of the modules are unknown. Despite the many<br />
models that translate the parameters of the modules listed in the<br />
catalogue, under concrete environmental conditions, a problem<br />
still occurs in selecting the adequate model, which works with<br />
highest accuracy in the given location. The experimental<br />
development in the project creates the prerequisites to answer<br />
these problems.<br />
Figure 4. Image of the roof, before and after mounting the modules<br />
This is probably, the first building in Romania to have a<br />
hallway illuminated exclusively form renewable energy<br />
sources: solar tunnels for day lighting, and the photovoltaic<br />
energy stored during the day for night lighting.<br />
B. Demo System PV at WUT<br />
WUT planned and achieved two objectives: the Solar<br />
Irradiation Monitoring Station (SIMS) and the Photovoltaic<br />
Laboratory (PVL) that compose the Solar Platform in WUT.<br />
At the end of 2009, one obtained the first series of annual data<br />
from monitoring the solar irradiance and the meteorological<br />
parameters. The data acquired on the SIMS platform, are<br />
accompanied by the data obtained from monitoring the mobile<br />
and the fixed PV subsystems.<br />
The monitoring system currently uses 21 channels, while<br />
another 15 channels are available for future developments.<br />
Data acquisition is done simultaneously at a frequency of 4<br />
samples per minute [5].<br />
1. The Platform for Monitoring Solar Irradiation on tilted<br />
surfaces. For a good design of the BIPV systems, one has to<br />
know the quantity of solar energy that can be collected on<br />
Figure 5. Total view of the PV system on the roof of WUT<br />
Figure 6. Station for measuring the meteorological parameters at WUT<br />
The photovoltaic system is made up of two subsystems, one<br />
fixed and the other mobile, both of them being fitted with<br />
identical batteries and loads. The main function of the PV<br />
system monitoring is to compare the data obtained from the two<br />
subsystems (collectible solar energy, energy delivered, etc).<br />
15
The solar tracker system is SunTracer SM33PMCBL that<br />
combines tracking the sun on its trajectory with the load<br />
control feature (max. wind speed:130 km/h; lifecycle: 20.000<br />
complete rotations ⇔10 years).<br />
The modules are ISP90 (ISTAR SOLAR) composed of<br />
mono-crystalline silicon (125 x 125 x 10 mm; 90Wp). The<br />
batteries used for storage have 110 Ah/12V.<br />
At each of the systems, the following parameters are<br />
measured: the current delivered by the module (I module ), the<br />
current consumed by the load (I load ) and the battery voltage<br />
(V battery ).<br />
The data acquisition equipment is a PXI platform (National<br />
Instruments). The data acquisition board NI PXI-6259 disposes<br />
of 32 analogue inputs, of which 16 are reserved for the SIMS<br />
and 16 for monitoring the demonstrative PV system. The data<br />
are read after 15 seconds. The LabVIEW application for<br />
acquiring and storing the data was developed and maintained<br />
by PUT.<br />
Figure 7. The total solar energy per day, registered in the first seven months of<br />
2009 on two surfaces with different spatial orientation.<br />
C. Demo System BIPV at PUB<br />
A grid-connected BIPV demonstrative system was<br />
developed at the Polytechnic University of Bucharest. It was<br />
put into service in July 2008, and is made up of 6 PV panels,<br />
an inverter, equipment for monitoring and storing the data, as<br />
well as a station for monitoring the meteorological parameters.<br />
The power delivered by the PV modules is 615Wp. These are<br />
KORAX semitransparent modules: 3 modules of 120Wp and 3<br />
of 85Wp (mono-crystalline silicon; anti-reflector layer; 1550 x<br />
800 x 6 mm //1050 x 800 x 6 mm; 14 kg//9kg) they are<br />
mounted on the existing structure of the window of the BIPV<br />
laboratory in PUB [6].<br />
Figure 8. The photovoltaic system at PUB – seen from outside (a), seen<br />
from inside (b)<br />
The main components of the monitoring system are the<br />
weather monitoring station and a data logger, together with two<br />
computers for taking over the data and a web server for<br />
processing and presenting the data in a useful format for the<br />
end-user.<br />
The Sunny Boy SB700 inverter operates at high conversion<br />
efficiency, using a MOSFET bridge for converting direct<br />
current. The current supplied to the grid is perfectly sinusoidal,<br />
with a very low rate of distortion of the grid harmonic [7].<br />
The inverter transmits data to the monitoring equipment<br />
through electric line communication, and data signal<br />
modulation at 100 kHz.<br />
Figure 9.<br />
Basic<br />
schema<br />
of the<br />
monitorin<br />
g system<br />
The<br />
monitor<br />
ing<br />
equipm<br />
ent,<br />
Sunny<br />
Boy<br />
Control Plus, offers many features for storing (up to one year of<br />
measurements) and processing the data from the inverter. It is<br />
connected to a computer through a serial null-modem RS232<br />
cable (www.sma-america.com). Sunny Boy Control Plus<br />
can display the energy supplied to the grid in one day, the total<br />
energy supplied to the grid, and the energy that is generated at<br />
the moment by the solar modules. Besides that, it can display in<br />
real time the operation parameters of the inverter. One can also<br />
establish the data to be archived:<br />
- voltage generated by the modules (V PV ),<br />
- energy generated by the modules (P AC ) and<br />
- total generated energy (E t ).<br />
2008 – november 2009 (in kWh)<br />
Figure 10.<br />
Energy<br />
supplied to<br />
the grid by<br />
the BIPV<br />
system<br />
from PUB<br />
between<br />
december<br />
LaCrosse Weather Station WS2500 is the station used to<br />
measure the meteorological parameters. It has, in the basic<br />
package, six outdoor sensors for wind (speed and direction),<br />
temperature, humidity, atmospheric pressure, solar irradiation<br />
and rainfall, and another 2 indoor sensors that measure<br />
temperature and humidity in the room in which the station is<br />
mounted. The data are taken over from the sensors through a<br />
radio connection, on the frequency of 433 MHz, from a<br />
16
maximum distance of 100 m (if no interferences exist). All the<br />
sensors have an internal battery together with a PV minimodule<br />
for supply, reaching autonomy of minimum 10 years.<br />
The data are read from the sensor at every 5 minutes.<br />
The software for monitoring the weather station allows<br />
registration of the meteorological data for any period of time<br />
and can generate graphs for any parameter that the user might<br />
want to visualize. It takes over the sensor data by accessing the<br />
weather station through a serial connection. The time interval<br />
at which the access is done can be set up between 3 to 30<br />
minutes. The data are then stored in an internal binary file of<br />
the software, but they can be exported in known formats, for<br />
any further processing of the data.<br />
One can also automatically generate the graphs for a<br />
certain period, and these will be displayed on a PC.<br />
Figure 11. Station for monitoring the meteorological parameters / screen<br />
of facade modules, their application on the vertical component<br />
of the envelope, on large surfaces, may attenuate this<br />
inconvenient and increase the energy they deliver. On the other<br />
hand, these modules bring their own contribution to the<br />
architectural and technological definition of the buildings.<br />
The flat rooftops, on which arrays of photovoltaic panels<br />
can be installed at the optimum tilting angle, can be considered<br />
to have maximum efficiency. They might be combined with<br />
rooftop terrace-gardens that would further increase the<br />
reliability of the PV system (preventing panel overheating and<br />
improved dusting) [8][9].<br />
Obviously, one can combine these integration techniques –<br />
facade and rooftops – resulting in a unitary building from the<br />
point of view of architectural expression of the envelope.<br />
At the moment we are at the phase of finalizing the technical<br />
studies and analyzing the behaviour of the demo systems with<br />
the different integrated modules. The local PV market of PV is<br />
not very large and it needs to be stimulated through attractive<br />
incentives from the Government.<br />
ACKNOWLEDGMENT<br />
The results of this paper are based on the PN II grant no. 21<br />
039/09.2007, PASOR. We would like to acknowledge and<br />
thank our collaborators from the Polytechnic University of<br />
Bucharest, the West University of Timisoara, the Polytechnic<br />
University of Timisoara and the University of Architecture and<br />
Urbanism in Bucharest “Ion Mincu” for the good and fruitful<br />
collaboration in developing the PASOR project.<br />
REFERENCES<br />
Figure 12. Screen with meteorological data at PUB<br />
III. CONCLUSIONS<br />
There is growing interest in highly glazed building facades,<br />
driven by a variety of architectural, aesthetic, business and<br />
environmental rationales. The environmental rationale appears<br />
plausible only if conventional glazing systems are replaced by<br />
a new generation of high performance, interactive, intelligent<br />
façade systems, that meet the comfort and performance needs<br />
of occupants while satisfying owner economic needs and<br />
broader societal environmental concerns. The challenge is that<br />
new technology, better systems integration using more capable<br />
design tools, and smarter building operation are all necessary<br />
to meet these goals. The opportunity is to create a new class of<br />
buildings that are both environmentally responsible at a<br />
regional or global level while providing the amenities and<br />
working environments that owners and occupants look for.<br />
Although the energy efficiency is much reduced in the case<br />
[1] <strong>IPA</strong> <strong>SA</strong> (coordinator), WUT, PUB, TUT, UAUIM, Promotion of Solar<br />
Architecture in Romania (PASOR), Reports of Project No. 21039/2007,<br />
Research Romania’s Partnership Programme<br />
[2] L. Fara, A–M. Dabija, S. Fara, D. Finta, M. Iancu, and M. Paulescu,<br />
Building Integrated Photovoltaics (BIPV) in Romania in Proceedings of<br />
International Congress Energy and the Environment 2008, Opatija, Croatia<br />
October 22 - 24, 2008<br />
[3] M. Šúri, T.A. Huld, E.D. Dunlop, H.A. Ossenbrink, Architects and<br />
Engineers, International Energy Agency, pp. 75 – 116<br />
[4] Harvey D., Low-Energy buildings and District-Energy Systems, James &<br />
James Ltd. 2006,<br />
[5] T.Jurca, M.Paulescu, A.De Sabata, I.Luminosu, C.Dughir, M.Lascu,<br />
E.Paulescu, C.De Sabata, Recent Measurements on Solar Radiation in<br />
Timisoara ,Romania; International Conference “Unconventional Energies in<br />
the Carpathian and Danubian Area, Arad, November, 2009.<br />
[6] L. Fara, S. Fara, A-M.Dabija; First results of a BIPV project in Romania,<br />
PLEA 2008 conference, Dublin, October 2008.<br />
[7] L.Fara, S. Fara, A-M. Dabija, D. Comaneci. Development of a small BIPV<br />
system at Polytechnic University of Bucharest, International Congress ISES<br />
Johannesburg, October 2009<br />
[8] D. Prasad, M. Snow 2005, A Source Book for Building Integrated<br />
Photovoltaics (BIPV), EarthScan<br />
[9] http://buildingsolar.com/technology.asp<br />
17
On MADM E-Course<br />
CORNEL RESTEANU 1 , MIHAELA RESTEANU 2<br />
1<br />
National Institute for Research and Development in Informatics (ICI)<br />
8-10 Averescu Avenue, 011455, Bucharest 1 Romania<br />
2<br />
Economic Studies Academy,<br />
6 Romana Square, 010572, Bucharest 1, Romania<br />
Abstract: - After creating a lot of e-courses, the authors arrive at the conclusion that such a course is made<br />
from a specific part named course’s digital content and a general part named course’s shell. The first part<br />
is represented by the knowledge that must be transferred from the teachers to the students, in this case the<br />
MADM knowledge. The second part, the general one, is represented by the mediator of this transfer. The<br />
paper’s goal consist in describing the structure of course’s digital content as well as the course’s shell,<br />
both generating an ICT product belonging to the software as a service class.<br />
Key-Words: - Creativity and Personal Development, Livelong Learning, Enhanced Learning Technology,<br />
Information and Communication Technology, Internet Computing, Software as a Service.<br />
1 Introduction<br />
Every person currently learns in his / her social<br />
live, “from the pre-school years to postretirement”.<br />
In the Creativity and Personal<br />
Development (CPD) era, the Lifelong Learning<br />
(LLL) concept acquires new meanings with the e-<br />
courses development in Enhanced Learning<br />
Technology (ELT) using Information and<br />
Communication Technology (ICT), mostly Internet<br />
Computing (IC) tools. “Education and Training<br />
2010” European work program [1] has a strong<br />
support in Romania. Therefore, the e-learning<br />
(EL) domains had been encouraged.<br />
As an example, a fundamental research in the<br />
Multi-Attribute Decision Making (MADM) field<br />
[2, 3], a branch of Operations Research (OR)<br />
domain, was completed with a LLL tool [4, 5] by<br />
producing a MADM e-course with a general shell<br />
(GS) that can present the digital content (DC) not<br />
only for this course but for every one presenting<br />
the same structure of its knowledge thesaurus<br />
(KT). KTs that have the same structure belong, in<br />
the present case, to the OR domain containing<br />
mathematical programming, graph theory,<br />
transport problems, stochastic processes, queuing<br />
theory, game theory, decision analysis etc. Also,<br />
for example, the engineering domain has, for most<br />
of its sub-domains, the same structure for the KTs.<br />
One can say that in every domain there are subdomains<br />
with the same structure of KTs. Therefore<br />
it is very important, not only from the informatics<br />
point of view, to exist, if is possible, unique ECS<br />
for each domain that promote the EL. Nowadays,<br />
EL technology exploits all the observations<br />
presented above.<br />
Figure 1. An e-course is content into a shell<br />
2 E-Course’s Digital Content<br />
First, DC contains a small part dedicated to the e-<br />
course auto-presentation, usually a sound film, and<br />
a part dedicated to the users’ guide, usually a text.<br />
Obviously, these are knowledge about knowledge<br />
i.e. meta-knowledge (MK).<br />
Second, DC contains the main part, namely KT,<br />
represented by the genuine e-course’s knowledge.<br />
KT is divided, at its tour, from its functional point<br />
of view, into two parts. The first part is the KT for<br />
18
the learning process (KTL) and the second part is<br />
the KT for the verification process (KTV).<br />
2.1 Presentation of the KTL<br />
The KTL represents the content for n course<br />
modules, each of it containing m learning days.<br />
One day offers a lesson, a set of grill-tests and a<br />
set of problems / case studies. For each course<br />
module exist, from the beginning but enriching<br />
itself during the course using, the most frequent<br />
questions and a bibliography.<br />
All lessons, as dimension, must be balanced,<br />
about 6 A4 .pdf pages at 12 font size. The<br />
cardinality for grill-tests and problems / case<br />
studies sets must be of hundreds order. The<br />
difficulty must increase for all kinds of KTL with<br />
the learning days and with the course modules.<br />
objects, attributes, objects – attributes, and the<br />
model expert knowledge expressed through a set<br />
of production rules that deal with the potential<br />
drawbacks of a MADM model, i.e. syntactic /<br />
semantic incorrectness, incredibleness or<br />
incompleteness. The lessons are: History,<br />
taxonomy, state-of-the-art, Generalized model’s<br />
definition, Modeling methodology, Theoretical<br />
results important for modeling, Models examples<br />
presented in natural language;<br />
2.2 Presentation of the KTV<br />
The KTV represents the content for modules<br />
exams and graduation exam. These two kinds of<br />
exams, albeit alike, as content are different. Each<br />
learning day, and by consequence, each course<br />
module has associated a set of grill-tests and a set<br />
of problems / case studies. These sets, by types, are<br />
of same cardinal. The set of grill-tests and the set<br />
of problems / case studies for the graduation exam,<br />
also by types, are from cardinality point of view<br />
greater than the previous ones, and also more<br />
difficult. If the KTL, in the electronic-course, is<br />
used like it is, the KTV is used for random<br />
generation of the exams, which must be different<br />
from one student to another. The degree of<br />
collisions must be very small, and if possible equal<br />
to zero.<br />
3 Example of Knowledge Thesaurus<br />
The knowledge thesaurus taken as example in this<br />
section belongs, obviously, to the MADM e-<br />
course. It provides knowledge regarding a basic<br />
problem of Decision Theory: the Optimal Choice<br />
Problem (OCP) [6]. The course is structured into<br />
four modules each of them having five learning<br />
days:<br />
1) Defining the mathematical model. This module<br />
presents the MADM mathematical model, which<br />
includes structured and unstructured [7]<br />
information: decision makers, states of nature,<br />
Figure 2. From regular learning to individual learning<br />
2) Normalization and solving methods for OCPs.<br />
This module presents different procedures of<br />
reducing multiple decision makers, multiple states<br />
of nature problems to single decision maker, single<br />
state of nature problems, as well as a large set of<br />
solving methods for this last kind of problem. The<br />
lessons are: a) OCPs generating, b) Solving<br />
methodology, c) Normalization methods, d)<br />
Characterization methods, e) Evaluation methods;<br />
19
3) IT for design of MADM software applications.<br />
This module covers three levels of technology<br />
(design specification, pseudo-code, and C++ code)<br />
for rapid design and development of MADM<br />
software applications. The lessons are: DB design<br />
specification, OCPs’ design specification, OCPs’<br />
appealing, OCPs’ running, OCPs’ solutions;<br />
4) OPTCHOICE – MADM modeling and solving<br />
software. The last module is a tutorial on the<br />
MADM modeling and solving pervasive service<br />
(available to anyone on the Internet, free of charge,<br />
from any place and at any time). The service uses<br />
the software named OPTCHOICE, which covers<br />
the needs to define and solve optimal choice<br />
problems in the MADM paradigm. The lessons<br />
are: Software and hardware platform, Users’<br />
registration, About DB using, MADM models<br />
editing, OCPs generating, solving and getting<br />
solutions.<br />
The lessons from these four modules originate<br />
in the book Multiple Attribute Decision Making –<br />
Theory and Practice written by the author of this<br />
paper. The book, in Romanian, is available on<br />
Internet in an electronic library at www.elibrarie.ro,<br />
mathematics section.<br />
Figure 3. The source of lessons’ content<br />
In the following will be given examples for:<br />
Grill-tests:<br />
In the framework of generalized MADM model,<br />
which elements characterize the states of nature’s<br />
set?<br />
a) Cod, Name, Description, Relative Importance.<br />
b) Name, Description, Relative Importance.<br />
c) Cod, Description, Relative Importance.<br />
d) Cod, Name, Relative Importance.<br />
e) Cod, Name, Description.<br />
Problems:<br />
An agricultural farm with vegetal production<br />
encounters a full process of growing. On its very -<br />
owned and, also, on the rented lands, different<br />
kinds of crops are cultivated according to the<br />
rotation system: wheat, oak, maize etc. The owner<br />
decides to buy a new piece of machinery, namely<br />
that potentially will allow performing the<br />
harvesting works without any rendering services,<br />
usually accessible only at the end of the harvesting<br />
season. The financial implications of rendering this<br />
king of services in these circumstances deal with<br />
large portion of lost production because of the<br />
overheating and the transportation cost from the<br />
machinery owner and the harvest location. On the<br />
other hand, the cost of new piece of machinery<br />
may exceed the current cash so that the farm<br />
owner decides on buying second-hand machinery<br />
but no old than 5 years.<br />
In the selection process, the experts<br />
recommend the following characteristics to be<br />
reviewed:<br />
1) The cost of the equipment,<br />
2) The gas consumption on a cut down and<br />
threshed hectare;<br />
3) Feasibility in functioning,<br />
4) The width of the header.<br />
So, obviously, the cost of the combine and the<br />
gas consumption should be as small is possible,<br />
and the feasibility in operating and the width of the<br />
header to the largest extend. As absolute degree of<br />
importance, these attributes have the following<br />
values for the farm owner: 40%, 30%, 20% and<br />
10%.<br />
Being willing to spend at most 95000 RON for<br />
purchasing the combine, by analyzing the current<br />
offers on the market, the owner identifies five<br />
possible combines that meet the prerequisites.<br />
These possible choices are given as a set of<br />
alternatives, noted by O, consisting of elements o 1 ,<br />
o 2,…, o 5 , where 5 = Card O.<br />
According to the attributes expressing requirements,<br />
the first two do not raise any understanding<br />
problems, being given as follows:<br />
20
Costs: 90000, 85000, 95000, 75000, 78000 RON,<br />
Consumptions: 36, 35, 32, 40, 35 l/ha.<br />
The next two ask for some explanations. The<br />
maintenance property, as requested by actual<br />
standards, stipulates that in the harvest season, the<br />
equipment is described in one of the following<br />
states: position at rest, position at repair, position<br />
at work with the probabilities: 0.2, 0.1 respectively<br />
0.7. By studying the register cards about the<br />
equipment functioning, and taking into<br />
consideration the last three years (because two of<br />
the machines only worked three years), the<br />
following set of data was set (in conventional<br />
days):<br />
a) For the position at rest: 20, 15, 32, 30, 18;<br />
b) For the non-working position: 5, 7, 8, 8, 7;<br />
c) For the working position: 95, 98, 80, 82, 95.<br />
So, the maintenance attribute will be associated<br />
with three sub-attributes, namely: position at rest,<br />
position at repair, respectively, position at work.<br />
The header is the frontal component of the<br />
equipment, ensuring the harvesting operation.<br />
Even though the width of the header is inversely<br />
proportional to the advance speed, the experts<br />
establish that, according to the covered surface of<br />
threshing, it is more efficient a piece of machinery<br />
with a larger header in width as compared to the<br />
one with a smaller header. The width figures for<br />
the five pieces of machinery are:<br />
Header width: 5,8 6,6 6,4 5,2 6,0 meters.<br />
The attributes set is given by A, and its<br />
elements are noted with a 1 , a 2 , a 3 , a 4 , a 5 , a 6 , where<br />
6=card A, in which one should regard that the<br />
maintenance attribute is represented by three subattributes.<br />
Under these conditions, the optimal choice<br />
about the machinery is requested.<br />
Most frequent questions:<br />
Which is the main software instruments used in<br />
OPTCHOICE development?<br />
The software instruments, minimally enumerated,<br />
are: MySQL, PHP, MSVC, Java, Macromedia<br />
Dream-weaver MX, Flash MX, Voice, SnageIt.<br />
The grill-tests, the problems and the most<br />
frequent questions from the e-course’s modules<br />
originate in the practice of the designing<br />
consortium. It was possible because the project<br />
benefited from the work of a strong consortium:<br />
National Institute for Research and Development<br />
in Informatics - Bucharest (two research workers,<br />
three programmers and other specialists),<br />
University of Bucharest (two professors and three<br />
master students as programmers) and Bucharest<br />
Academy of Economic Studies (five professors<br />
and four students as programmers).<br />
Also, the same origin is for grill-tests and<br />
problems / case studies used for e-course exams.<br />
The four modules of the MADM electronic course<br />
can only be approached sequentially, following the<br />
order established by design, so that a higher-order<br />
module becomes available only after passing the<br />
exam given at the end of the preceding module.<br />
The course is successfully completed when passing<br />
a graduation exam, which can only be taken after<br />
passing five end-of-module exams. At the end of<br />
each module, 100 grill-tests, divided into 5 classes<br />
of 20 each, are made available for the exams.<br />
Throughout module #4, 100 problems with<br />
solutions are included. The students are expected<br />
to learn how to solve them or similar problems. An<br />
end-of-module exam consists of 10 randomly<br />
selected questions, one from each of the<br />
equivalence classes. A graduation exam consists of<br />
5 questions, one from each module, plus one of the<br />
available problems but with modified data.<br />
4. E-Course’s General Shell<br />
The GS is the software part of an e-course. It<br />
realizes the graphical user interface (GUI) between<br />
the e-course, as a system, and two categories of<br />
users: the students and the administrators.<br />
Therefore there are two regimes of functioning,<br />
utilization and administration. For both, students<br />
and administrators, there are specific registration<br />
procedures wich assure the access into the system<br />
with preserving the security exigencies.<br />
If the administrators initially transfer, and<br />
continuously up-date, the DC into GS and the<br />
students read the DC from GS, then is obvious that<br />
the GUI, in both situations, will be the same on all<br />
nodes of GUI’s tree but the leafs’ level. The<br />
screen organization is the folowing:<br />
a) On screen’s top there is a horizontal strep with<br />
the role of navigation over the modules and exams;<br />
b) On screen’s left side there is a vertical strep<br />
with the role of navigation over the learning days<br />
into a module. On the same strep one displays the<br />
MK;<br />
21
c) The rest of the screen, the main part, is<br />
dedicated to the displaying the leafs’ level of GUI.<br />
4.1 GS’ Using<br />
GS’ using means learning and verification. After<br />
positioning a module and a day, the student may<br />
read the corresponding lesson and solve the<br />
associated grill-tests and problems. The problems<br />
may be solved either by hand or by using the<br />
OPTCHOICE software. However, an indication of<br />
the success of the authors’ efforts in this course is<br />
when the students are capable of using proficiently<br />
the OPTCHOICE software.<br />
A very good help in learning is the consulting<br />
the most frequent questions. It is possible to ask<br />
questions and get answers as well. The existence<br />
of a forum associatead to the e-course offers a<br />
larger possibility to learn from the experience of<br />
other students. At the begining, the natural ranking<br />
of module and days must be respected but arrived<br />
at a given module-day, it is possible to access any<br />
module-day with smaller rang. After each module<br />
a module exam, also electronic, must be passed. It<br />
is the condition to have access to the following<br />
module. After passing the last module exam, it is<br />
compulsory to pass the graduation exam. Every<br />
exam can be interrupted on grill-tests three times<br />
and on problems / case studies also three times.<br />
The break must be less than 24 hours. It is to say<br />
that, in this case, the last exam item do not<br />
reappears at resuming. The e-course graduation is<br />
on 3 levels: beginner, professional and expert.<br />
4.2 GS’ Administration<br />
As said above, the GS’ administration means to<br />
have control on DC. There are procedures that load<br />
the GS’ knowledge and data base starting from<br />
.pdf files. The loading corresponds to the autopresentation,<br />
users’ guide, lessons, grill-tests and<br />
problems / case studies (for learning and exams),<br />
most frequent qestions. A special administration<br />
function is the exams generation. In order to avoid<br />
certain possible fraud methods specific to<br />
electronic-format exams, it is essential that each<br />
exam to be randomly generated from the questions<br />
and problems set in such a way that elementarylevel<br />
collisions in a long period of time in the past,<br />
are avoided. A direct approach of this problem,<br />
without any precaution, has a serious drawback:<br />
when a large number of students located in<br />
different parts of the world take exams, the<br />
response time to the query of generating new<br />
exams can be large enough to become frustrating<br />
for some of the students. Using mechanisms of<br />
planning the inputs crowding in the system (i.e. the<br />
queries of generating exams) and releasing the<br />
outputs from the system (i.e. the exams completion<br />
by students), a Monte Carlo algorithm prompts the<br />
administrators when to enrich the questions and<br />
problems sets, and also indirectly shows the<br />
necessary volume in each category. The Monte<br />
Carlo algorithm is not a simulation, but it is<br />
running at warm, because it generates exams.<br />
A special kind of administration is the<br />
administration of administrators and the<br />
administration of students. The e-course has a<br />
zero-level administrator wich possess all the<br />
administration rights and a number of one-level<br />
administrators. The head of administrators<br />
estabishes the rights in DC’s administration for the<br />
rest of administrators. The students administration<br />
suposes diplomas’ editing and sending, and<br />
passing the graduate or renouncing students in<br />
corresponding history files.<br />
4.3 GS’ Knowledge Base<br />
DC in this e-course, initially is loaded in .pdf files.<br />
Obviously, GS can work directly with these files<br />
but in this case the DC’s security is in big danger.<br />
Therefore a DB is necessary. GS’s DB is created<br />
using the MySQL, the GUI being realized using<br />
the PHP. This manner, DC is hidden because on<br />
disk is visible only one file representing the DB.<br />
The DB structure contains entities, and the entities<br />
(principal or link entities) contains fields of<br />
various types. Of paramount importance is the blob<br />
type that can hold .pdf files of large dimensions, as<br />
needed in this case.<br />
The security of GS’s DB is very well solved.<br />
For exterior, there is the Public Key Infrastructure<br />
(PKI) module that assures access control, user<br />
authentication, non-repudiation, integrity of data<br />
handling, digital signature etc. For interior, a<br />
special component manages the database integrity.<br />
5 Conclusions<br />
The service „Do learn yourself MADM!” runs on<br />
strong computers, administrated through the<br />
agency of ICT modern techniques, on the UB’s<br />
22
and ASE’s Intranet. An English version is in<br />
preparing and will be installed on Internet at ICI.<br />
The endowment equipment, i.e. powerfull servers,<br />
will be strong enough to assure informatics<br />
performance for this service that will be open<br />
world wide.<br />
The main gain from this research in the e-<br />
courses field is the technological results broadly<br />
presented in the paper. A general shell capable to<br />
be filled-in with diferent digital content is a very<br />
good tool to generate e-courses. The e-course<br />
generation’s time depends only on the capability to<br />
structure the domain material upon the general<br />
shell’s exigency. An e-course developed in this<br />
technology is easy to maintain and easy to utilize,<br />
having all caracteristics that may be demanded<br />
from a modern e-learning service.<br />
[8] J.C. Giarratano and Riley, G.D., Expert<br />
Systems: Principles and Programming - 3 rd<br />
edition. PWS Publishing Company, Boston,<br />
(1999).<br />
[9] http://www.nottingham.ac.uk/teaching/<br />
resources/methods/elearning/mathemat519/<br />
[10] http://www.wordreference.com/definition/<br />
pervasive<br />
References<br />
[1] http://europa.eu.int/comm/education/policies/<br />
2010/et_2010_en.html.<br />
[2] C-L. Hwang, and K. Yoon, Multiple attribute<br />
decision making. Springer-Verlag, Berlin-<br />
Heidelberg, New York, (1981).<br />
[3] C-L. Hwang, and Lin, M.J. Group Decision<br />
Making under Multiple Criteria. Springer-<br />
Verlag Berlin-Heidelberg, New York, (1997).<br />
[4] Anderson, T. (2003). Modes of Interaction in<br />
Distance Education: Recent Developments and<br />
Research Questions. In M. Moore & W.<br />
Anderson (Eds.), Handbook of Distance<br />
Education (pp. 129-144). Mahwah, New<br />
Jersey: Lawrence Erlbaum Associates, Inc.<br />
[5] Gibson, C. (2003). Learners and Learning: The<br />
Need for Theory. In M. Moore & W.<br />
Anderson (Eds.), Handbook of Distance<br />
Education (pp. 147-160). Mahwah, New<br />
Jersey: Lawrence Erlbaum Associates, Inc.<br />
[6] Rumble, G. (2001). Reinventing Distance<br />
Education, 1971 - 2001. International Journal<br />
of Lifelong Education, 20, pp 31-43.<br />
[7] Resteanu, C., F.G. Filip, C. Ionescu and M.<br />
Somodi (1996). On Optimal Choice Problem<br />
Solving. In Proceedings of SMC ‘96 Congress<br />
(Beijing, October 14-17). A.P. Sage and W.<br />
Zheng (Eds.), IEEE Publising House,<br />
Piscataway NJ, pp. 1864-1869.<br />
23
Integrated transportation and raw material handling system based on RFID<br />
technology and wireless data transmission. A case study for thermo power<br />
industry<br />
Authors:<br />
eng. Marian Lăcraru, eng. Livia Ştefan, eng. Liviu Nicolae Jalbă, eng. Iolanda Costache, eng.<br />
Ovidiu Anicăi – ITC Bucuresti<br />
SC ITC <strong>SA</strong> Bucharest, Calea Floreasca 167<br />
Tel: 021 2031.832, Email: marian.lacraru@itc.ro<br />
eng. dr. Eugen Pop – <strong>IPA</strong> Bucuresti<br />
SC ITC <strong>SA</strong> Bucharest, Calea Floreasca 167b<br />
Email: epop@itc.ro<br />
Abstract:<br />
The system aims to answer specific logistics requirements in the field of solid fuel supply for the<br />
power system industry, that is to reduce the handling of paper documents by managing the data<br />
flows regarding the supply activities through the implementation of new technologies and<br />
integration of all actors participating in this activity (suppliers, transporters, beneficiaries).<br />
Specific system targets are achieved: a) implementation of an AVI system (automatic identification<br />
for both for road and rail vehicles which performs the supply of coal, a system which based on<br />
RFID technology; b) implementation of an system for automatic generation of weighing receipts,<br />
through association the identification information with weighing informations; c) implementation<br />
of wireless communications solutions between the weighing points and the administrative buildings,<br />
in order to collect the data at a central database with information about vehicles, coal suppliers,<br />
coal weighing, or to replicate system information to all weighing points. This allows the integration<br />
of data into an economic and financial management system; d) implementation of information and<br />
reporting applications for all the entities involved in the supply of solid fuels.<br />
Keywords: RFID, AVI, automatic weighing system<br />
1.System description<br />
Logistic systems are in general large and geographically dispersed, their complexity is caused by many<br />
factors, including interactions between decision makers, drivers, workers and clients, vehicles, transport and<br />
storage processes, informatic and communication systems. Many aspects of the logistics processes are<br />
probabilistic, dynamic, nonlinear, which causes the logistics systems to be most sensitive to small<br />
perturbations. The management and control of modern logistics systems is based on distributed multi-layered<br />
and hierarchically organized levels. Policy makers, distributors, drivers, customers have different interests<br />
and goals, different educational levels and different work experiences. Each perceive the situation in<br />
different ways and make decisions based on subjective perceptions.<br />
An activity flow for the case study in the thermo power industry is below described:<br />
• the coal is loaded in the transport provider vehicles, which can be trucks or railroad cars;<br />
• at the beneficiary the vehicles are weighed both before and after the coal is unloaded from the vehicles;<br />
• the information is either recorded in a FoxPro database or in a electronic file at the weighing points<br />
toghether with vehicle identification data;<br />
• a confirmation of the delivery for goods and services settlement is produced and printed on a paper<br />
document/receipt.<br />
The current status on the settlement of goods and services is requested by a confirmation of the amount of<br />
the delivered coal quantities,which occurs as follows:<br />
a) at the unloading location, for the transportation operator is issued and handed to the driver a receipt for<br />
each unloaded coal quantity;<br />
b) for the providers and for the beneficiary (the thermo power station) is issued regularly, on paper, a receipt<br />
of the quantities delivered/received.<br />
24
To improve the existing situation, a modern solution is proposed, through an integrated management system<br />
of data flows for the supply system, with data accessibility across the entire supply chain from supplier to<br />
customer.<br />
The information will be available both in real time and historically, in form of activity reports, published on a<br />
web portal.<br />
The technologies for the proposed system encompass:<br />
• Passive RFID (transponders, readers and antennas);<br />
• WLAN network (Wireless LAN) integrated into existing networks;<br />
• LAN connection to the internet via mobile data communication solutions (mobile Internet);<br />
• databases and database services;<br />
• desktop applications;<br />
• web applications;<br />
• accessories (pillars, gates, connecting accessories).<br />
Figure 1 System architecture<br />
Figure1 is describing the system architecture, which integrates products, processes, people, organizations,<br />
data and information with the objective that the system have support for the whole life cycle, i.e., for<br />
different phases of activity, starting from the initial requirement identification and continuing with system<br />
design and development, production, operating system and supporting his closing cycle, recycling, disposal<br />
of materials.<br />
The above mentioned components include:<br />
• RFID solution for identifying weighing vehicles;<br />
• Databases;<br />
• The application for weighing vehicles automatic identification;<br />
• The web portal for reporting activities regarding the coal transportation and supply;<br />
• Data communication solutions and database synchronization.<br />
The architecture is territorially and information distributed, and encompasses:<br />
• the weighing POINTS distributed at the thermal power station premises;<br />
• the HEADQUARTERS of the thermo power station;<br />
• the system administrator’s HEADQUARTERS that provides infrastructure for database server and web<br />
server hosting for the portal application.<br />
2. The integrated system methodology<br />
25
To determine the specific requirements of a logistical system it is necessary a good knowledge of the entire<br />
environment, of the geographic location system in which the system is to be implemented and used, the users<br />
and the availability of the technologies and the associated resources, the procurement system, etc. Therefore<br />
it is necessary:<br />
• to take a total top-down system approach, with the logistic support infrastructure, included as a major<br />
subsystem and directed to a specific set of objectives;<br />
• to take a total life cycle approach;<br />
• to make an agile and extremely flexible configuration of the logistic support infrastructure, based on an<br />
open architecture.<br />
The system-level requirements suffer from constant requirements change, therefore the integration of these<br />
requirements (both horizontally and vertically) with other systems is becoming more complex.<br />
3. The integrated solution<br />
For the implementation of the system requirements, the following solutions (see Figure 2) were defined:<br />
• WLAN with the existing Ethernet network and mobile Internet connection, compliant with the current<br />
standard security level;<br />
• passive RFID hardware and software solutions for system tag enrollment in order to implement an<br />
automatic identification of vehicle and integration with the applications controlling the weighing process.<br />
• software solutions for data consolidation and database storage of the cargo vehicle identification data, of<br />
the bruto and tara weighing data, corresponding to a weighing ticket;<br />
• communication software for client-server bidirectional data transfer between the local points for vehicle<br />
weighting and the local administrative section, and between this and the central remote server for data<br />
collection and processing. Microsoft SQL Server replication services through wireless support are used;<br />
• a web solution for reporting purposes alongside the supply chain, providing customized content;<br />
• data level integration with the existing economic and financial management systems.<br />
Figura 2 The integrated delivery system solution, based on RFID and wireless technologies<br />
The RFID and the communication system are the integrator elements supporting the automated data<br />
collection through the supply chain.<br />
4. Conclusions<br />
26
The proposed solutions for implementation of an integrated logistics system are based on new and costeffective<br />
technologies, adecquate for the real conditions at the beneficiary’s premises. The solutions aim to<br />
automate and streamline the activities of coal supply in a thermo power plant, where currently there is not a<br />
uptodate standard computerized system for data collection and integration.<br />
The data collected in the system will be centrally processed and used by all stakeholders in the distributed<br />
supply chain through a web portal. For the financial settlements, it will be achieved a better support, planning<br />
and use of resources.<br />
Bibliography<br />
1. http://www.advanced-logistics.com;<br />
2. NICOLAESCU, Ovidiu, s.a., CARTA ALBA A IMM-urilor din România 2007, CNPIMM 2007<br />
3. http://www.zenitkft.hu/ro/szolgaltatasok.php, 7 sep 2009<br />
4. http://free-logistics.com/index.php/Spec-Sheets/Logistics-Supply-Chain-KPI/Reverse-Logistics-KPI.html,<br />
7 sep 2009<br />
5. “RFID Handbook: Fundamentals and Applications in Contactless Smart Cards and Identification”, Klaus<br />
Finkenzeller;<br />
6. "Designing RFID applications", ESTIIC, INTERMET, www.rfid-in-action.eu, 2006;<br />
7. " Automatic Vehicle Identification using RFID- A first hand experience", P.Butani, Dr. Joseph John,<br />
Major Akash Dhole.<br />
27
,<br />
PLURI-VECTORS RENEWABLE ENERGIES & HYDROGEN<br />
COMPLEX RESEARCH, EDUCATIVE, TRAINING,<br />
PRODUCTION PARK, AT <strong>IPA</strong> <strong>SA</strong>, BUCHAREST.<br />
Gheorghe Mincu Săndulescu, Univ. Professor Dr.<br />
Mariana Bistran, Principal Research Scientist,<br />
Florian Udrescu, Principal Research Scientist<br />
<strong>IPA</strong> <strong>SA</strong>, Bucharest, www.ipa.ro, san@ipa.ro<br />
Note: The authors thanks to the MEC / MER , CNMP, for the support in the<br />
achievement of the PLURI-VECTORS RENEWABLE ENERGIES & HYDROGEN<br />
COMPLEX RESEARCH, EDUCATIVE, TRAINING, PRODUCTION PARK, AT <strong>IPA</strong><br />
<strong>SA</strong>, BUCHAREST, for the support of the elaboration and publishing of this paper.<br />
In 2010, 50 years of research activities of <strong>IPA</strong> <strong>SA</strong> were accomplished, which was<br />
established in 1960, and about 40 years of <strong>IPA</strong> <strong>SA</strong> ‘ researches in renewable<br />
energies and monitoring of complex chemical processes.<br />
One of the interesting and important accomplishment of <strong>IPA</strong> <strong>SA</strong> / SICE team and<br />
department consists in realization of the complex Park: HYDROGENIA, at the <strong>IPA</strong><br />
<strong>SA</strong> premises, in Bucharest.<br />
The pluri-vectors of renewable energies and also Hydrogen applications Park at <strong>IPA</strong><br />
<strong>SA</strong> includes:<br />
PV systems, with the possibilities of experimentation of different types of PV<br />
panels, PV panels configuration, working at MPP, interfaces with the users,<br />
and the experimental platform, on the roof of <strong>IPA</strong> <strong>SA</strong> for PV systems<br />
measurements and experimentations,<br />
Eolian systems, including different types of eolian turbines, interfaces with<br />
turbines,<br />
Micro-Renewable Energies Sources, especially, micro-eolian systems and<br />
advanced configurations.<br />
Hydrogen Fuelled Fuel Cells and related, PC based, monitoring and<br />
supervising systems,<br />
Electrolysers, form the Hydrogen production,<br />
Tele-transmission and supervising systems.<br />
The following images present the part of the pluri-vectors renewable energies<br />
systems, respective part of PV systems, placed on the roof of the <strong>IPA</strong> <strong>SA</strong>.<br />
28
,<br />
29
,<br />
The following image present the working activities on the testing and experimentation<br />
platform installed on the <strong>IPA</strong> <strong>SA</strong> roof.<br />
The essential structure of the pluri-vectors renewable energies and also Hydrogen<br />
applications Park at <strong>IPA</strong> <strong>SA</strong> is illustrated in the following image:<br />
30
,<br />
UNIT n<br />
Fuel Cell<br />
EXTENSIONS<br />
UNIT x<br />
Inverter<br />
EXTENSIONS<br />
UNIT<br />
ENERGY<br />
ASSEMBLING<br />
Hydro gen<br />
UNIT 1.<br />
Storage<br />
UNIT 2.<br />
Fuel Cell 1<br />
UNIT 2.<br />
INVERTER 1<br />
c.c. / c.a.<br />
To c.c. users<br />
UNIT<br />
ENERGY<br />
ASSEMBLING<br />
UNIT 3.<br />
Fuel Cell 2<br />
UNIT 3.<br />
CONVERTER 2<br />
c.c./c.c.<br />
in<br />
in<br />
UNIT 4.<br />
PV<br />
Farm 1<br />
UNIT 5.<br />
INVERTER 1<br />
c.c. / c.a.<br />
c.a.<br />
c. c.<br />
UNIT 6.<br />
BATTERIES 1<br />
Energy flux a<br />
Energy flux b<br />
UNIT 5.<br />
INVERTER 2<br />
c.a. / c.c.<br />
UNIT 5.<br />
INVERTER 3<br />
c.c. / c.a.<br />
To c.a. users<br />
UNIT 5.<br />
Protection circuits for connection to c.a.<br />
UNIT 7.<br />
SYSTEM MONITORING<br />
UNIT K.<br />
PV FARM.<br />
EXTENSIONS<br />
UNIT x<br />
Inverter<br />
EXTENSIONS<br />
UNIT K.<br />
TURBINES.<br />
EXTENSIONS<br />
UNIT x<br />
Inverter<br />
EXTENSIONS<br />
The principal targets of this complex pluri-renewable energies and Hydrogen<br />
applications Park are:<br />
31
,<br />
A. Researches:<br />
Researches, inclusive on the pluri-renewable energies and Hydrogen Park in<br />
the urban areas and, separate in the rural areas.<br />
The compatibilities of the pluri-renewable energies, and especially of the wind<br />
turbines, with the urban environments, and urban rules of prohibiting eolian<br />
systems inside the urban areas,<br />
The acceptation and permitting of the Hydrogen applications inside the urban<br />
areas,<br />
The securities aspects, and the hazardous management at the implementation<br />
of the<br />
o Hydrogen systems,<br />
o Wind systems,<br />
o PV systems,<br />
o Other renewable systems.<br />
Wind Turbulences impact on the rural wind applications,<br />
Wind systems prohibiting rules, for the inside the wind systems inside the<br />
urban environments,<br />
Special focus on micro-renewable energies sources, especially on the microwind<br />
sources.<br />
B. Education<br />
C. Training.<br />
Pluri renewable systems,<br />
Hydrogen systems,<br />
Hybride systems.<br />
Systems control and Intelligent Systems control.<br />
Other important related scientific fields.<br />
in cooperation with different universities,<br />
in the adding of other scientific fields such as heat pumps, biomass, hydro.<br />
Direct and immediate training in the above fields.<br />
D. Pilot energy production and pilot operation.<br />
32
,<br />
E. Practical basis for the Participation in Joint Projects.<br />
F. Parts of the industrial activities.<br />
* * *<br />
The difficulties and obstacles in the achievement of this pluri-renewable energies and<br />
Hydrogen applications Park was many, but was, already with special efforts over<br />
passed.<br />
One important difficulty is generated by the fact that, many high level buildings are<br />
very quickly erected near the house on which we integrate this pluri-renewable<br />
energies and Hydrogen applications Park, growing the aspects, especially related to<br />
the shading, wind turbulences, hazards possibilities.<br />
The researches with this pluri-renewable energies and Hydrogen applications Park<br />
has generated multiple innovative accomplishment , between which 4 patents<br />
proposals submitted at OSIM.<br />
Between these patent proposals 2 are focused on the micro-wind systems inside the<br />
turbulent urban environment.<br />
Looking to cooperation which to include our expertise generated by this important<br />
and interesting this pluri-renewable energies and Hydrogen applications Park,<br />
Thanking you for yours attention, we wait yours questions and also we wait yours<br />
cooperation requests and proposals.<br />
33
Hydrogen and Renewable Energies in fighting against the<br />
3-rd Millenium crisis.<br />
Connections to the<br />
New European Directive on Renewables.<br />
GHEORGHE MINCU SĂNDULESCU<br />
Univ. Professor Dr. Eng., <strong>IPA</strong> <strong>SA</strong>,<br />
FLORIAN FILIP<br />
Academician, Vice President of the Romanian Academy, Academia Română,<br />
MARIANA BISTRAN<br />
Principal Research Scientist <strong>IPA</strong> <strong>SA</strong>,<br />
FLORIAN UDRESCU<br />
Principal Research Scientist <strong>IPA</strong> <strong>SA</strong>,<br />
Cornelia BISTRAN<br />
University of Medicine and Pharmacy “ Carol Davila “<br />
Mottos:<br />
„The Economical Crisis as a Chance<br />
This is the time to invest in the future” [2.]<br />
The authors thanks to the Ministry of Education and Research and to the CNMP<br />
National Center for the support in the development of researches in Hydrogen<br />
applications and Hydrogen fields.<br />
Welcome to this, considered by us, interesting paper.<br />
We notice that the critical level of ideas of the following material, has required the<br />
proven with the too abundent citations.<br />
The eHydrogenia sigle in connection with first Hydrogen applications.<br />
“In 1766, hydrogen was detected for the first time as a new gas. Henry<br />
Cavendish had the idea to decompose vapour with a very hot iron bar. In this<br />
decompose process arose the so called Hydrogene (v. Gr. Hudoor=water,<br />
Gennaoo=generate) or waterforming material, which was translated as<br />
hydrogen” [11.]<br />
34
“ Early 1800’s to mid 1900’s – Town gas, a gaseous product manufactured<br />
from coal, supplies lighting and heating for America and Europe. Town gas is<br />
50% hydrogen, ... . Town gas is celebrated as a wonder,<br />
bringing light and heat to the civilized world. “ [12.]<br />
In 1874 , Jules Verne, in The Mysterious Island has written: “I believe that<br />
water will one day be employed as fuel, that hydrogen and oxygen which<br />
constitute it, used singly or together, will furnish an inexhaustible source of<br />
heat and light, of an intensity of which coal is not capable.”[13.]<br />
.................................................................................................................................<br />
Now returning in the year 1783 – „Jacques Alexander Cesar Charles, a<br />
French physicist, launched the first hydrogen balloon flight. Known as<br />
"Charliere," the unmanned balloon flew to an altitude of three kilometers” .<br />
Only three months later, Charles himself flew the first manned hydrogen<br />
balloon.”<br />
The same pioneer has developed one people transport baloon.<br />
It has transported, in the year 1783, on about 3 miles, near Paris, at<br />
about 500 m high, 2 people and their sofa.<br />
This was one of the first, very visible and very sound,<br />
Hydrogen application,<br />
and in the year<br />
1783.<br />
This first, very visible, Hydrogen application has becomme the sigle of the<br />
European Conference eHydrogenia.<br />
35
Crisis and Hydrogen. Aspects at the global level.<br />
Hydrogen fuel appeared to have a massive future as a direct replacement for<br />
petrol/diesel. The aspect is close related to the of fossil fuel reserves.<br />
On the other hand the passing to the Hydrogen Economy is strong related to the<br />
energy consumption for the production of the Hydrogen:<br />
About 40 to 50 KW for the production of 1 Kg Hydrogen.<br />
1 Kg Hydrogen transports equivalent of about 30 KW.<br />
The Fuel Cells produce, from 1 Kg Hydrogen, about 15 KW<br />
electrical energy<br />
Global scale hydrogen production is connected to the consume of quantities of<br />
electrical energy, aspect which to seems to lead at the intensive use the nuclear<br />
energy, possible completed with the renewable energy.<br />
Following these considerations it is necessary to look at the complete scenario with<br />
minimum 3 vectors:<br />
Hydrogen as energy transporter,<br />
The extension of the Nuclear energy industry<br />
Waste management, where waste is the result of the nuclear energy<br />
production.<br />
Hydroge<br />
n as<br />
energy<br />
transport<br />
er,<br />
The<br />
extensio<br />
n of the<br />
Nuclear<br />
Energy<br />
Industry<br />
Nuclear<br />
Waste<br />
Management<br />
36
Following these considerations the Hydrogen Economy seems to be also, or firstly,<br />
one Nuclear Economy, and the solving the aspects of nuclear waste.<br />
„ If we can eventually attain a culture of less waste we may yet achieve a sustainable<br />
existence.” [1.].<br />
Crisis and Hydrogen. The economical crisis effects on the Hydrogen technology and<br />
developments<br />
„What is the effect of the current economical crisis on hydrogen and fuel cell<br />
technology? A great part of it is still in the development phase, with profits not at<br />
hand, and public funds play an important role. How strict is the rule of the red pencil?<br />
After a survey over the quite diverse sectors of the field we can conclude with some<br />
satisfaction that while hydrogen and fuel cells are by no means exempt from the<br />
symptoms of the crisis, they are as a whole less affected than conventional business.<br />
The findings of DWV are thus in line with those of other environment or energy<br />
associations which also say that future oriented technology and business fields suffer<br />
less than the conventional ones. „ [2.]<br />
Some results and trends:<br />
Daimler: the first serial B class cars with fuel cell will be ready before the end<br />
of this year, with the mass production from 2015.<br />
“Similar statements can be made for Volkswagen and Ford as well as for<br />
BMW.”<br />
GM has announced the starting in 2012, of the production of the Hydrogen<br />
cars [10.].<br />
„Industry insiders had speculated that the imminent retirement of existing boss<br />
Larry Burns would lead to the fuel-cell program being mothballed, but<br />
according to new R&D chief Alan Taub, GM will continue with its development<br />
of the technology.” [10.].<br />
“Technology leadership is one of the pillars of the company,” said Taub. “That<br />
is going to remain, and it will probably be emphasised as part of the brand of<br />
GM.” [10.].<br />
37
Toyota: announced also the mass production from 2015. [2.].<br />
The stationary applications seems also to not detect the crisis:<br />
-in Germany are developed big Fuel Cells, of over 200 KW,<br />
A big number of small fuel cells, especially of 5 KW, are sold, where SFC<br />
Smart Fuel Cells received this year an order for more than 200 portable fuel<br />
cells from Volkswagen (for stationary applications / mobile energy stations<br />
(where SFC Smart Fuel Cells has sell about 13000 Fuel cells in the last 5<br />
years).<br />
MTU Onsite Energy, has also made steps in advance in the Fuel Cells market.<br />
Positive news, inclusive in the Hydrogen policy.<br />
Joint Technology Initiative (JTI) of Fuel Cells and Hydrogen of the European<br />
Union is continuing the research programme; planed to run, normally up to<br />
2013, is in the normal development.<br />
„Developing New Energy for the future: Europe launches a 1 billion Euro<br />
project to get into pole position for the Fuel cells and Hydrogen race.<br />
On 14th October, the European Union and European Industry announce plans<br />
to make fuel cells and hydrogen one of Europe's leading new strategic energy<br />
technologies of the future. ........................<br />
The European Commission, the European Industry and the European<br />
Research Community, which compose this public-private Joint Technology<br />
Initiative<br />
(JTI), will invest together nearly 1 billion Euros over six years in fuel cells and<br />
hydrogen research, technological development and demonstration. The goal is<br />
to achieve mass-market roll-out of these promising technologies before 2020.”<br />
The powerful National Innovation Program Hydrogen and Fuel Cells in<br />
Germany, planed to run, normally up to 2016, is in the normal development.<br />
Naming at this time as un clear aspect, is the position of the US Government, under<br />
president Obama's new Secretary of Energy Steven Chu .<br />
Mr. Chu has deleted the 100 M$ funding for mobile hydrogen [2.], allocated for other<br />
mobile researchers, aspect which may to present a change towaed the reinforcement<br />
of new energy fields and energy fields applications.<br />
It may to detect the new possible US government way, comparing with previous,<br />
where, in 2003-2004 when it is writting<br />
38
„This interest was recently highlighted by the "Hydrogen Initiative" launched in the<br />
United States by President Bush during his January 28th 2003 State of the Union<br />
Address, in which he announced the goal of reversing America’s dependence on<br />
imported oil. The President's Hydrogen Fuel Initiative seeks to develop hydrogen,<br />
fuel cell, and infrastructure technologies needed to make it practical and costeffective<br />
for large numbers of Americans to use fuel cell vehicles by 2020” [4.].<br />
It is necessary to emphasise that this is the possible government trend which seems<br />
to differ, comparing with the some US industry signals, for instance with the new<br />
initiatives of the restructured GM.<br />
CRISIS AND RENEWABLE ENERGY<br />
There are some aspects and ideas which need to be emphsasised:<br />
Cheaper oil is diluting demand for energy efficiency in Europe, and tighter<br />
financing is making it difficult for rewable energy companies to expand, or<br />
even survive.<br />
The rising cost of capital is making it harder for both consumer and suppliers<br />
of alternative energy equipment and services to finance new green projects.<br />
„Now, with demand weakening and prices in decline, the green sector is<br />
hoping for more government support to carry it through the economic turmoil.”<br />
[8.]<br />
The crisis will set apart companies that can invest in renewable energy from<br />
those that cannot.<br />
„The European green energy sector may be able to take advantage of an<br />
unexpected new source of backing:<br />
the United States. President-elect Barack Obama is expected to focus some of<br />
his estimated $700 billion stimulus package on eco-friendly businesses.<br />
Denmark's Vestas, for example, already manufactures wind turbines in the US<br />
and could be well placed to profit from government investment in clean<br />
technology.<br />
Iberian renewable energy producers Iberdrola Renovables (EBER.F) and EDP<br />
Renovaveis (EDPR.LS)—already America's second- and third-largest wind<br />
energy producers, respectively -- similarly stand to benefit from federal<br />
assistance for renewables.” [8.]<br />
CONNECTIONS TO THE NEW EUROPEAN DIRECTIVE ON RENEWABLE.<br />
The European Parliamnent has adopted the DIRECTIVE 2009/28/EC OF THE<br />
EUROPEAN PARLIAMENT AND OF THE COUNCIL of 23 April 2009 on the<br />
39
promotion of the use of energy from renewable sources and amending and<br />
subsequently repealing Directives 2001/77/EC and 2003/30/EC.<br />
„Article 3 < from DIRECTIVE 2009/28/EC ><br />
Mandatory national overall targets and measures for the use of energy from<br />
renewable sources1.<br />
Each Member State shall ensure that the share of energy from renewable sources,<br />
calculated in accordance with Articles 5 to 11,<br />
in gross final consumption of energy in 2020<br />
is at least its national overall target for the share of energy from renewable sources in<br />
that year, as set out in the third column of the table in part A of Annex I. Such<br />
mandatory national overall targets are consistent with a target of<br />
at least a 20 %<br />
share of energy from renewable sources in the Community’s gross final consumption<br />
of energy in 2020. In order to achieve the targets laid down in this Article more easily,<br />
each Member State shall promote and encourage energy efficiency and energy<br />
saving. „ [16.] .<br />
„Agreement has been reached on the European Union Renewable Energy Directive<br />
that could pave the way for the economic bloc to achieve its plans<br />
for a 20% renewables contribution to total energy demand and<br />
a 20% cut in greenhouse gas emissions<br />
by 2020,<br />
he so-called 20:20:20 plan.” [15.]<br />
Now it is clear that the actions inside the crisis and after the crisis it is necessary to<br />
be correlated with these requirements.<br />
The Directive 2009/28/EC may to be, through the requirements, one stimulent in the<br />
anti-crisis actions, for the growing of the reneable energy integration and the growing<br />
of the new labour places.<br />
The sources emphasize that the Member States may use cooperation mechanisms<br />
to reach their targets, face to the requirements of the New EU Directive on<br />
renewable:<br />
40
Statistical transfer of RES target shares between MS<br />
Joint projects between MS<br />
Joint projects between MS and third countries<br />
Joint support schemes [17.].<br />
ONLY REFLECTIONS, NOT CONCLUSIONS.<br />
„The social significance of the energy economy makes is necessary to use the<br />
whole spectrum of sustainable energy sources as well as that of storage,<br />
transport, and conversion technologies, depending on the application. This is<br />
the energy mix of tomorrow. Hydrogen and fuel cells are part of it.” [3.].<br />
We do not neglect the differences between US, Europe and US government<br />
ways of development in the fields of the Hydrogen applications, firstly in<br />
mobile fields, with the emphasising of possible differences between the US<br />
industry trends (which claim the mass production of Hydrogen cars from<br />
2012), and US government new orientation in researches balance.<br />
Important steps in Hydrogen developments promotion are generated by the<br />
fact that, between May 17 and 21 next year, the German city of Essen will be<br />
the world capital of hydrogen energy for one week. The 18. World Hydrogen<br />
Energy Conference will be held in North Rhine-Westphalia, together with an<br />
exhibition.<br />
The Hydrogen developments in firms remain very active.<br />
The Hydrogen developments under governmental and / or European umbrella<br />
remain active, especially based on the governments and EU supports,<br />
inclusive FP7 Programme.<br />
We do not neglect the differences between US, Europe and US government<br />
ways of development in the fields of the Hydrogen applications, firstly in<br />
mobile fields, with the emphasising of possible differences between the US<br />
industry trends (which claim the mass production of Hydrogen cars from<br />
2012), and US government trends.<br />
The renewable diminishes the positive trends and require government<br />
supports.<br />
The Hydrogen and renewable have the potential to create many new labour<br />
places and fight against the crisis.<br />
“First round of RES-E and RES transport targets for 2010; most MS are<br />
lagging behind their national targets<br />
41
New, more ambitious RES directive with binding targets pushes for further<br />
growth of renewable until 2020 .<br />
Member States have to do serious effort to reach their targets” [17.]<br />
But above sentenced aspect is also one important chlenge for the industry and<br />
services, the launching of the new labour places, component of success in the<br />
fighting against the crisis.<br />
Excerpt of the Bibliography.<br />
[1.] Chris A Watkins:<br />
The Fossil Fuel Crisis – Hydrogen as an Alternative.<br />
http://www.streetdirectory.com/travel_guide/214007/mileage_and_fuel/the_fossil_fuel_crisis__hydroge<br />
n_as_an_alternative.html<br />
[2.] Published by the German Hydrogen and Fuel Cell Association (DWV), Berlin<br />
Editor: Dr. Ulrich Schmidtchen, Berlin : Hydrogen and Fuel Cells in times of the Crisis<br />
How do countries and industry cope with the problems?<br />
http://www.dwv-info.de/e/index.html<br />
[3.] Published by the German Hydrogen and Fuel Cell Association (DWV), Berlin<br />
Editor: Dr. Ulrich Schmidtchen, Berlin :<br />
Germany to host the Hydrogen world<br />
Preparations for Hydrogen Energy World Conference enter final phase<br />
http://www.dwv-info.de/e/index.html<br />
[4.] A. Wokaun, U. Baltensperger, K. Boulouchos, F. Gassmann, W. Hoffelner, P. Jansohn, R.<br />
Palumbo, G. Scherer, A. Steinfeld, S. Stucki,<br />
IntroductionThe Role of Hydrogen<br />
in a Future Sustainable Energy System<br />
Under which Circumstances does a Hydrogen Economy Make Sense?<br />
Paul Scherrer Institut and ETH Zurich<br />
October 18, 2004<br />
[5.] *** HOW TO SOLVE THE FINANCIAL CRISIS<br />
PLAN B = PLAN BIOREACTION<br />
http://www.solvethefinancialcrisis.com/<br />
[6.] *** Crisis will filter renewable energy projects<br />
Ziarul Financiar 17.11.2008<br />
[7.] *** Reportlinker Adds Global Renewable Energy Market Growth Amidst Financial<br />
42
Crisis.(Industry overview)<br />
Business Wire | June 4, 2009 | Copyright<br />
[8.] Mark Scott: Not Easy Being Green. The Downturn Hits Renewable Energy<br />
http://www.spiegel.de/international/business/0,1518,593921,00.html<br />
[9.] C. de Keizer, E.A. Alsema, W. van Sark<br />
Socio-Economic Aspects of Photovoltaic Energy Technology<br />
December 2006<br />
Report NWS-2006-250<br />
Department of Science, Technology and Society<br />
Copernicus Institute<br />
Utrecht University<br />
[10.] Originally Posted by Andrew Williams GM to Sell Hydrogen Fuel-Cell Car By 2012 Aug 18th,<br />
2009, http://www.theglobalwarmingstatistics.org/global-warming-blog/gm-to-sell-hydrogen-fuel-cellcar-by-2012<br />
[11.] *** H2 a solution for the future. http://library.thinkquest.org/C0110881/hydrogen_en.html<br />
[12.] *** Hydrogen Now. http://www.hydrogennow.org/Facts/History.htm<br />
[13.]*** The History of the Hydrogen.<br />
http://www.hydrogenassociation.org/general/factSheet_history.pdf<br />
[14.] Andreas Züttel, Andreas Borgschulte, Louis Schlapbach (Eds.): HYDROGEN AS A FUTURE<br />
ENERGY CARRIER, WILEY-VCH Verlag GmbH & Co. KGaA, Weinheim, GERMANY, ISBN: 978-3-<br />
527-30817-0, 2008, XIV+427 pages.<br />
[15.] Renewable Energy World.Com: EU Passes New Climate Directive , 10 decembrie 2008<br />
[16.] DIRECTIVE 2009/28/EC OF THE EUROPEAN PARLIAMENT AND OF THE COUNCIL<br />
of 23 April 2009 on the promotion of the use of energy from renewable sources and amending<br />
and subsequently repealing Directives 2001/77/EC and 2003/30/EC<br />
(Text with EEA relevance)<br />
[17.] ***Developing New Energy for the future: Europe launches a 1 billion Euro<br />
project to get into pole position for the Fuel cells and Hydrogen race<br />
Brussels, 14 October 2008, New Energy World.<br />
http://ec.europa.eu/research/fch/index_en.cfm?pg=events<br />
http://ec.europa.eu/research/fch/pdf/1billioneuro_fch_race_14oct08.pdf#view=fit&pagemode=none<br />
43
Measurement methods regarding the quotations of a<br />
Permanent GNSS station in altitudinal system MN 75<br />
PhD. Eng STOIAN Ioan , PhD. Eng. OLARU VIRGIL<br />
Abstract: The scope of the paper is to benchmark in the system of normal altitudes, with<br />
reference plan The Black Sea 1975 (ed. 1990), the GNSS permanent functioning stations and to<br />
search based on a comparative study the possibilities of use of the GPS technology for this type<br />
of works.<br />
To achieve the benchmarking of the GNSS permanent working stations (RN-SGP)for<br />
integrating them in a national altitude system two complementary type of works are necessary,<br />
that do not have to be executed successively, in field operation could have been done in reverse<br />
order.<br />
The first operation consists in sending a benchmark from two points of levelling of the<br />
national-network or local network at two or three points that should be materialized during the<br />
listing and benchmarking operation<br />
These points will be established on the spot depending on the visibility. Points will be<br />
materialized on the ground.<br />
The second operation consists in the transmission through polar levelling of the<br />
benchmark to the permanent station. After permanent station sites descriptions, for sure one will<br />
meet on the spot the following two situations:<br />
a) The variant where ground targeting is possible directly to the permanent station.<br />
b) The variant where is no possibility of direct targeting. In this situation it is mandatory<br />
to materialize at least one point to which can be covered from the ground and to have visibility<br />
between this point and the permanent station.<br />
Keywords: GNSS permanent station, normal altitude system,<br />
1. Introduction<br />
The scope of the paper is to benchmark in the system of normal altitudes, with reference<br />
plan The Black Sea 1975 (ed. 1990), t he GNSS permanent functioning stations and to search<br />
based on a comparative study the possibilities of use of the GPS technology for this type of<br />
works.<br />
To achieve the benchmarking of the GNSS permanent working stations (RN-SGP)for<br />
integrating them in a national altitude system two complementary type of works are necessary,<br />
that do not have to be executed successively, in field operation could have been done in reverse<br />
order.<br />
The first operation consists in sending a benchmark from two points of levelling of the<br />
national-network or local network at two or three points that should be materialized during the<br />
listing and benchmarking operation<br />
These points will be established on the spot depending on the visibility. Points will be<br />
materialized on the ground.<br />
44
The second operation consists in the transmission through polar levelling of the<br />
benchmark to the permanent station. After permanent station sites descriptions, for sure one will<br />
meet on the spot the following two situations:<br />
a) The variant where ground targeting is possible directly to the permanent station.<br />
b) The variant where is no possibility of direct targeting. In this situation it is mandatory<br />
to materialize at least one point to which can be covered from the ground and to have visibility<br />
between this point and the permanent station.<br />
The 49 stations from RN–SGP installed until now, are provided with GNSS equipment<br />
produced by Ashtech, Leica and Topcon, the types of antennas are Ashtech ASH701945B_M,<br />
Leica AT504, Leica AT504 GG, Leica AX1202 or Topcon CR-G3,with standardized dimensions<br />
and performing.<br />
To achieve this work, starting from the need to achieve a precision of +/- 30mm for<br />
antennas marking, a manufacturing project was made in the CNGCFT level, describing to the<br />
manner of implementation, of technical, human and material means necessary and of the work<br />
stages.<br />
The listing SGP antennas has been agreed to be achieve by the short distance polar<br />
levelment, less than 200m in this case, done in two or three points materialized on the ground<br />
with metal stakes (witness) placed in positions from which to see the antenna , stakes that were<br />
benchmarked by geometric levelling precision through levelling lines scored in geometrical<br />
landmark of orders I-IV.<br />
In parallel to classical methodology, and with GPS technology on one of the stakes,<br />
usually noted on the number 1, aiming to establish under what conditions of accuracy one can<br />
determine the difference in level and benchmark at the reference point of the antenna (ARP) of<br />
the permanent station compared with the classical method.<br />
2. Field operations<br />
2.1. Land recognition<br />
Based on inventories of benchmarks required by the National Geodetic Fund (FNG), in<br />
field were recognized the pikes of geometrical, approx. 4-5 points at each GSP, regardless of the<br />
order of lines in which are included, but subject to the condition of being as easily accessible and<br />
to be at a smaller distance from the permanent station.<br />
One can understand that due to the large percent of destruction of the pikes, that means<br />
marks of type A and B, RNG, type IV terminals, etc., from the lines of geometrical levelment,<br />
this goal was not always respected and in extreme cases where all the steaks were destroyed<br />
instead were used buried steaks, type RNA IGFCOT (Steak of Depth Levelment) or ground<br />
steaks type I-III, DTM or IGFCOT, from which to mark the witness pikes..<br />
Starting with the measurements of stage IV it was decided that where the steaks of<br />
geometric leveling are situated at about 1-1.2 km and they are suitable to be stationed with GPS<br />
technology and if the distance is greater, to be stationed in SGP marker for surveying and two<br />
receivers to be placed on the points listed to ensure a geometry in order to study the degree of<br />
accuracy and distance until you can provide an accuracy comparable to that imposed on those<br />
works or similar ones.<br />
45
During the recognition of the work, there have been done descriptions of sites for witness<br />
stakes planted, and their picture, a picture of the stake and four pictures on the cardinal direction<br />
points (obstructions) for each of them.<br />
In the file created for each GSP was prepared a "Draft of planting" on which was set the<br />
Final position of the network consisting of witness stakes and marks of geometric levelling of the<br />
antenna that was quoted.<br />
2.2. Geometric levelling<br />
After carrying out the reconnaissance work, depending on the geometrical levelling pikes<br />
of Ord-IV lines identified in the field and through the materialisation of witness metal stakes that<br />
were rated for the GSP-sized antennas, one has switched to the execution of precision geometric<br />
levelling for their listing.<br />
Surveying measurements were made as the methodology, in terms of geometrical<br />
levelling of ord.II, in which differences in level of 4 values are obtained, two on each direction,<br />
and has-been imposed a tolerance of +/-2mm Lkm .<br />
The surveying team, used a spirit level Zeiss Ni002, with a 3m Invar, with dual scale and<br />
measurements were made with equal portions of up to 35m, corresponding to its levelling of ord.<br />
0.<br />
Observations were recorded in specific books for levelling precision, two surveying books<br />
for each section (one on each direction), books that were made to field calculations, checking<br />
compliance with tolerance and calculating the differences in average level , lengths of sections,<br />
the tolerance level and the difference between difference of level to and fro.<br />
Depending on the number of benchmarks found and their distance from the SGP, rating<br />
was performed by suspended road windings by closed (polygon) road windings, taking all the<br />
measures for the results to be entered in order of their levelling executed tolerance and the order<br />
of the line which were part the used pikes .<br />
To determine the differences of height, telescope axis of the targeting instrument from<br />
the point marked on the ground, is measured by surveying levelling poles with invar band.<br />
2.3. Polar levelling<br />
As in very rare situations, you can transmit the ARP's benchmark by the polar distance<br />
method which is widely accepted for this kind of work, and ensuring accuracy comparable with<br />
the method of geometrical levelling of the III ord. (+/-10mm Lkm )and better for distances up<br />
to 200m.<br />
The mode of listing was inspired by listing the descent to the ground triangulation points<br />
of city networks, where these are located on the pilasters on tall buildings, but in this situation the<br />
zenith observations from witness pegs to the GSP antennas, were not mutual but only from<br />
ground to antenna, targeting being executed on a target sights consisting of a collant with a cross<br />
with a horizontal wire located at 3 cm of the base , which was applied on the antenna to its base,<br />
on the directions on which could be observed from the control points.<br />
Accuracy of results is directly influenced especially by the precision with which the device<br />
and measured the height of the signal (target elevation) were measured, and the scoring accuracy.<br />
46
The observations have been made with Leica TCR 1203 observation station, in three<br />
levels of height of the apparatus with three pointing in each level, that is that for each station<br />
minimum nine values of level difference have been done from the witness metal stake to the<br />
BCR and to the ARP antenna.<br />
For each GSP was given a notebook in which are registered field observations and<br />
calculations for the 9 series of level differences measured in each of the 2 witnesses metal stakes,<br />
from which were determined the rates from above.<br />
The spread of individual values ranged from differences in level has been situated at a<br />
minimum of 1.0 mm in witness pike nr.1 (SLO1) and maximum of 5.4 mm in witness stake nr. 2<br />
(SLO2), by chance both in the levelling network of the antenna of SGP Slobozia.<br />
Regarding the spread of these individually obtained values, very good in principle for this<br />
kind of measurements, the spread between the rates transmitted from the antenna of the two<br />
witnesses stakes geometrically ranged has varied between 0 mm at SGP Lehliu and 6 mm at<br />
SGP Buzău, the general dominant value being 2 mm at the other stations.<br />
2.4. GPS Observations<br />
In parallel with conventional technology, GPS technology was used by stationing one of<br />
pickets, usually the one at No. 1, aiming to determine under what conditions one can accurately<br />
determine the difference in level at the antenna reference point ( PRA) of the permanent station<br />
compared with the classical method. This action was carried out in parallel with the polar<br />
execution control pike No. 2, the period of observation was 2 hours and the equipment used is a<br />
kit Trimble 4000 SSE with all the necessary annexes.<br />
As noted before, close stakes positions were chosen primarily on grounds of being as<br />
close and see the antenna's of the SGP and not take into account the obstructions which adversely<br />
affect the GPS observations.<br />
After the first step it was recommended to choose an area with no obstructions, one would<br />
plant even a third metal stake that though it does not see the antenna SGP it should be rated as<br />
the others, in order to take out height antenna with most attention and according to the existing<br />
form and especially at the beginning and end of observations period.<br />
To study the possibilities of implementing SGP listing with GPS technology in all campaigns of<br />
measurements one have materialized one or two stakes at greater distances, up to 1834 km at<br />
SGP Timişoara.<br />
3. Processing of measurements.<br />
After field work, geometric and trigonometric levelling observations were calculated in<br />
the field books and have made the necessary checks to ensure the quality of observations and also<br />
if tolerances were met.<br />
In the office the calculations were verified and centralized for each SGP, the summary<br />
tables in which analysis and calculations have been done.<br />
Regarding the GPS measurements, after completion of field work phase, the observations<br />
were downloaded from the receivers and were centralized on the sessions, the calculations were<br />
checked and antenna heights were checked from DGC (Department of Geodesy and Cartography)<br />
the observations from each SGP and every session. ID of the witness stakes was derived from<br />
47
the ID of the SGP, one has changed the last letter with the figure 1, 2 or 3, according the<br />
stationed pike.<br />
Processing of GPS observations were performed with TGO v1.0 software.<br />
Listing of the 49 permanent stations GNSS was performed in 7 stages of measurements,<br />
the 8th round is listing of the permanent station GNSS Bucuresti. Since from one stage to<br />
another, the system design of routes and the geometric and trigonometric levelling have<br />
improved, in the following we shall present the conclusions emerged from measurements of<br />
phases IV, V, VI, VII, and the geometric levelling route done in Bucharest, as an Annex. Also, in<br />
these latter stages GPS observations were made not only in position 1 where polar measurements<br />
were made but also at longer distances.<br />
Some statistics on these measures will cover all stages of measurements.<br />
3.1. Comments on the measurements made<br />
Based on ellipsoid rates obtained by GPS technology, and shares obtained by the classical<br />
technology on peg 1, in the Comparative Table of obtained SGP levels with levelling differences<br />
determined with GPS technology and classic technology, have been calculated the differences of<br />
level at the ARP through the two methods, their values being between -13mm at SGP BISTRIŢA<br />
NÃSÃUD antenna and -15 mm at SGP DOROHOI antenna.<br />
The differences obtained have been calculated between the ARP levels obtained through<br />
classic means and through GPS technology, the values of the differences to the distance of about<br />
1km, being between -7mm at SGP DOROHOI and +38 mm at SGP DOROHOI station.<br />
3.2. Conclusion.<br />
The scope of the paper is to benchmark in the system of normal altitudes, with reference<br />
plan The Black Sea 1975 (ed. 1990),the GNSS permanent functioning stations and to search<br />
based on a comparative study the possibilities of use of the GPS technology for this type of<br />
works.<br />
The results obtained with the two technologies, classic and GPS, with small exceptions,<br />
are very good, the differences between the levels determined with the classic technology , as a<br />
reference and the levels obtained with the GPS technology for the GNSS permanent stations for<br />
the 4 stages of measurements, are very good and demonstrated by the fact that the maximum<br />
value in absolute value is–15mm and thus not exceeding the tolerance demanded by the<br />
beneficiary, which is +/-30mm. Starting and analysis of the data obtained at this stage,<br />
statistically, in the following table (tab.1) are going to be presented in percentage, the<br />
differences obtained through the two technologies, in stage VII<br />
Tab.1<br />
Nr. Spacing No. of SGP Percent<br />
1 0- 5mm 1 20%<br />
2 5-10mm 2 40%<br />
3 10-15mm 2 40%<br />
4 15-30mm - -<br />
5 30-35mm - -<br />
Total 5 100%<br />
48
As we can see at all the 5 SGPs , that is 100% of the SGP benchmarked through the two<br />
technologies during the current stage, the spacing is under +/-15mm, the maximum value being<br />
at SGP Dorohoi.<br />
A statistic of the first seven stages, the spread rates determined from points close , under<br />
200m by the two technologies are presented in the table below (tab.2):<br />
Tab.2<br />
Nr. Spacing No. of SGP Percent<br />
1 0 - 5mm 21 48%<br />
2 5-10mm 7 16%<br />
3 10-15mm 9 20%<br />
4 15-30mm 3 7%<br />
5 > 30mm 4 9%<br />
Total 44 100%<br />
By analysing the tab.2, we can draw the following conclusions:<br />
- at a rate of 48% of the stations listed, the difference between the SGPs rates sites<br />
determined by the two technologies is under + /-5mm, a percentage of 91% of the stations listed<br />
have accuracy below + / -30 mm, the difference of 9% i.e. 4 out of 44 stations listed up to now,<br />
are not falling in the imposed tolerance of + / -30 mm and it is sure that this is due to misconduct<br />
cases reported above;<br />
- out of these stations one has a difference of 51 mm (ARA1) and is therefore affected<br />
by errors, and two have differences that overpass by little the imposed tolerance, namely up to<br />
+32 mm.<br />
These two statistical tables relating to the ARP's shares of the antennas determined by<br />
witnesses placed at distances up to 200m from the SGP, and after stage IV we can conclude that<br />
at larger distances up to 1km and even over 1km, listing with GPS technology can be used,<br />
leading to good results in terms of compliance with a tolerance to + / -30 mm.<br />
From the data obtained in phases IV, V, VI and VII (29 values, 8 of which at this stage)<br />
in the table below is presented statistically the following situation:<br />
Tab.3<br />
Nr.<br />
Spacing<br />
No. of<br />
SGP<br />
Percent<br />
Nr.<br />
1 00-10mm 12 41% D
following two, one of the distances from the point of cl. B, BT04 is 2.9 km, but it should be noted<br />
that tolerance is not exceeded at any of the 4 stations, with more than 2mm.<br />
It should be noted that in these last 4 stages, in which has experienced the listing with<br />
GPS technology of the permanent stations, in compliance with tolerance of + /-30mm, the points<br />
listed geometrically located at greater distances of 0.20 km, up to about 2,9 km were used outside<br />
the points quoted geometrically and 5 Class B GPS points of the network of Romania, executed<br />
in 2003, were quoted as geometrical points in the phase of the year 2007, when work triggered to<br />
achieve a geometric qvasigeoid, when they were geometrical listed 48 Class B or C points, placed<br />
uniformly across the country.<br />
Of these 5 points, BT04 point has exceeded with only 1mm the tolerance at 2.94 km and<br />
points TM04 and NT04 have exceeded the tolerance with 2mm at 2.38 km the first and the<br />
second with 7mm at 0.35 km.<br />
The other two points, respectively BN03 and HR03, the first located at 0.28 km of SGP<br />
Gheorgheni exceeds by far the tolerance, with the difference of 0.210 m and the second situated<br />
at 2.38 km from Bistrita SGP also exceeds the tolerance, with the difference of 0.118 m.<br />
These 2 points are not the only points which give these large of the differences and allow<br />
us to reaffirm that they are not wrong geometrical levels but the ellipsoidal level errors, which<br />
have values determined separately from the SGP that are located in the sites with about 5 years<br />
before put them into operation.<br />
We consider that all these points of the class B network, reported at the completion of<br />
the class C network in counties during 2007 and 2008 and the specific work of antennae<br />
benchmarking at SP GNSS, of the last year, must be the object of a special paper dedicated to the<br />
verification and redetermination.<br />
As in all stages of measurements already done, the quasi-geoids ondulations were<br />
calculated from the ellipsoid GRS80 with the formula:<br />
H ETRS89 =H N +ζ (1)<br />
In which :<br />
- H ETRS89 the ellipsoid level GRS80, determined through the GPS technology;<br />
- H N the normal level to the quasi-geoids, determined through precision levelment;<br />
- ζ the height of the quasi-geoids to the ellipsoid;<br />
It is noted that after seven stages of measurements, 44 of SP GNSS antennas from the<br />
counties (tab.2) were rated by two methods. Listing was made from 73 witness points and GPS<br />
stationed, of which 44 points were evidenced by metal stakes and placed at max. 0.2 km of the<br />
antennas to be quoted by a short polar distance levelment and 29 points were located at greater<br />
distances, on average, about 1.0 km and more, with a maximum of up to 2.9 kilometres from the<br />
antenna and consisting of metal stakes as new points, that are located in positions with very good<br />
GPS location and quoted by geometric levelling, or Class B terminals from the ETRS89 network,<br />
geometrically listed in 2007 or now located in areas close to the GSP sites in each county in<br />
question. .<br />
If for short distances, up to 0.20 km, the conclusions presented are clear, at greater<br />
distances, a statistic that can be looked upon in tab.3, gives us the possibility to state that<br />
approximately 80% of measurements fall within the tolerance of + / - 30mm when the distance<br />
provided by the GPS listing station from SGP varies between 0.3 km and 2.1 km, and differences<br />
in values for about 60% of measurements are very good, that is in + / - 20mm.<br />
50
We shall make a comparison and analysis of the rates determined through classical<br />
method, with GPS technology and with Transdat v3.03 and do assessments on these results.<br />
We have analyzed each SGP rates and of the witnesses from which the levels have been<br />
determined by the three methods, reference being obtained by classical methods of shares<br />
geometric and trigonometric levelling and which will be compared and discussed the other two<br />
methods<br />
From the differences of the three methods of levelling, the values are in – 17mm at the<br />
level of SGP DORO obtained through GPS technology at a distance of 0,05km from the steak<br />
DOR1 and +37mm at the level SGP PINT, obtained from de cl.B, NT04 point, obtained through<br />
GPS technology at a distance of 0,35km.<br />
The 15 levels differences, besides that from SGP PINT obtained from NT04, have values<br />
under the tolerance of +/- 30mm, with the exception of the difference of +36mm from DOR3 and<br />
of the difference of +32mm from CIU3, both at relatively long distances.<br />
The extreme values for the other SGP-s, are between +0,108m in steak BIS4 and<br />
+0,302m in SGP PINT. It is possible that there differences to appear not to the levels determined<br />
with the GPS technology but to the calculation mode of Transdat v3.03 in the domain of level<br />
transformation.<br />
Of the 4 counties that are part of Phase VII, 3 are located in the north central area of the<br />
country and include Bistrita Nasaud, Harghita and Neamt and one is isolated in the north-east<br />
of the country, bordering with the Republic Moldova, namely Botosani County.<br />
The medium differences on the three coordinates, are between -0,129m and +0,097m on<br />
X axis, between – 0,148m and +0,196m on Y axis and between -0,22m and +0,37m on H level,<br />
as it should be normal with the largest difference on the level, the largest values being at SGP<br />
Piatra Neamţ.<br />
Bistriţa Năsăud County, the most western of the counties of this stage, has one SGP at<br />
Bistriţa. The two variants of Transdat v3.02 and v3.03 an the Helmert transformation have<br />
generated values of the plan coordinate differences that are between -0,8cm and +8,9cm on X<br />
and between +7,4cm and +5,5cm on Y and values between +14,0cm and +9,0cm, on the height.<br />
The number of points with common coordinates on one county is of 12 points disposed in<br />
an uniform way on the surface, and the Transdat, in v3.02 and v3.03, has generated differences of<br />
+9,7cm on X, -1,9cm on Y and -5,0cm on H.<br />
Between the levels at v3.03 of the precise determined level, the difference is of +12,6cm,<br />
an almost identical value with the one that is the failure of the difference of the two methods of<br />
levelling, on the B class terminal BN03, that is +11,8cm.<br />
We recall that probably to stabilize the value of converted coordinates from one version to<br />
another of the application Transdat, will occur when in the network one will not introduce new<br />
common points.<br />
We can state that the values obtained with the Helmert transformation remain the most<br />
precise and consistent values to old or new zone points and their values do not change, even if<br />
common points are introduced in the county, in the neighbouring counties or in the network.<br />
Harghita County, situated in the centre of this stage, has two SGP, one at Gheorgheni, in<br />
the north, and one at Miercurea Ciuc, in the south.<br />
The two variants of Transdat v3.02 and v3.03 an the Helmert transformation have<br />
generated values at SGP Miercurea Ciuc of the plan coordinate differences that are between -<br />
0,7cm and +4,9cm on X and between -9,6cm and +0,5cm on Y and values between -29,0cm and<br />
-24,0cm, on the height.<br />
51
Between the levels, at v3.03 to the precise determined mark, the difference is +20,0cm,<br />
value almost identical with the wrong one, difference between the two levelling methods, on the<br />
class B terminal, HR04, that is +21,0cm situation already signalled and with its cause somehow<br />
defined..<br />
The number of points with common coordinates at the county level, is about 10 points<br />
almost uniformly disposed on the surface of the county, and v3.02and v3.03 have generated<br />
differences of -2,1cm on X, +10,1cm on Y and +4,0cm on H.<br />
At SGP Gheorgheni, we had no possibility of Helmert transformation, and v3.02 and<br />
v3.03 have generated differences -2,7cm on X, -1,7cm on Y and -17,0cm on H these values being<br />
generated by 10 common points disposed at the level of the county.<br />
Neamţ County, the most eastern of the counties of this stage, for both versions of<br />
Transdat has used 11 common points.<br />
The two versions of Transdat v3.02 and v3.03 and the Helmert transformation have<br />
generated values of plan coordinate differences of -12,9cm and -6,6cm on X, between +18,7cm<br />
and +19,6cm on Y and values between +37,0cm and +15,0cm, on the height.<br />
Between the levels of the SP GNSS antenna, at v3.03, of the precise determined level the<br />
difference is +30,0cm, almost identical value with the wrong difference between the two methods<br />
of levelling, on the class B terminal, NT04, that is +24,0cm, the geometrical level of this terminal<br />
being predetermined and now being correct and usable in any work.<br />
Between v3.02 and v3.03 of Transdat have been generated coordinate differences<br />
+6,3cm on X, +0,9cm on Y and -22,0cm on H, the correct value being the one from v3.02.<br />
Botoşani County, is a north-east situated county, and from Transdat, v3.02 at v3.03, has<br />
beneficiated of the increase of common points from 9 points to 41 points as a results of the<br />
achievement of the class C network, and of the mounting in 2008 of the SP GNSS Botoşani.<br />
Between the two versions of Transdat v3.02 and v3.03 and Helmert transformation, the<br />
differences of coordinates are -0.2cm and +5.8cm on X, between -14,8cm and +2,7cm on Y and -<br />
3,0km and +1,0cm, on level H.<br />
There are differences between the results obtained using the two versions of Transdat and<br />
their values have similar behaviour to those found in Suceava County, in the earlier stages.<br />
From the analysis of the mode of change from Transdat v3.03, to v3.02, we can draw the<br />
following conclusions :<br />
- Introducing of new points with coordinates that are in common, in the grid similar to<br />
Nadcon grid of U.S., produce regional effects with significant differences between the two<br />
versions and have no particular explanation especially for planimetry coordinates, but which may<br />
have differences falling within the tolerances that are in the precision of triangulation network of<br />
ord.I-IV.<br />
- The transformed coordinate values in the areas of common ground density of about 1<br />
pct/200 skm, lead to coordinates with similar values and differences with the Helmert<br />
transformation, especially in plane coordinates.<br />
- Any new point introduced in the network with common coordinates, produces system<br />
influences and modifies the transformed coordinates with the new version.<br />
- In these circumstances it is clear that the Helmert transformation is very good, because<br />
all the rates that are determined by Helmert method, are directly comparable with the rates<br />
determined directly.<br />
52
In the following we are going to do a statistical analysis on 5 groups of distances, from<br />
0,15km to 2,9km, from 500 to 500m, for 29 level differences, determined through GPS<br />
technology and measured in stages IV - VII.<br />
Out of the 29 differences, 24 differences from the first four groups fall within the<br />
tolerance of + / - 30mm the situation being the following on groups of distances:<br />
- gr. I, distances from 150m to 500m, has four differences with values between -7mm to<br />
+26 mm with a medium difference value of 13.3 mm;<br />
- gr. II, distances from 500m to 1000m, has nine differences with values between -16mm<br />
to +17mm with a medium difference value of 7,1mm;<br />
- gr. III, distances from 1000m la 1500m, has eight differences with values between -<br />
29mm to +29mm with a medium difference value of 13,4mm;<br />
- gr. IV, distances from 1500m to 3000m, has three differences with values between<br />
+25mm to +31mm for a distance of 2,9km, with a medium difference value of 28,0mm;<br />
In gr.V there are 5 distances, from the 29 analysed, that overpass the tolerance of +/-<br />
30mm, with values between 2mm and 8mm.<br />
In gr.VI we have the two cl.B points with wrong ellipsoid marks, with the values<br />
mentioned before , levels that influence the precision of the geometrical quasi-geoide that is in<br />
train of construction.<br />
Analyzing this group of measurements, we can say with certainty that for distances up to<br />
1500m, with normal precautions of design and location of control points and of measuring the<br />
antenna height with certainty, differences in level measured by GPS technology provides easy fit<br />
into tolerance + / - 30mm. For longer distances, up to about 3000m, the above entry in tolerance<br />
can be achieved in good condition by taking additional measures in the design phase. However<br />
for listing permanent GNSS stations located during the year 2009 it is advisable to keep the same<br />
method used for determining the levels during 2009.<br />
References<br />
1. Demidovich, B.P. & Maron, I.A.: Computational Mathematics. Mir Publishers, 1981.<br />
2. Dragomir, V., Ghiţau, D., Mihailescu, M., Rotaru, M.: Teoria Figurii Pamantului, E.T., 1977<br />
3. Dragoescu, I., Radulescu, F., Nacu, V., Stiopol, D.: Participarea Romaniei la intocmirea<br />
hartilor gradientilor orizontali ai miscarii verticale ale scoartei terestre pentru zona Carpato-<br />
Balcanica si pentru zona statelor est-europene. Analele IGFCOT, vol.X, 13-24 pp, 1989.<br />
4. Fotescu, N. & S`vulescu, C.: Teoria Erorilor. Litografie, ICB, 1988.<br />
5. Helmert, F.R.: Die mathematischen und physikalischen Theorien der höheren Geodäsie.<br />
G.G.Teubnez Verlag, Leipzig, 1880 ]i 1962.<br />
6. Nacu, V., Radulescu, F., Mateciuc, D., Stiopol, D.: Study of the deformation parameters in<br />
Gruiu-Caldarusani geodynamic polygon. XXIII General Assembly of European<br />
Seismological Commission, Activity Raport 1990-1992, 345-348 pp., Proceedings, vol II,<br />
Prague, Checkoslovakia,1992.<br />
7. Nacu, V., Radulescu, F., Mateciuc, D.: Horizontal deformations in the Gruiu-Caldarusani<br />
geodynamic polygon of Romania, Rev. Roumaine de Geophysique 37, 1993.<br />
8. Nacu, V., Mateciuc, D., Moldoveanu, C, Ilies, A.: Horizontal deformations in the Gruiu<br />
Caldarusani Test - Polygon of Romania. Mitteilungen aus den Geodätischen Instituten der<br />
Rheinischen Friedrich - Wilhelms - Universität Bonn, 1994.<br />
53
ZONING OF AREAS AND POPULTED CENTERS FOR REDUCING<br />
THE EFFECTS OF NATURAL DI<strong>SA</strong>STERS<br />
PhD. Eng STOIAN Ioan , PhD. Eng. OLARU VIRGIL<br />
National Centre of Geodesy, Cartography, Photogrametry and Remote Sensing, Bucharest<br />
Abstract: For monitoring natural hazards are necessary zoning of areas within<br />
localities to reduce the effects caused by frequent natural disasters such as: floods,<br />
landslides, earthquakes, etc.. In all cases for zoning are necessary maps in digital format and<br />
the digital model of the terrain - MDT. For damage assessment and decision making it is<br />
important that these maps are suitable to the simulation, according to the obtained results<br />
from simulations to determine exactly which area will be affected with a high probability.<br />
Based on these forecasts we can do multiple scenarios progressing, risk analysis, detailed<br />
simulations.<br />
This involves handling a large number of very diverse data unevenly distributed<br />
geographically. Zoning areas within areas and populated centres is intended to reduce the<br />
effects of flooding.<br />
Keywords:<br />
1. Introduction<br />
For monitoring natural hazards are necessary zoning of areas within localities to<br />
reduce the effects caused by frequent natural disasters such as: floods, landslides,<br />
earthquakes, etc..<br />
In all cases for zoning are necessary maps in digital format and the digital model of<br />
the terrain - MDT. For damage assessment and decision making it is important that these<br />
maps are suitable to the simulation, according to the obtained results from simulations to<br />
determine exactly which area will be affected with a high probability. Based on these<br />
forecasts we can do multiple scenarios progressing, risk analysis, detailed simulations.<br />
This involves handling a large number of very diverse data unevenly distributed<br />
geographically.<br />
Zoning areas within areas and populated centres is intended to reduce the effects of<br />
flooding.<br />
Flood risk management means applying policies, procedures and practices with the<br />
objectives of identifying risks, their analysis and evaluation, treatment, monitoring and<br />
reassessment to reduce their risk so that human communities, so that all citizens can live,<br />
work and meet the aspirations in a sustainable physical and social environment .<br />
Flood risk is characterized by the nature and probability of producing, the exposure of<br />
receptors (number of population and goods), the susceptibility to flooding of receptors and<br />
their value, resulting that risk reduction needs to be done on influencing its characteristics.<br />
The main problem in the management of flood risk is the one of the accepted risk by<br />
the public and the decision makers, knowing that there is no total protection against flooding<br />
(zero risk), as there is no consensus on acceptable risk. Consequently, acceptable risk must be<br />
the result of a balance between risks and benefits attributed to an activity as a consequence of<br />
risk reduction to flooding, or of a governmental regulation.<br />
Mitigating the consequences of flooding is the result of an extensive combination of<br />
preparatory measures and actions before the occurrence of the phenomenon, the management<br />
54
during the flood and post flood (reconstruction and lessons learned as a result of the<br />
occurrence of the phenomenon).<br />
As a result, at global level it is used a more complete concept of flood management<br />
that includes both flood risk management and management of emergencies caused by floods.<br />
In order that the government's, the authorities and relevant agencies, the community efforts, to<br />
be coordinated and have the result of a community prepared to face the phenomenon of<br />
floods, the flood management must be addressed in an integrated manner.<br />
2. Prevention activities (prevention, protection and preparation).<br />
These actions are focused to prevent / reduce potential damage caused by floods by:<br />
• avoid construction of housing and social buildings, cultural and / or economic ones<br />
in potential flood areas, with the presentation of data on the effects of previous floods in<br />
planning documentation, adapt of the future developments to the flood risk terms, promoting<br />
appropriate practices of the use of land and of agricultural land and forestry;<br />
• producing structural protection measures, including the bridges and small bridges;<br />
• development of non-structural measures (control of the use of minor water beds,<br />
basin plans for flood risk reduction use and of measures programs, introducing of security<br />
systems etc.);<br />
• identification in detail, of the geographical demarcation of the natural flood risk<br />
areas - fig. 1 . of an administrative unit of the territory , the inclusion of these areas in the<br />
general urban plans and regulations provided for the planning of specific measures for<br />
prevention and mitigation of flood risk, the carrying out of construction and of land use;<br />
• deployment of forecasting, warning and alert systems for cases of flooding;<br />
• maintenance of the existing flood protection facilities and of the beds<br />
watercourses;<br />
• implementation of protection works against flooding of the rivers in the area of<br />
existing bridges and small bridges;<br />
• communicating with people and educating them on flood risk and how to act in<br />
emergency situations.<br />
3. Operational management activities (emergency management) to be taken<br />
during the development of the flood phenomenon.<br />
• detect potential floods and the formation of probable floods;<br />
• flood forecasting for the evolution and spread along water courses;<br />
• warning of the authorities and population on the extent, severity and time of<br />
occurrence of the floods;<br />
• organization and response actions of public authorities and population on emergency<br />
situations;<br />
• provision of resources (material, financial, human) at the county level for operative<br />
intervention;<br />
• enable of the operational institutions, resource mobilization, etc..<br />
55
Fig. 1 identification of natural flood risk areas<br />
Activities to be undertaken after the flood phenomenon:<br />
• helping to meet the immediate needs of people affected by disaster and the return to<br />
normal life;<br />
• reconstruction of damaged buildings, of infrastructure and of those of the flood<br />
protection system;<br />
• review of flood management activities in order improve the planning of intervention<br />
that will deal with future events in the affected area and in other areas .<br />
Assessing the vulnerability of exposed elements, material damage and human losses<br />
Vulnerability refers to the ability of an item exposed during the impact of natural<br />
hazards. Definition of vulnerability of a natural hazard generally refers to the characteristics<br />
of an element exposed to the hazard – road, building, person, economic and social objective -<br />
that contributes to the ability of this element to resist and to recover following the impact of<br />
natural hazards.<br />
Through GD 447/2003 vulnerability is defined as the degree of impairment of an item<br />
or group of items in an area exposed to landslides. Is expressed in a scale from 0 (no loss) to 1<br />
(total destruction). For loss of human lives, vulnerability is the probability that a life located<br />
in the area is affected by the landslide activity, and to be lost if the landslide occurs.<br />
Vulnerability of people is a matter difficult to assess, making it normally the subject of<br />
socio-economic and administrative investigations that are very extremely detailed, and which<br />
unfortunately were not provided by Romanian law and were not done in Romania (until now).<br />
Social vulnerability, which assesses the individual's ability to recover from<br />
involvement in natural hazards can be analyzed on four following different levels:<br />
• Individual in domestic environment (refers to the attributes / personal potencies of<br />
response);<br />
• Community (refers on the response of the individual with the social environment in<br />
which it develops);<br />
• Regional / geographic (distance to the work of the employee);<br />
• Administrative / institutional (the funds allocated to disaster and to prevention<br />
studies).<br />
This simplification aims to illustrate that there are various factors that contribute to<br />
social risk, due to natural hazards, including those that are relating to the administration of<br />
regional environmental hazards in the region or at home, going up to individual attributes.<br />
56
Table 1.Categories of elements exposed to landslides and the coefficients of vulnerability<br />
buildings (regardless of destination /<br />
use)<br />
Housing, urban social, economic<br />
buildings<br />
Pipes (any type)<br />
electric lines, telecommunications<br />
Of poured concrete, concrete panels 0,05<br />
foundation concrete, brick masonry (see<br />
rules)<br />
Foundation + masonry brick foundation,<br />
wood building<br />
0,2<br />
0,3<br />
foundation stone + brick masonry 0,7<br />
adobe 0,92<br />
parallel to contour lines 0,8<br />
oblique to the contour lines 0,4<br />
perpendicular to the contour lines 0,1<br />
0,3<br />
National-maintained roads according to 0,1<br />
Norms<br />
paved county roads- maintained according 0,3<br />
to Norms<br />
Roads<br />
communal paved - maintained according to 0,4<br />
Norms<br />
Unpaved Public - maintained according to<br />
Norms<br />
0,5<br />
Unpaved, unmaintained 0,7<br />
Railways 0,1<br />
Lands<br />
Non arable 0,1<br />
Arable 0,5<br />
Rare forest<br />
Partially exploited 0,5<br />
Unexploited 0,1<br />
Dams 0,05<br />
Irrigation channels 0,2<br />
In Tables 2 and 3 are written concrete data of the Lower Danube area, the data used<br />
to develop risk maps.<br />
Zoning areas and populated centres to reduce the effects of landslides.<br />
In the risk assessment, were established following values of the vulnerability factors,<br />
assigned to the elements set out and exposed to landslides - Table 1<br />
57
Table 2. Data for risk map development in the area of Dunărea de Jos – Loc. Lunca<br />
Data for risk map development<br />
On location<br />
On landslides<br />
affected areas<br />
Number of inhabitants 476 150<br />
Number of buildings affected by landslides 135 35<br />
Number of<br />
constructions<br />
Half-timber - -<br />
Wood - -5<br />
Bricks 130 35<br />
Stone/Concrete 5 0<br />
Coverage of the municipality constructed surfaces 30%<br />
Medium annual precipitation and temperature<br />
values<br />
Indicative value of<br />
municipality surface<br />
(lei)<br />
Built 4000/ha 1000/ha<br />
Cultivated<br />
2000/ha<br />
500/ha<br />
Agriculture 2000/ha 500/ha<br />
Indicative value of<br />
Forest - -<br />
the land terrain (lei)<br />
Pasture<br />
2500/ha<br />
Half-timber - -<br />
Indicative value of a Wood - -<br />
medium household Bricks 150000 50000<br />
Stone/Concrete - -<br />
Total number of km Asphaltated - -<br />
of roads Non-asphaltated 4 2<br />
Number of administrative, socio-cultural,<br />
educational, sports buildings.<br />
1 1<br />
Total number of Of concrete 7 3<br />
bridges Of wood - -<br />
Number of dams - -<br />
Total number of<br />
water reservoirs<br />
Total number of<br />
industrial units<br />
Total number of km<br />
of railways<br />
Number of railway<br />
constructions<br />
Number of hydro<br />
facilities<br />
- -<br />
- -<br />
2 -<br />
1 -<br />
- -<br />
Table 3. Data for risk map development in the area of Dunărea de Jos – Loc. Tăuni<br />
58
Data for risk map development<br />
On location<br />
On landslides<br />
affected areas<br />
Number of inhabitants 398 100<br />
Number of buildings affected by landslides 245 50<br />
Number of<br />
constructions<br />
- - -<br />
- -5 -5<br />
245 50 35<br />
- - 0<br />
Coverage of the municipality constructed surfaces 30%<br />
Medium annual precipitation and temperature<br />
values<br />
Indicative value of<br />
municipality surface<br />
(lei)<br />
7000/ha 1500/ha 1000/ha<br />
6000/ha 3000/ha 500/ha<br />
6000/ha - 500/ha<br />
Indicative value of<br />
- - -<br />
the land terrain (lei)<br />
3000/ha<br />
2000/ha<br />
- - -<br />
Indicative value of a<br />
- - -<br />
medium household<br />
40000 15000 50000<br />
- - -<br />
Total number of km<br />
- - -<br />
of roads 14 1 2<br />
Number of administrative, socio-cultural,<br />
educational, sports buildings.<br />
1 -<br />
Total number of<br />
5 2 3<br />
bridges - - -<br />
Number of dams - - -<br />
Total number of<br />
water reservoirs<br />
Total number of<br />
industrial units<br />
Total number of km<br />
of railways<br />
Number of railway<br />
constructions<br />
Number of hydro<br />
facilities<br />
- - -<br />
- - -<br />
- - -<br />
1 - -<br />
- - -<br />
Material losses are considered direct losses, which relate to direct damage to housing<br />
and infrastructure and that are easiest to quantify. We have not taken into account indirect<br />
losses relating to the economic consequences such as loss of value, rising of unemployment<br />
and other indirect economic effects, which are more difficult to assess / estimate<br />
In the present context, one of the most important requirements of seismological<br />
research is the realization of a methodology for developing hazard and risk maps. This<br />
requirement derives, on one hand, from the accelerated economic and social developments,<br />
59
which impose also reviews on technical rules of construction, zoning and planning and,<br />
secondly, the alignment requirements (harmonized) European standards, based on results of<br />
research conducted in the last decade in the related scientific and technical fields.<br />
4. Zoning of areas and populated centres in order to reduce the effects of<br />
earthquakes<br />
Another necessity for achieving such a development methodology for hazard and risk<br />
maps is that in recent decades, natural disasters, particularly earthquakes, were much more<br />
frequent and destructive, affecting large population concentrations. So far, the international<br />
community's response to the frequent disasters caused by hazards has been mainly focused on<br />
rescue and relief activities of the affected population, actions that in fact, do not solve the<br />
problem, but only improve post disaster situations. In this case, scientists in the field of<br />
seismology intensified theoretical and experimental studies (in situ and in laboratories) for<br />
investigation of natural and anthropogenic causes which have contributed to the occurrence of<br />
losses of lives and property. Thus, the tradition was continued, that immediately after a major<br />
earthquake, to perform inventory and assessment of macro seismic effects, supported through<br />
an international cooperation, which enabled the accumulation of a vast material on how large<br />
earthquakes act on man and environment, on buildings, construction and the surface of the<br />
earth.<br />
From the analysis and processing of information, one have found to be possible to<br />
reduce losses of lives and material goods, by taking all the measures required by the situation,<br />
through the management (supervision and control) of the post-disaster crisis. But the most<br />
important measure of prevention and mitigation of potential future seismic disasters as a<br />
solution is the adoption of modern seismic design made based on seismic hazard maps, valued<br />
at global, regional and local levels.<br />
Among other fundamental concepts of operating the seismic design of civil and<br />
industrial objectives, an important role goes to concepts of seismic hazard, seismic<br />
vulnerability and seismic risk.<br />
4.1. The seismic hazard is independent of human activity and is beyond human<br />
control, being determined only by natural factors, such as produced earthquake magnitude,<br />
epicentre distance, depth of the furnace, the direction towards the fault plane relative to the<br />
point M in which is calculated the hazard, the relationship between rupture length and<br />
magnitude, the maximum possible magnitude of the source, intervals after the earthquakes of<br />
this magnitude can be repeated again, the local geological structure given in point (M).<br />
4.2. The seismic hazard (H) is a function P (Y>y) that describes the possibility that in<br />
a given point (M) and in a time frame (T), the value of the parameter Y (that can be : macro<br />
seismic intensity, acceleration, velocity of displacement of soil) to exceed the given value (y)<br />
as an effect of an earthquake (no matter where its furnace is). The seismic hazard can be<br />
expressed analytically as a family of point functions or graphically by a family of curves<br />
showing the probability of occurrence of different values of the chosen parameter:<br />
H = P (Y > y) (1)<br />
4.3. Seismic vulnerability (V) is a measure of the ratio between the amount of losses<br />
due to damage caused by an earthquake and total (economic and social) value before<br />
producing the damage in a given area.<br />
60
4.4. Seismic vulnerability observed (VO) is represented by the determined seismic<br />
vulnerability assessment made after an earthquake caused damage.<br />
4.5. Predicted seismic vulnerability (VP) is calculated on the basis of vulnerability<br />
anticipation of a future earthquake, taking into account potential damage to the most<br />
vulnerable targets<br />
Seismic vulnerability depends mainly on human activity by how the earthquake<br />
protection objectives were constructed and their by their economic value.<br />
It also depends on the wear vulnerability and weakness of the resistance of structures<br />
due to repeated subjection to factors that can weaken it (previous earthquakes, industrial<br />
vibration, etc.).<br />
The general trend is that vulnerability increases with time, both because of higher<br />
value of the targets that can be destroyed (by installing advanced technology, sophisticated<br />
apparatus, etc..) and also due to the resistance weakening of old plants.<br />
4.6. Specific seismic risk (r S ) is a function expressing the probability that in a given<br />
location to produce in a given time, a certain percentage of total losses (economic and social),<br />
as the effect of an earthquake that might take place there, effects characterized of considered<br />
parameter values (intensity, acceleration, speed of soil) greater than a certain value.<br />
Specific seismic risk can be expressed by the relation:<br />
r s = H x V (2)<br />
Where: r s is the specific seismic risk;<br />
Relation (2) expresses a probability of a compound event and is given as a product of<br />
elementary probabilities H and V (the law "and-and" corresponding to the fact that they<br />
happen simultaneously both the effects described by H and those described by V). To the limit<br />
when there are no objects on the soil surface, V = 0 so r s is null.<br />
Another extreme case is when r s = 0 is of an area far enough of seismic sources, so the<br />
earthquakes effects (wherever they happen) will not be felt in the area. It results in this case<br />
that the hazard will be zero, and according the relation (1) the risk is null, even if the existent<br />
values in the area are large.<br />
4.7. The seismic risk (R) is the probability to produce a damage of a total given value ă<br />
(V tot ) in a point where the specific seismic risk is r s , so:<br />
R = r s . V tot (3)<br />
From (1) and (2) results that one can express the seismic risk (R) by means of seismic<br />
hazard (H) and of vulnerability :<br />
R = H . V . V tot (4)<br />
4.8. Seism tectonic method of seismic zoning. Establishment of regional maps through<br />
the seism tectonic method<br />
Conventionally, based on historical and instrumental seismic data, Romania was<br />
divided into nine provinces of physiographic-seismological areas, divided themselves into<br />
smaller parts called zones (Mârza Constantinescu, L. & V., 1980) - Figure 2.<br />
61
In general, it is widely accepted the assumption that Zona Seismogenă Vrancea,<br />
located in the Eastern Carpathians bend is cantered on an active triple junction following<br />
major tectonic units: Placa Est-Europeană, subplaca Intra-Alpină şi subplaca Moesică.<br />
Closely related to the outbreaks distribution, we can mention the existence of a strong<br />
movement of neotectonic ascension and thickening sedimentary lair, a total of 18 km, of<br />
which 12 km are part of the Sarmato-Pliocene deposits (Gavăt et al., 1973).<br />
In the Vrancea Seismogene Zone, earthquakes occur inside the crust ( in crustal<br />
earthquakes with depths less than 60-70 km) and, especially, under the crust (sub crustal<br />
earthquakes, with depths exceeding 70 km).<br />
Fig.2. The provinces<br />
The hypothesis of the active triple junction in the area of curvature of the Eastern<br />
Carpathians is supported, on one hand by prestigious papers, regarding the tectonics and<br />
seismicity of Romania's territory and, on the other hand, historical information, the hypothesis<br />
was verified by characteristic earthquakes genesis in the Vrancea area.<br />
Structural development schemes with hydro defence works against floods, up to this<br />
period, have been centred on economic and social objectives aimed or at defending specific<br />
areas where they are located more complex social - economic development facilities.<br />
The climate changes that followed, showed great intensity of rainfall with long periods<br />
of time and floods have generated chains of water flows with residual changes from one flood<br />
to another, of the hydro geological characteristics of soil, of riverbed morphology, of<br />
structural characteristics of hydraulic works. In this case it was found that losses due to such<br />
complex phenomena, with extreme probabilities, are much higher than producing in a single<br />
flash with maximum flow associated with a lower probability of occurrence.<br />
Flooding curves calculations are carried out by these studies have a high accuracy<br />
level and are based on topographic surveys, hydrological, hydraulic works carried out on the<br />
water (roads, bridges, rapids, etc..), and on the effects of existing hydraulic works in the<br />
proposed scheme of arrangement and on those proposed to be developed.<br />
If a sufficient number of points where we can write equation (7) exists, then we can<br />
create a pattern of anomalies altitudes, so in the future, one can be calculated knowing the<br />
ellipsoid altitude, the normal altitude and / or knowing the normal altitude , the ellipsoid<br />
altitude. Such a model can be used in practice, either in a flat representation system for<br />
projection (equidistant contours) or numerical in an automatic computing application.<br />
5. The theory spline interpolations<br />
62
It would seem that in the case of polynomial interpolations, the quality increases with<br />
the degree of polynomial interpolation used. Unfortunately, this is not generally true, for<br />
different functions, polynomial interpolation tend to swing more and more between nodes<br />
with increasing polynomial degree. Therefore, it is possible to occur some numerical<br />
instability.<br />
Such oscillations are avoided by the method "spline" functions initiated by<br />
IJSchromberg in 1946 (Quarterly of Applied Mathematics), widely used today.<br />
The name comes from "draftman's spline"which is an elastic rod (as the fishing lines)<br />
folded to pass through the data points and held in place by gravity.<br />
This interpolation is a polynomial interpolation "from pieces".<br />
Given f(x) on interval J , one divides the interval J in sub-intervals with common<br />
extremities “nodes”.<br />
a =≤ x < x < ⋅⋅⋅ < x =<br />
0 1<br />
n<br />
b<br />
(5)<br />
One can look for a function g(x)<br />
with which interpoles the function f (x)<br />
so we can<br />
have in the nodes g ( x)<br />
= f ( x)<br />
, so g ( x0)<br />
= f ( x0<br />
), g(<br />
x1)<br />
= f ( x1),<br />
⋅⋅⋅,<br />
g(<br />
xn)<br />
= f ( xn<br />
) If the<br />
polynome g(x)<br />
that describes each of the sub-intervals, allows that g(x)<br />
to be several times<br />
differentiable, the resulted function is called “spline” .<br />
Generally the method is numerically established, because g (x)<br />
oscillates very<br />
difficult. The simplest spline interpolations use linear functions, but these features chart is<br />
unfortunately a broken polygonal line, which in some cases does not satisfy. For this reason, it<br />
is still considered cubic spline functions g (x)<br />
, on a≤ x≤<br />
b , as a continuous function and<br />
taking derivative of order 1 and 2 anywhere in between That is why g(x)<br />
is formed of n<br />
polynoms, one for each sub-interval.<br />
References<br />
1. Georgescu E.- Zonarea seismica a Romaniei - Laboratorul de Evaluarea Riscului Seismic<br />
si Actiuni in Constructii – INCERC<br />
2. Păntea, A., Marmureanu, Gh., Radulian, M., Anghel, M., Moldovan I., Constantin P.,<br />
(2004) - Methodology for assessing local seismic hazard maps for urban areas,<br />
Governamental Order No.782/28/04/2004, published in: Official Gazette of Romania, Part<br />
I, No. 1221/20/12/2004, indicative: MP-026-04 and in Construction Bulletin, 111pp.<br />
3. Felix Jose1 and Gregory W. Stone - Forecast of Nearshore Wave ParametersUsing MIKE-<br />
21 Spectral Wave Model<br />
4. Nacu V. -<br />
5. Stoian I. - Modelări şi simulări pentru monitorizarea hazardurilor şi riscurilor naturale-<br />
Cap.6.1.din cadrul Tezei de doctorat<br />
63