0_ CUPRINS - IPA SA
0_ CUPRINS - IPA SA
0_ CUPRINS - IPA SA

You also want an ePaper? Increase the reach of your titles
YUMPU automatically turns print PDFs into web optimized ePapers that Google loves.
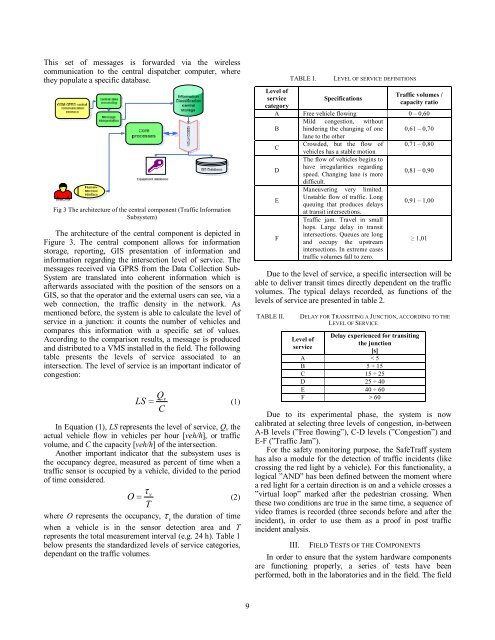
This set of messages is forwarded via the wireless<br />
communication to the central dispatcher computer, where<br />
they populate a specific database.<br />
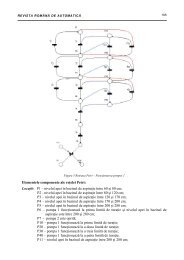
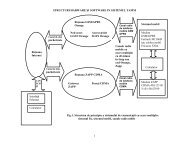
Fig 3 The architecture of the central component (Traffic Information<br />
Subsystem)<br />
The architecture of the central component is depicted in<br />
Figure 3. The central component allows for information<br />
storage, reporting, GIS presentation of information and<br />
information regarding the intersection level of service. The<br />
messages received via GPRS from the Data Collection Sub-<br />
System are translated into coherent information which is<br />
afterwards associated with the position of the sensors on a<br />
GIS, so that the operator and the external users can see, via a<br />
web connection, the traffic density in the network. As<br />
mentioned before, the system is able to calculate the level of<br />
service in a junction: it counts the number of vehicles and<br />
compares this information with a specific set of values.<br />
According to the comparison results, a message is produced<br />
and distributed to a VMS installed in the field. The following<br />
table presents the levels of service associated to an<br />
intersection. The level of service is an important indicator of<br />
congestion:<br />
Qv<br />
LS= (1)<br />
C<br />
In Equation (1), LS represents the level of service, Q v the<br />
actual vehicle flow in vehicles per hour [veh/h], or traffic<br />
volume, and C the capacity [veh/h] of the intersection.<br />
Another important indicator that the subsystem uses is<br />
the occupancy degree, measured as percent of time when a<br />
traffic sensor is occupied by a vehicle, divided to the period<br />
of time considered.<br />
O= (2)<br />
T<br />
where O represents the occupancy, τ<br />
v<br />
the duration of time<br />
when a vehicle is in the sensor detection area and T<br />
represents the total measurement interval (e.g. 24 h). Table 1<br />
below presents the standardized levels of service categories,<br />
dependant on the traffic volumes.<br />
τ<br />
v<br />
Level of<br />
service<br />
category<br />
TABLE I.<br />
LEVEL OF SERVICE DEFINITIONS<br />
Specifications<br />
Traffic volumes /<br />
capacity ratio<br />
A Free vehicle flowing 0 – 0,60<br />
Mild congestion, without<br />
B hindering the changing of one 0,61 – 0,70<br />
lane to the other<br />
C<br />
Crowded, but the flow of 0,71 – 0,80<br />
vehicles has a stable motion<br />
The flow of vehicles begins to<br />
have irregularities regarding<br />
D<br />
0,81 – 0,90<br />
speed. Changing lane is more<br />
difficult.<br />
Maneuvering very limited.<br />
E<br />
Unstable flow of traffic. Long<br />
queuing that produces delays<br />
0,91 – 1,00<br />
at transit intersections.<br />
F<br />
Traffic jam. Travel in small<br />
hops. Large delay in transit<br />
intersections. Queues are long<br />
and occupy the upstream<br />
intersections. In extreme cases<br />
traffic volumes fall to zero.<br />
≥ 1,01<br />
Due to the level of service, a specific intersection will be<br />
able to deliver transit times directly dependent on the traffic<br />
volumes. The typical delays recorded, as functions of the<br />
levels of service are presented in table 2.<br />
TABLE II.<br />
DELAY FOR TRANSITING A JUNCTION, ACCORDING TO THE<br />
LEVEL OF SERVICE<br />
Delay experienced for transiting<br />
Level of<br />
the junction<br />
service<br />
[s]<br />
A < 5<br />
B 5 ÷ 15<br />
C 15 ÷ 25<br />
D 25 ÷ 40<br />
E 40 ÷ 60<br />
F > 60<br />
Due to its experimental phase, the system is now<br />
calibrated at selecting three levels of congestion, in-between<br />
A-B levels (”Free flowing”), C-D levels (”Congestion”) and<br />
E-F (”Traffic Jam”).<br />
For the safety monitoring purpose, the SafeTraff system<br />
has also a module for the detection of traffic incidents (like<br />
crossing the red light by a vehicle). For this functionality, a<br />
logical ”AND” has been defined between the moment where<br />
a red light for a certain direction is on and a vehicle crosses a<br />
”virtual loop” marked after the pedestrian crossing. When<br />
these two conditions are true in the same time, a sequence of<br />
video frames is recorded (three seconds before and after the<br />
incident), in order to use them as a proof in post traffic<br />
incident analysis.<br />
III.<br />
FIELD TESTS OF THE COMPONENTS<br />
In order to ensure that the system hardware components<br />
are functioning properly, a series of tests have been<br />
performed, both in the laboratories and in the field. The field<br />
9