- Page 1 and 2:
Version 10 Scripting Guide “The r
- Page 3:
INDIRECT OR CONSEQUENTIAL DAMAGES O
- Page 6 and 7:
6 Capturing a Script for a Data Tab
- Page 8 and 9:
8 Repeat . . . . . . . . . . . . .
- Page 10 and 11:
10 Getting a Data Table Object . .
- Page 12 and 13:
12 Build Your Own Displays from Scr
- Page 14 and 15:
14 Using the mouse . . . . . . . .
- Page 16 and 17:
16 B Discrete Probability Functions
- Page 19 and 20:
Chapter 1 Learn about JMP Documenta
- Page 21 and 22:
Chapter 1 Learn about JMP 21 Book C
- Page 23 and 24:
Chapter 1 Learn about JMP 23 Book C
- Page 25 and 26:
Chapter 1 Learn about JMP 25 Additi
- Page 27 and 28:
Chapter 1 Learn about JMP 27 Additi
- Page 29 and 30:
Chapter 2 Introduction Welcome to t
- Page 31 and 32:
Chapter 2 Introduction 31 What JSL
- Page 33 and 34:
Chapter 2 Introduction 33 Terminolo
- Page 35 and 36:
Chapter 2 Introduction 35 Terminolo
- Page 37 and 38:
Chapter 3 Getting Started Let JMP W
- Page 39 and 40:
Chapter 3 Getting Started 39 Captur
- Page 41 and 42:
Chapter 3 Getting Started 41 Captur
- Page 43 and 44:
Chapter 3 Getting Started 43 Gluing
- Page 45 and 46:
Chapter 3 Getting Started 45 Gluing
- Page 47 and 48:
Chapter 4 Scripting Tools Using the
- Page 49 and 50:
Chapter 4 Scripting Tools 49 Using
- Page 51 and 52:
Chapter 4 Scripting Tools 51 Using
- Page 53 and 54:
Chapter 4 Scripting Tools 53 Using
- Page 55 and 56:
Chapter 4 Scripting Tools 55 Workin
- Page 57 and 58:
Chapter 4 Scripting Tools 57 Debug
- Page 59 and 60:
Chapter 4 Scripting Tools 59 Debug
- Page 61 and 62:
Chapter 4 Scripting Tools 61 Debug
- Page 63 and 64:
Chapter 4 Scripting Tools 63 Debug
- Page 65 and 66:
Chapter 4 Scripting Tools 65 Debug
- Page 67 and 68:
Chapter 4 Scripting Tools 67 Debug
- Page 69 and 70:
Chapter 5 JSL Building Blocks Learn
- Page 71 and 72:
Chapter 5 JSL Building Blocks 71 JS
- Page 73 and 74:
Chapter 5 JSL Building Blocks 73 JS
- Page 75 and 76:
Chapter 5 JSL Building Blocks 75 Op
- Page 77 and 78:
Chapter 5 JSL Building Blocks 77 Op
- Page 79 and 80:
Chapter 5 JSL Building Blocks 79 Gl
- Page 81 and 82:
Chapter 5 JSL Building Blocks 81 Al
- Page 83 and 84:
Chapter 5 JSL Building Blocks 83 It
- Page 85 and 86:
Chapter 5 JSL Building Blocks 85 It
- Page 87 and 88:
Chapter 5 JSL Building Blocks 87 Co
- Page 89 and 90:
Chapter 5 JSL Building Blocks 89 Co
- Page 91 and 92:
Chapter 5 JSL Building Blocks 91 Co
- Page 93 and 94:
Chapter 5 JSL Building Blocks 93 Co
- Page 95 and 96:
Chapter 5 JSL Building Blocks 95 In
- Page 97 and 98:
Chapter 5 JSL Building Blocks 97 Na
- Page 99 and 100:
Chapter 5 JSL Building Blocks 99 Na
- Page 101 and 102:
Chapter 5 JSL Building Blocks 101 N
- Page 103 and 104:
Chapter 6 Types of Data Working wit
- Page 105 and 106:
Chapter 6 Types of Data 105 Numbers
- Page 107 and 108:
Chapter 6 Types of Data 107 Path Va
- Page 109 and 110:
Chapter 6 Types of Data 109 Date-Ti
- Page 111 and 112:
Chapter 6 Types of Data 111 Date-Ti
- Page 113 and 114:
Chapter 6 Types of Data 113 Date-Ti
- Page 115 and 116:
Chapter 6 Types of Data 115 Date-Ti
- Page 117 and 118:
Chapter 6 Types of Data 117 Date-Ti
- Page 119 and 120:
Chapter 6 Types of Data 119 Currenc
- Page 121 and 122:
Chapter 6 Types of Data 121 Hexadec
- Page 123 and 124:
Chapter 6 Types of Data 123 Work wi
- Page 125 and 126:
Chapter 6 Types of Data 125 Use Pat
- Page 127 and 128:
Chapter 6 Types of Data 127 Use Pat
- Page 129 and 130:
Chapter 7 Data Structures Working w
- Page 131 and 132:
Chapter 7 Data Structures 131 Lists
- Page 133 and 134:
Chapter 7 Data Structures 133 Lists
- Page 135 and 136:
Chapter 7 Data Structures 135 Lists
- Page 137 and 138:
Chapter 7 Data Structures 137 Matri
- Page 139 and 140:
Chapter 7 Data Structures 139 Matri
- Page 141 and 142:
Chapter 7 Data Structures 141 Matri
- Page 143 and 144:
Chapter 7 Data Structures 143 Matri
- Page 145 and 146:
Chapter 7 Data Structures 145 Matri
- Page 147 and 148:
Chapter 7 Data Structures 147 Matri
- Page 149 and 150:
Chapter 7 Data Structures 149 Matri
- Page 151 and 152:
Chapter 7 Data Structures 151 Matri
- Page 153 and 154:
Chapter 7 Data Structures 153 Matri
- Page 155 and 156:
Chapter 7 Data Structures 155 Matri
- Page 157 and 158:
Chapter 7 Data Structures 157 Matri
- Page 159 and 160:
Chapter 7 Data Structures 159 Matri
- Page 161 and 162:
Chapter 7 Data Structures 161 Matri
- Page 163 and 164:
Chapter 7 Data Structures 163 Matri
- Page 165 and 166:
Chapter 7 Data Structures 165 Matri
- Page 167 and 168:
Chapter 7 Data Structures 167 Matri
- Page 169 and 170:
Chapter 7 Data Structures 169 Assoc
- Page 171 and 172:
Chapter 7 Data Structures 171 Assoc
- Page 173 and 174:
Chapter 7 Data Structures 173 Assoc
- Page 175 and 176:
Chapter 7 Data Structures 175 Assoc
- Page 177 and 178:
Chapter 7 Data Structures 177 Assoc
- Page 179 and 180:
Chapter 7 Data Structures 179 Assoc
- Page 181 and 182:
Chapter 8 Programming Methods Compl
- Page 183 and 184:
Chapter 8 Programming Methods 183 L
- Page 185 and 186:
Chapter 8 Programming Methods 185 L
- Page 187 and 188:
Chapter 8 Programming Methods 187 L
- Page 189 and 190:
Chapter 8 Programming Methods 189 L
- Page 191 and 192:
Chapter 8 Programming Methods 191 L
- Page 193 and 194:
Chapter 8 Programming Methods 193 L
- Page 195 and 196:
Chapter 8 Programming Methods 195 L
- Page 197 and 198:
Chapter 8 Programming Methods 197 L
- Page 199 and 200:
Chapter 8 Programming Methods 199 A
- Page 201 and 202:
Chapter 8 Programming Methods 201 A
- Page 203 and 204:
Chapter 8 Programming Methods 203 A
- Page 205 and 206:
Chapter 8 Programming Methods 205 A
- Page 207 and 208:
Chapter 8 Programming Methods 207 A
- Page 209 and 210:
Chapter 8 Programming Methods 209 A
- Page 211 and 212:
Chapter 8 Programming Methods 211 A
- Page 213 and 214:
Chapter 8 Programming Methods 213 A
- Page 215 and 216:
Chapter 8 Programming Methods 215 A
- Page 217 and 218:
Chapter 8 Programming Methods 217 A
- Page 219 and 220:
Chapter 8 Programming Methods 219 O
- Page 221 and 222:
Chapter 8 Programming Methods 221 E
- Page 223 and 224:
Chapter 8 Programming Methods 223 E
- Page 225 and 226:
Chapter 8 Programming Methods 225 A
- Page 227 and 228:
Chapter 8 Programming Methods 227 A
- Page 229 and 230:
Chapter 8 Programming Methods 229 S
- Page 231 and 232:
Chapter 8 Programming Methods 231 F
- Page 233 and 234:
Chapter 9 Data Tables Create, Open,
- Page 235 and 236:
Chapter 9 Data Tables 235 Data Tabl
- Page 237 and 238:
Chapter 9 Data Tables 237 Data Tabl
- Page 239 and 240:
Chapter 9 Data Tables 239 Data Tabl
- Page 241 and 242:
Chapter 9 Data Tables 241 Data Tabl
- Page 243 and 244:
Chapter 9 Data Tables 243 Messages
- Page 245 and 246:
Chapter 9 Data Tables 245 Messages
- Page 247 and 248:
Chapter 9 Data Tables 247 Messages
- Page 249 and 250: Chapter 9 Data Tables 249 Messages
- Page 251 and 252: Chapter 9 Data Tables 251 Messages
- Page 253 and 254: Chapter 9 Data Tables 253 Messages
- Page 255 and 256: Chapter 9 Data Tables 255 Messages
- Page 257 and 258: Chapter 9 Data Tables 257 Messages
- Page 259 and 260: Chapter 9 Data Tables 259 Messages
- Page 261 and 262: Chapter 9 Data Tables 261 Messages
- Page 263 and 264: Chapter 9 Data Tables 263 Messages
- Page 265 and 266: Chapter 9 Data Tables 265 Messages
- Page 267 and 268: Chapter 9 Data Tables 267 Messages
- Page 269 and 270: Chapter 9 Data Tables 269 Messages
- Page 271 and 272: Chapter 9 Data Tables 271 Messages
- Page 273 and 274: Chapter 9 Data Tables 273 Messages
- Page 275 and 276: Chapter 9 Data Tables 275 Manipulat
- Page 277 and 278: Chapter 9 Data Tables 277 Manipulat
- Page 279 and 280: Chapter 9 Data Tables 279 Manipulat
- Page 281 and 282: Chapter 9 Data Tables 281 Manipulat
- Page 283 and 284: Chapter 9 Data Tables 283 Manipulat
- Page 285 and 286: Chapter 9 Data Tables 285 Manipulat
- Page 287 and 288: Chapter 9 Data Tables 287 Row State
- Page 289 and 290: Chapter 9 Data Tables 289 Row State
- Page 291 and 292: Chapter 9 Data Tables 291 Row State
- Page 293 and 294: Chapter 9 Data Tables 293 Row State
- Page 295 and 296: Chapter 9 Data Tables 295 Row State
- Page 297 and 298: Chapter 9 Data Tables 297 Row State
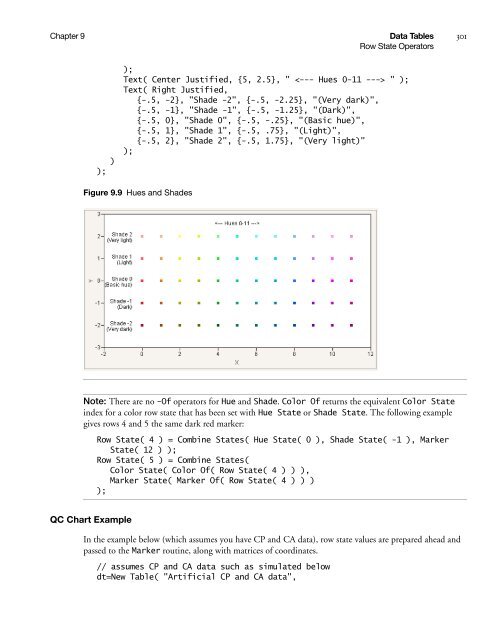
- Page 299: Chapter 9 Data Tables 299 Row State
- Page 303 and 304: Chapter 9 Data Tables 303 Calculati
- Page 305 and 306: Chapter 9 Data Tables 305 Calculati
- Page 307 and 308: Chapter 10 Scripting Platforms Crea
- Page 309 and 310: Chapter 10 Scripting Platforms 309
- Page 311 and 312: Chapter 10 Scripting Platforms 311
- Page 313 and 314: Chapter 10 Scripting Platforms 313
- Page 315 and 316: Chapter 10 Scripting Platforms 315
- Page 317 and 318: Chapter 10 Scripting Platforms 317
- Page 319 and 320: Chapter 10 Scripting Platforms 319
- Page 321 and 322: Chapter 10 Scripting Platforms 321
- Page 323 and 324: Chapter 10 Scripting Platforms 323
- Page 325 and 326: Chapter 10 Scripting Platforms 325
- Page 327 and 328: Chapter 10 Scripting Platforms 327
- Page 329 and 330: Chapter 11 Display Trees Create and
- Page 331 and 332: Chapter 11 Display Trees 331 Manipu
- Page 333 and 334: Chapter 11 Display Trees 333 Manipu
- Page 335 and 336: Chapter 11 Display Trees 335 Manipu
- Page 337 and 338: Chapter 11 Display Trees 337 Manipu
- Page 339 and 340: Chapter 11 Display Trees 339 Manipu
- Page 341 and 342: Chapter 11 Display Trees 341 Manipu
- Page 343 and 344: Chapter 11 Display Trees 343 How to
- Page 345 and 346: Chapter 11 Display Trees 345 Constr
- Page 347 and 348: Chapter 11 Display Trees 347 Constr
- Page 349 and 350: Chapter 11 Display Trees 349 Constr
- Page 351 and 352:
Chapter 11 Display Trees 351 Constr
- Page 353 and 354:
Chapter 11 Display Trees 353 Constr
- Page 355 and 356:
Chapter 11 Display Trees 355 Constr
- Page 357 and 358:
Chapter 11 Display Trees 357 Constr
- Page 359 and 360:
Chapter 11 Display Trees 359 Constr
- Page 361 and 362:
Chapter 11 Display Trees 361 Constr
- Page 363 and 364:
Chapter 11 Display Trees 363 Constr
- Page 365 and 366:
Chapter 11 Display Trees 365 Constr
- Page 367 and 368:
Chapter 11 Display Trees 367 Constr
- Page 369 and 370:
Chapter 11 Display Trees 369 Constr
- Page 371 and 372:
Chapter 11 Display Trees 371 Constr
- Page 373 and 374:
Chapter 11 Display Trees 373 Modal
- Page 375 and 376:
Chapter 11 Display Trees 375 Modal
- Page 377 and 378:
Chapter 11 Display Trees 377 Modal
- Page 379 and 380:
Chapter 11 Display Trees 379 Modal
- Page 381 and 382:
Chapter 11 Display Trees 381 Modal
- Page 383 and 384:
Chapter 11 Display Trees 383 Syntax
- Page 385 and 386:
Chapter 11 Display Trees 385 Syntax
- Page 387 and 388:
Chapter 11 Display Trees 387 Syntax
- Page 389 and 390:
Chapter 11 Display Trees 389 Syntax
- Page 391 and 392:
Chapter 12 Scripting Graphs Create
- Page 393 and 394:
Chapter 12 Scripting Graphs 393 Add
- Page 395 and 396:
Chapter 12 Scripting Graphs 395 Cre
- Page 397 and 398:
Chapter 12 Scripting Graphs 397 Gra
- Page 399 and 400:
Chapter 12 Scripting Graphs 399 Gra
- Page 401 and 402:
Chapter 12 Scripting Graphs 401 Gra
- Page 403 and 404:
Chapter 12 Scripting Graphs 403 Gra
- Page 405 and 406:
Chapter 12 Scripting Graphs 405 Dra
- Page 407 and 408:
Chapter 12 Scripting Graphs 407 Dra
- Page 409 and 410:
Chapter 12 Scripting Graphs 409 Dra
- Page 411 and 412:
Chapter 12 Scripting Graphs 411 Dra
- Page 413 and 414:
Chapter 12 Scripting Graphs 413 Dra
- Page 415 and 416:
Chapter 12 Scripting Graphs 415 Dra
- Page 417 and 418:
Chapter 12 Scripting Graphs 417 Dra
- Page 419 and 420:
Chapter 12 Scripting Graphs 419 Dra
- Page 421 and 422:
Chapter 12 Scripting Graphs 421 Int
- Page 423 and 424:
Chapter 12 Scripting Graphs 423 Int
- Page 425 and 426:
Chapter 12 Scripting Graphs 425 Int
- Page 427 and 428:
Chapter 13 Three-Dimensional Scenes
- Page 429 and 430:
Chapter 13 Three-Dimensional Scenes
- Page 431 and 432:
Chapter 13 Three-Dimensional Scenes
- Page 433 and 434:
Chapter 13 Three-Dimensional Scenes
- Page 435 and 436:
Chapter 13 Three-Dimensional Scenes
- Page 437 and 438:
Chapter 13 Three-Dimensional Scenes
- Page 439 and 440:
Chapter 13 Three-Dimensional Scenes
- Page 441 and 442:
Chapter 13 Three-Dimensional Scenes
- Page 443 and 444:
Chapter 13 Three-Dimensional Scenes
- Page 445 and 446:
Chapter 13 Three-Dimensional Scenes
- Page 447 and 448:
Chapter 13 Three-Dimensional Scenes
- Page 449 and 450:
Chapter 13 Three-Dimensional Scenes
- Page 451 and 452:
Chapter 13 Three-Dimensional Scenes
- Page 453 and 454:
Chapter 13 Three-Dimensional Scenes
- Page 455 and 456:
Chapter 13 Three-Dimensional Scenes
- Page 457 and 458:
Chapter 13 Three-Dimensional Scenes
- Page 459 and 460:
Chapter 13 Three-Dimensional Scenes
- Page 461 and 462:
Chapter 13 Three-Dimensional Scenes
- Page 463 and 464:
Chapter 13 Three-Dimensional Scenes
- Page 465 and 466:
Chapter 13 Three-Dimensional Scenes
- Page 467 and 468:
Chapter 14 Extending JMP External D
- Page 469 and 470:
Chapter 14 Extending JMP 469 Real-T
- Page 471 and 472:
Chapter 14 Extending JMP 471 Real-T
- Page 473 and 474:
Chapter 14 Extending JMP 473 Real-T
- Page 475 and 476:
Chapter 14 Extending JMP 475 Dynami
- Page 477 and 478:
Chapter 14 Extending JMP 477 Using
- Page 479 and 480:
Chapter 14 Extending JMP 479 Databa
- Page 481 and 482:
Chapter 14 Extending JMP 481 Workin
- Page 483 and 484:
Chapter 14 Extending JMP 483 Workin
- Page 485 and 486:
Chapter 14 Extending JMP 485 Workin
- Page 487 and 488:
Chapter 14 Extending JMP 487 Workin
- Page 489 and 490:
Chapter 14 Extending JMP 489 Workin
- Page 491 and 492:
Chapter 14 Extending JMP 491 Workin
- Page 493 and 494:
Chapter 14 Extending JMP 493 Workin
- Page 495 and 496:
Chapter 14 Extending JMP 495 OLE Au
- Page 497 and 498:
Chapter 14 Extending JMP 497 OLE Au
- Page 499 and 500:
Chapter 14 Extending JMP 499 OLE Au
- Page 501 and 502:
Chapter 14 Extending JMP 501 OLE Au
- Page 503 and 504:
Chapter 14 Extending JMP 503 OLE Au
- Page 505 and 506:
Chapter 15 Creating and Sharing App
- Page 507 and 508:
Chapter 15 Creating and Sharing App
- Page 509 and 510:
Chapter 15 Creating and Sharing App
- Page 511 and 512:
Chapter 15 Creating and Sharing App
- Page 513 and 514:
Chapter 15 Creating and Sharing App
- Page 515 and 516:
Chapter 15 Creating and Sharing App
- Page 517 and 518:
Chapter 15 Creating and Sharing App
- Page 519 and 520:
Chapter 15 Creating and Sharing App
- Page 521 and 522:
Chapter 15 Creating and Sharing App
- Page 523 and 524:
Chapter 15 Creating and Sharing App
- Page 525 and 526:
Chapter 15 Creating and Sharing App
- Page 527 and 528:
Chapter 15 Creating and Sharing App
- Page 529 and 530:
Chapter 15 Creating and Sharing App
- Page 531 and 532:
Chapter 16 Common Tasks Getting Sta
- Page 533 and 534:
Chapter 16 Common Tasks 533 Convert
- Page 535 and 536:
Chapter 16 Common Tasks 535 Format
- Page 537 and 538:
Chapter 16 Common Tasks 537 Create
- Page 539 and 540:
Chapter 16 Common Tasks 539 Extract
- Page 541 and 542:
Chapter 16 Common Tasks 541 Create
- Page 543 and 544:
Chapter 16 Common Tasks 543 Create
- Page 545 and 546:
Index JSL Syntax Reference Symbols
- Page 547 and 548:
Index 547 D Data Table 697 Datafeed
- Page 549 and 550:
Index 549 Interest Payment 611 Inte
- Page 551 and 552:
Index 551 Number 683 Number Col Box
- Page 553 and 554:
Index 553 SAS Submit 677 SAS Submit
- Page 555 and 556:
Appendix A JSL Syntax Reference Sum
- Page 557 and 558:
Appendix A JSL Syntax Reference 557
- Page 559 and 560:
Appendix A JSL Syntax Reference 559
- Page 561 and 562:
Appendix A JSL Syntax Reference 561
- Page 563 and 564:
Appendix A JSL Syntax Reference 563
- Page 565 and 566:
Appendix A JSL Syntax Reference 565
- Page 567 and 568:
Appendix A JSL Syntax Reference 567
- Page 569 and 570:
Appendix A JSL Syntax Reference 569
- Page 571 and 572:
Appendix A JSL Syntax Reference 571
- Page 573 and 574:
Appendix A JSL Syntax Reference 573
- Page 575 and 576:
Appendix A JSL Syntax Reference 575
- Page 577 and 578:
Appendix A JSL Syntax Reference 577
- Page 579 and 580:
Appendix A JSL Syntax Reference 579
- Page 581 and 582:
Appendix A JSL Syntax Reference 581
- Page 583 and 584:
Appendix A JSL Syntax Reference 583
- Page 585 and 586:
Appendix A JSL Syntax Reference 585
- Page 587 and 588:
Appendix A JSL Syntax Reference 587
- Page 589 and 590:
Appendix A JSL Syntax Reference 589
- Page 591 and 592:
Appendix A JSL Syntax Reference 591
- Page 593 and 594:
Appendix A JSL Syntax Reference 593
- Page 595 and 596:
Appendix A JSL Syntax Reference 595
- Page 597 and 598:
Appendix A JSL Syntax Reference 597
- Page 599 and 600:
Appendix A JSL Syntax Reference 599
- Page 601 and 602:
Appendix A JSL Syntax Reference 601
- Page 603 and 604:
Appendix A JSL Syntax Reference 603
- Page 605 and 606:
Appendix A JSL Syntax Reference 605
- Page 607 and 608:
Appendix A JSL Syntax Reference 607
- Page 609 and 610:
Appendix A JSL Syntax Reference 609
- Page 611 and 612:
Appendix A JSL Syntax Reference 611
- Page 613 and 614:
Appendix A JSL Syntax Reference 613
- Page 615 and 616:
Appendix A JSL Syntax Reference 615
- Page 617 and 618:
Appendix A JSL Syntax Reference 617
- Page 619 and 620:
Appendix A JSL Syntax Reference 619
- Page 621 and 622:
Appendix A JSL Syntax Reference 621
- Page 623 and 624:
Appendix A JSL Syntax Reference 623
- Page 625 and 626:
Appendix A JSL Syntax Reference 625
- Page 627 and 628:
Appendix A JSL Syntax Reference 627
- Page 629 and 630:
Appendix A JSL Syntax Reference 629
- Page 631 and 632:
Appendix A JSL Syntax Reference 631
- Page 633 and 634:
Appendix A JSL Syntax Reference 633
- Page 635 and 636:
Appendix A JSL Syntax Reference 635
- Page 637 and 638:
Appendix A JSL Syntax Reference 637
- Page 639 and 640:
Appendix A JSL Syntax Reference 639
- Page 641 and 642:
Appendix A JSL Syntax Reference 641
- Page 643 and 644:
Appendix A JSL Syntax Reference 643
- Page 645 and 646:
Appendix A JSL Syntax Reference 645
- Page 647 and 648:
Appendix A JSL Syntax Reference 647
- Page 649 and 650:
Appendix A JSL Syntax Reference 649
- Page 651 and 652:
Appendix A JSL Syntax Reference 651
- Page 653 and 654:
Appendix A JSL Syntax Reference 653
- Page 655 and 656:
Appendix A JSL Syntax Reference 655
- Page 657 and 658:
Appendix A JSL Syntax Reference 657
- Page 659 and 660:
Appendix A JSL Syntax Reference 659
- Page 661 and 662:
Appendix A JSL Syntax Reference 661
- Page 663 and 664:
Appendix A JSL Syntax Reference 663
- Page 665 and 666:
Appendix A JSL Syntax Reference 665
- Page 667 and 668:
Appendix A JSL Syntax Reference 667
- Page 669 and 670:
Appendix A JSL Syntax Reference 669
- Page 671 and 672:
Appendix A JSL Syntax Reference 671
- Page 673 and 674:
Appendix A JSL Syntax Reference 673
- Page 675 and 676:
Appendix A JSL Syntax Reference 675
- Page 677 and 678:
Appendix A JSL Syntax Reference 677
- Page 679 and 680:
Appendix A JSL Syntax Reference 679
- Page 681 and 682:
Appendix A JSL Syntax Reference 681
- Page 683 and 684:
Appendix A JSL Syntax Reference 683
- Page 685 and 686:
Appendix A JSL Syntax Reference 685
- Page 687 and 688:
Appendix A JSL Syntax Reference 687
- Page 689 and 690:
Appendix A JSL Syntax Reference 689
- Page 691 and 692:
Appendix A JSL Syntax Reference 691
- Page 693 and 694:
Appendix A JSL Syntax Reference 693
- Page 695 and 696:
Appendix A JSL Syntax Reference 695
- Page 697 and 698:
Appendix A JSL Syntax Reference 697
- Page 699 and 700:
Appendix A JSL Syntax Reference 699
- Page 701 and 702:
Appendix A JSL Syntax Reference 701
- Page 703 and 704:
Appendix A JSL Syntax Reference 703
- Page 705 and 706:
Appendix A JSL Syntax Reference 705
- Page 707 and 708:
Appendix A JSL Syntax Reference 707
- Page 709 and 710:
Appendix A JSL Syntax Reference 709
- Page 711 and 712:
Appendix A JSL Syntax Reference 711
- Page 713 and 714:
Appendix A JSL Syntax Reference 713
- Page 715 and 716:
Appendix A JSL Syntax Reference 715
- Page 717 and 718:
Appendix A JSL Syntax Reference 717
- Page 719 and 720:
Appendix A JSL Syntax Reference 719
- Page 721 and 722:
Appendix A JSL Syntax Reference 721
- Page 723 and 724:
Appendix A JSL Syntax Reference 723
- Page 725 and 726:
Appendix A JSL Syntax Reference 725
- Page 727 and 728:
Appendix A JSL Syntax Reference 727
- Page 729 and 730:
Appendix A JSL Syntax Reference 729
- Page 731 and 732:
Appendix A JSL Syntax Reference 731
- Page 733 and 734:
Appendix A JSL Syntax Reference 733
- Page 735 and 736:
Appendix A JSL Syntax Reference 735
- Page 737 and 738:
Appendix A JSL Syntax Reference 737
- Page 739 and 740:
Appendix B Messages Summary of Obje
- Page 741 and 742:
Appendix B Messages 741 Associative
- Page 743 and 744:
Appendix B Messages 743 Data Tables
- Page 745 and 746:
Appendix B Messages 745 Data Tables
- Page 747 and 748:
Appendix B Messages 747 Data Tables
- Page 749 and 750:
Appendix B Messages 749 Data Tables
- Page 751 and 752:
Appendix B Messages 751 Data Tables
- Page 753 and 754:
Appendix B Messages 753 Data Tables
- Page 755 and 756:
Appendix B Messages 755 Data Tables
- Page 757 and 758:
Appendix B Messages 757 Data Tables
- Page 759 and 760:
Appendix B Messages 759 Data Tables
- Page 761 and 762:
Appendix B Messages 761 Datafeed Da
- Page 763 and 764:
Appendix B Messages 763 Display Box
- Page 765 and 766:
Appendix B Messages 765 Display Box
- Page 767 and 768:
Appendix B Messages 767 Display Box
- Page 769 and 770:
Appendix B Messages 769 Display Box
- Page 771 and 772:
Appendix B Messages 771 Display Box
- Page 773 and 774:
Appendix B Messages 773 Display Box
- Page 775 and 776:
Appendix B Messages 775 Display Box
- Page 777 and 778:
Appendix B Messages 777 Dynamic Lin
- Page 779 and 780:
Appendix B Messages 779 Platforms o
- Page 781 and 782:
Appendix B Messages 781 R Integrati
- Page 783 and 784:
Appendix B Messages 783 SAS Integra
- Page 785 and 786:
Appendix B Messages 785 SAS Integra
- Page 787 and 788:
Appendix B Messages 787 SAS Integra
- Page 789 and 790:
Appendix B Messages 789 SAS Integra
- Page 791 and 792:
Appendix B Messages 791 SAS Integra
- Page 793 and 794:
Appendix B Messages 793 SAS Integra
- Page 795 and 796:
Appendix B Messages 795 SAS Integra
- Page 797 and 798:
Appendix B Messages 797 SAS Integra
- Page 799 and 800:
Appendix B Messages 799 SAS Integra
- Page 801 and 802:
Appendix B Messages 801 Sockets For
- Page 803 and 804:
Appendix B Messages 803 Sockets skt
- Page 805 and 806:
Appendix B Messages 805 Other Objec
- Page 807 and 808:
Appendix C Compatibility Notes Chan
- Page 809 and 810:
Appendix C Compatibility Notes 809
- Page 811 and 812:
Appendix D Glossary Terms, Concepts
- Page 813 and 814:
Appendix D Glossary 813 ODBC databa
- Page 815 and 816:
Index JMP Scripting Guide Symbols `
- Page 817 and 818:
Index 817 property parameters 284 c
- Page 819 and 820:
Index 819 Disable 465 Disk 448 Disp
- Page 821 and 822:
Index 821 HLine 405 HList 377, 380
- Page 823 and 824:
Index 823 objects 240 platform 310
- Page 825 and 826:
Index 825 Point Size 443 POINTS 440
- Page 827 and 828:
Index 827 Show Properties 243, 276,