Chapter 14 - Bootstrap Methods and Permutation Tests - WH Freeman
Chapter 14 - Bootstrap Methods and Permutation Tests - WH Freeman
Chapter 14 - Bootstrap Methods and Permutation Tests - WH Freeman

You also want an ePaper? Increase the reach of your titles
YUMPU automatically turns print PDFs into web optimized ePapers that Google loves.
<strong>14</strong>-20 CHAPTER <strong>14</strong> <strong>Bootstrap</strong> <strong>Methods</strong> <strong>and</strong> <strong>Permutation</strong> <strong>Tests</strong><br />
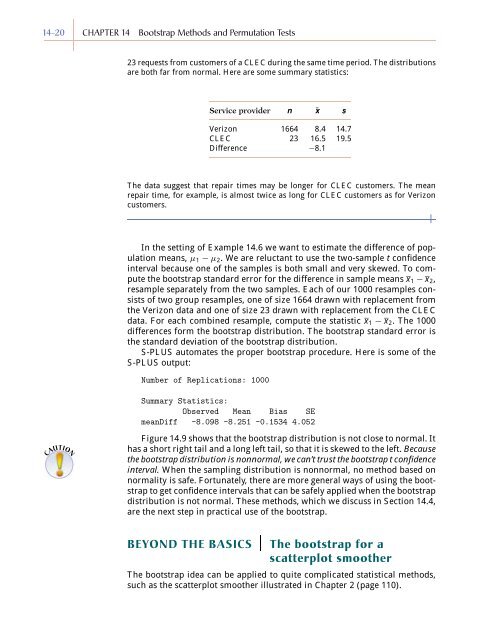
23 requests from customers of a CLEC during the same time period. The distributions<br />
are both far from normal. Here are some summary statistics:<br />
Service provider n ¯x s<br />
Verizon 1664 8.4 <strong>14</strong>.7<br />
CLEC 23 16.5 19.5<br />
Difference −8.1<br />
The data suggest that repair times may be longer for CLEC customers. The mean<br />
repair time, for example, is almost twice as long for CLEC customers as for Verizon<br />
customers.<br />
In the setting of Example <strong>14</strong>.6 we want to estimate the difference of population<br />
means, µ 1 − µ 2 . We are reluctant to use the two-sample t confidence<br />
interval because one of the samples is both small <strong>and</strong> very skewed. To compute<br />
the bootstrap st<strong>and</strong>ard error for the difference in sample means x 1 − x 2 ,<br />
resample separately from the two samples. Each of our 1000 resamples consists<br />
of two group resamples, one of size 1664 drawn with replacement from<br />
the Verizon data <strong>and</strong> one of size 23 drawn with replacement from the CLEC<br />
data. For each combined resample, compute the statistic x 1 − x 2 . The 1000<br />
differences form the bootstrap distribution. The bootstrap st<strong>and</strong>ard error is<br />
the st<strong>and</strong>ard deviation of the bootstrap distribution.<br />
S-PLUS automates the proper bootstrap procedure. Here is some of the<br />
S-PLUS output:<br />
Number of Replications: 1000<br />
Summary Statistics:<br />
Observed Mean Bias SE<br />
meanDiff -8.098 -8.251 -0.1534 4.052<br />
CAUTION<br />
Figure <strong>14</strong>.9 shows that the bootstrap distribution is not close to normal. It<br />
has a short right tail <strong>and</strong> a long left tail, so that it is skewed to the left. Because<br />
the bootstrap distribution is nonnormal, we can’t trust the bootstrap t confidence<br />
interval. When the sampling distribution is nonnormal, no method based on<br />
normality is safe. Fortunately, there are more general ways of using the bootstrap<br />
to get confidence intervals that can be safely applied when the bootstrap<br />
distribution is not normal. These methods, which we discuss in Section <strong>14</strong>.4,<br />
are the next step in practical use of the bootstrap.<br />
BEYOND THE BASICS<br />
The bootstrap for a<br />
scatterplot smoother<br />
The bootstrap idea can be applied to quite complicated statistical methods,<br />
such as the scatterplot smoother illustrated in <strong>Chapter</strong> 2 (page 110).