Chapter 14 - Bootstrap Methods and Permutation Tests - WH Freeman
Chapter 14 - Bootstrap Methods and Permutation Tests - WH Freeman
Chapter 14 - Bootstrap Methods and Permutation Tests - WH Freeman

You also want an ePaper? Increase the reach of your titles
YUMPU automatically turns print PDFs into web optimized ePapers that Google loves.
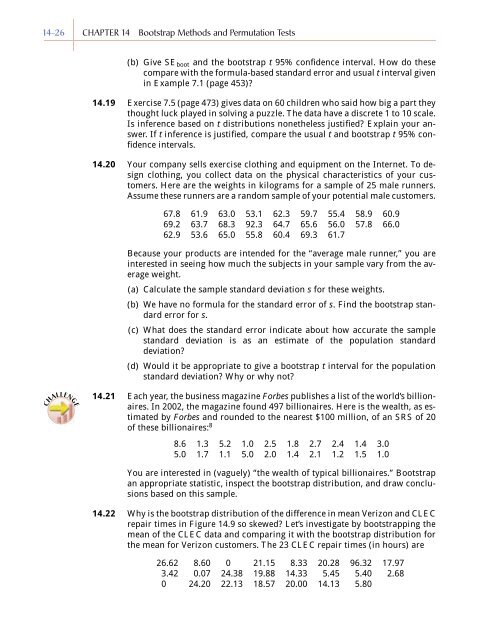
<strong>14</strong>-26 CHAPTER <strong>14</strong> <strong>Bootstrap</strong> <strong>Methods</strong> <strong>and</strong> <strong>Permutation</strong> <strong>Tests</strong><br />
(b) Give SE boot <strong>and</strong> the bootstrap t 95% confidence interval. How do these<br />
compare with the formula-based st<strong>and</strong>ard error <strong>and</strong> usual t interval given<br />
in Example 7.1 (page 453)?<br />
<strong>14</strong>.19 Exercise 7.5 (page 473) gives data on 60 children who said how big a part they<br />
thought luck played in solving a puzzle. The data have a discrete 1 to 10 scale.<br />
Is inference based on t distributions nonetheless justified? Explain your answer.<br />
If t inference is justified, compare the usual t <strong>and</strong> bootstrap t 95% confidence<br />
intervals.<br />
<strong>14</strong>.20 Your company sells exercise clothing <strong>and</strong> equipment on the Internet. To design<br />
clothing, you collect data on the physical characteristics of your customers.<br />
Here are the weights in kilograms for a sample of 25 male runners.<br />
Assume these runners are a r<strong>and</strong>om sample of your potential male customers.<br />
67.8 61.9 63.0 53.1 62.3 59.7 55.4 58.9 60.9<br />
69.2 63.7 68.3 92.3 64.7 65.6 56.0 57.8 66.0<br />
62.9 53.6 65.0 55.8 60.4 69.3 61.7<br />
Because your products are intended for the “average male runner,” you are<br />
interested in seeing how much the subjects in your sample vary from the average<br />
weight.<br />
(a) Calculate the sample st<strong>and</strong>ard deviation s for these weights.<br />
(b) We have no formula for the st<strong>and</strong>ard error of s. Find the bootstrap st<strong>and</strong>ard<br />
error for s.<br />
(c) What does the st<strong>and</strong>ard error indicate about how accurate the sample<br />
st<strong>and</strong>ard deviation is as an estimate of the population st<strong>and</strong>ard<br />
deviation?<br />
(d) Would it be appropriate to give a bootstrap t interval for the population<br />
st<strong>and</strong>ard deviation? Why or why not?<br />
CHALLENGE<br />
<strong>14</strong>.21 Each year, the business magazine Forbes publishes a list of the world’s billionaires.<br />
In 2002, the magazine found 497 billionaires. Here is the wealth, as estimated<br />
by Forbes <strong>and</strong> rounded to the nearest $100 million, of an SRS of 20<br />
of these billionaires: 8<br />
8.6 1.3 5.2 1.0 2.5 1.8 2.7 2.4 1.4 3.0<br />
5.0 1.7 1.1 5.0 2.0 1.4 2.1 1.2 1.5 1.0<br />
You are interested in (vaguely) “the wealth of typical billionaires.” <strong>Bootstrap</strong><br />
an appropriate statistic, inspect the bootstrap distribution, <strong>and</strong> draw conclusions<br />
based on this sample.<br />
<strong>14</strong>.22 Why is the bootstrap distribution of the difference in mean Verizon <strong>and</strong> CLEC<br />
repair times in Figure <strong>14</strong>.9 so skewed? Let’s investigate by bootstrapping the<br />
mean of the CLEC data <strong>and</strong> comparing it with the bootstrap distribution for<br />
the mean for Verizon customers. The 23 CLEC repair times (in hours) are<br />
26.62 8.60 0 21.15 8.33 20.28 96.32 17.97<br />
3.42 0.07 24.38 19.88 <strong>14</strong>.33 5.45 5.40 2.68<br />
0 24.20 22.13 18.57 20.00 <strong>14</strong>.13 5.80