Chapter 14 - Bootstrap Methods and Permutation Tests - WH Freeman
Chapter 14 - Bootstrap Methods and Permutation Tests - WH Freeman
Chapter 14 - Bootstrap Methods and Permutation Tests - WH Freeman

You also want an ePaper? Increase the reach of your titles
YUMPU automatically turns print PDFs into web optimized ePapers that Google loves.
<strong>14</strong>-48 CHAPTER <strong>14</strong> <strong>Bootstrap</strong> <strong>Methods</strong> <strong>and</strong> <strong>Permutation</strong> <strong>Tests</strong><br />
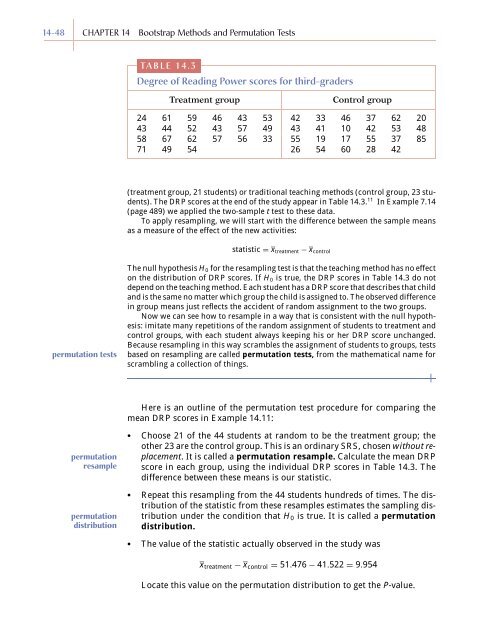
TABLE <strong>14</strong>.3<br />
Degree of Reading Power scores for third-graders<br />
Treatment group<br />
Control group<br />
24 61 59 46 43 53 42 33 46 37 62 20<br />
43 44 52 43 57 49 43 41 10 42 53 48<br />
58 67 62 57 56 33 55 19 17 55 37 85<br />
71 49 54 26 54 60 28 42<br />
(treatment group, 21 students) or traditional teaching methods (control group, 23 students).<br />
The DRP scores at the end of the study appear in Table <strong>14</strong>.3. 11 In Example 7.<strong>14</strong><br />
(page 489) we applied the two-sample t test to these data.<br />
To apply resampling, we will start with the difference between the sample means<br />
as a measure of the effect of the new activities:<br />
statistic = x treatment − x control<br />
permutation tests<br />
The null hypothesis H 0 for the resampling test is that the teaching method has no effect<br />
on the distribution of DRP scores. If H 0 is true, the DRP scores in Table <strong>14</strong>.3 do not<br />
depend on the teaching method. Each student has a DRP score that describes that child<br />
<strong>and</strong> is the same no matter which group the child is assigned to. The observed difference<br />
in group means just reflects the accident of r<strong>and</strong>om assignment to the two groups.<br />
Now we can see how to resample in a way that is consistent with the null hypothesis:<br />
imitate many repetitions of the r<strong>and</strong>om assignment of students to treatment <strong>and</strong><br />
control groups, with each student always keeping his or her DRP score unchanged.<br />
Because resampling in this way scrambles the assignment of students to groups, tests<br />
based on resampling are called permutation tests, from the mathematical name for<br />
scrambling a collection of things.<br />
Here is an outline of the permutation test procedure for comparing the<br />
mean DRP scores in Example <strong>14</strong>.11:<br />
permutation<br />
resample<br />
permutation<br />
distribution<br />
• Choose 21 of the 44 students at r<strong>and</strong>om to be the treatment group; the<br />
other 23 are the control group. This is an ordinary SRS, chosen without replacement.<br />
It is called a permutation resample. Calculate the mean DRP<br />
score in each group, using the individual DRP scores in Table <strong>14</strong>.3. The<br />
difference between these means is our statistic.<br />
• Repeat this resampling from the 44 students hundreds of times. The distribution<br />
of the statistic from these resamples estimates the sampling distribution<br />
under the condition that H 0 is true. It is called a permutation<br />
distribution.<br />
• The value of the statistic actually observed in the study was<br />
x treatment − x control = 51.476 − 41.522 = 9.954<br />
Locate this value on the permutation distribution to get the P-value.