Chapter 14 - Bootstrap Methods and Permutation Tests - WH Freeman
Chapter 14 - Bootstrap Methods and Permutation Tests - WH Freeman
Chapter 14 - Bootstrap Methods and Permutation Tests - WH Freeman

Create successful ePaper yourself
Turn your PDF publications into a flip-book with our unique Google optimized e-Paper software.
<strong>14</strong>-38 CHAPTER <strong>14</strong> <strong>Bootstrap</strong> <strong>Methods</strong> <strong>and</strong> <strong>Permutation</strong> <strong>Tests</strong><br />
Observed<br />
Mean<br />
–0.2 0.0 0.2 0.4<br />
Correlation coefficient<br />
(a)<br />
Correlation coefficient<br />
0.4<br />
0.2<br />
0.0<br />
–0.2<br />
–2 0 2<br />
z-score<br />
(b)<br />
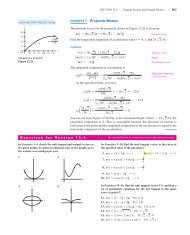
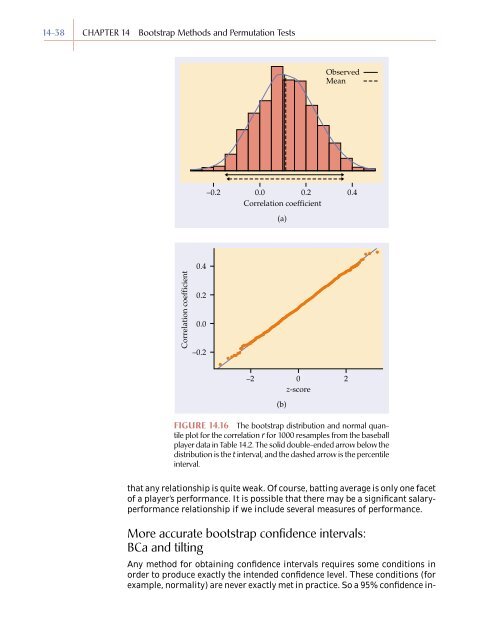
FIGURE <strong>14</strong>.16 The bootstrap distribution <strong>and</strong> normal quantile<br />
plot for the correlation r for 1000 resamples from the baseball<br />
player data in Table <strong>14</strong>.2. The solid double-ended arrow below the<br />
distribution is the t interval, <strong>and</strong> the dashed arrow is the percentile<br />
interval.<br />
that any relationship is quite weak. Of course, batting average is only one facet<br />
of a player’s performance. It is possible that there may be a significant salaryperformance<br />
relationship if we include several measures of performance.<br />
More accurate bootstrap confidence intervals:<br />
BCa <strong>and</strong> tilting<br />
Any method for obtaining confidence intervals requires some conditions in<br />
order to produce exactly the intended confidence level. These conditions (for<br />
example, normality) are never exactly met in practice. So a 95% confidence in-