

HD6060-.A84-2008-PDF-Athena-factor-Reversing-the-brain-drain-in-science,-engineering,-and-technology
HD6060-.A84-2008-PDF-Athena-factor-Reversing-the-brain-drain-in-science,-engineering,-and-technology
HD6060-.A84-2008-PDF-Athena-factor-Reversing-the-brain-drain-in-science,-engineering,-and-technology

You also want an ePaper? Increase the reach of your titles
YUMPU automatically turns print PDFs into web optimized ePapers that Google loves.
The <strong>A<strong>the</strong>na</strong> Factor: <strong>Revers<strong>in</strong>g</strong> <strong>the</strong> Bra<strong>in</strong> Dra<strong>in</strong> <strong>in</strong> Science, Eng<strong>in</strong>eer<strong>in</strong>g, <strong>and</strong> Technology<br />
HBR Research Report<br />
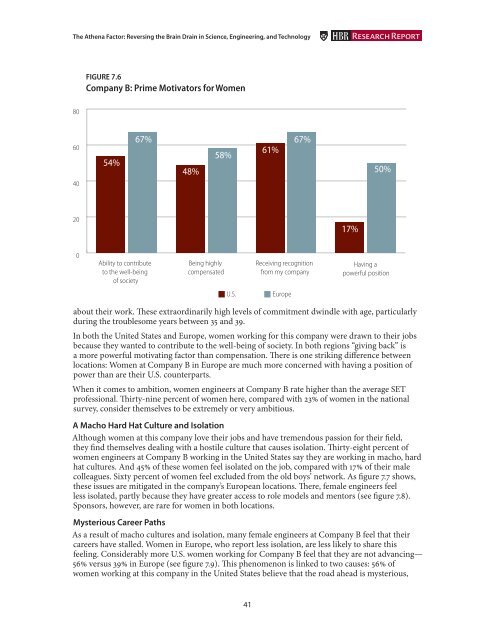
FIGURE 7.6<br />
Company B: Prime Motivators for Women<br />
80<br />
60<br />
40<br />
54%<br />
67%<br />
48%<br />
58%<br />
61%<br />
67%<br />
50%<br />
20<br />
17%<br />
0<br />
Ability to contribute<br />
to <strong>the</strong> well-be<strong>in</strong>g<br />
of society<br />
Be<strong>in</strong>g highly<br />
compensated<br />
Receiv<strong>in</strong>g recognition<br />
from my company<br />
Hav<strong>in</strong>g a<br />
powerful position<br />
U.S.<br />
Europe<br />
about <strong>the</strong>ir work. These extraord<strong>in</strong>arily high levels of commitment dw<strong>in</strong>dle with age, particularly<br />
dur<strong>in</strong>g <strong>the</strong> troublesome years between 35 <strong>and</strong> 39.<br />
In both <strong>the</strong> United States <strong>and</strong> Europe, women work<strong>in</strong>g for this company were drawn to <strong>the</strong>ir jobs<br />
because <strong>the</strong>y wanted to contribute to <strong>the</strong> well-be<strong>in</strong>g of society. In both regions “giv<strong>in</strong>g back” is<br />
a more powerful motivat<strong>in</strong>g <strong>factor</strong> than compensation. There is one strik<strong>in</strong>g difference between<br />
locations: Women at Company B <strong>in</strong> Europe are much more concerned with hav<strong>in</strong>g a position of<br />
power than are <strong>the</strong>ir U.S. counterparts.<br />
When it comes to ambition, women eng<strong>in</strong>eers at Company B rate higher than <strong>the</strong> average SET<br />
professional. Thirty-n<strong>in</strong>e percent of women here, compared with 23% of women <strong>in</strong> <strong>the</strong> national<br />
survey, consider <strong>the</strong>mselves to be extremely or very ambitious.<br />
A Macho Hard Hat Culture <strong>and</strong> Isolation<br />
Although women at this company love <strong>the</strong>ir jobs <strong>and</strong> have tremendous passion for <strong>the</strong>ir field,<br />
<strong>the</strong>y f<strong>in</strong>d <strong>the</strong>mselves deal<strong>in</strong>g with a hostile culture that causes isolation. Thirty-eight percent of<br />
women eng<strong>in</strong>eers at Company B work<strong>in</strong>g <strong>in</strong> <strong>the</strong> United States say <strong>the</strong>y are work<strong>in</strong>g <strong>in</strong> macho, hard<br />
hat cultures. And 45% of <strong>the</strong>se women feel isolated on <strong>the</strong> job, compared with 17% of <strong>the</strong>ir male<br />
colleagues. Sixty percent of women feel excluded from <strong>the</strong> old boys’ network. As figure 7.7 shows,<br />
<strong>the</strong>se issues are mitigated <strong>in</strong> <strong>the</strong> company’s European locations. There, female eng<strong>in</strong>eers feel<br />
less isolated, partly because <strong>the</strong>y have greater access to role models <strong>and</strong> mentors (see figure 7.8).<br />
Sponsors, however, are rare for women <strong>in</strong> both locations.<br />
Mysterious Career Paths<br />
As a result of macho cultures <strong>and</strong> isolation, many female eng<strong>in</strong>eers at Company B feel that <strong>the</strong>ir<br />
careers have stalled. Women <strong>in</strong> Europe, who report less isolation, are less likely to share this<br />
feel<strong>in</strong>g. Considerably more U.S. women work<strong>in</strong>g for Company B feel that <strong>the</strong>y are not advanc<strong>in</strong>g—<br />
56% versus 39% <strong>in</strong> Europe (see figure 7.9). This phenomenon is l<strong>in</strong>ked to two causes: 56% of<br />
women work<strong>in</strong>g at this company <strong>in</strong> <strong>the</strong> United States believe that <strong>the</strong> road ahead is mysterious,<br />
41