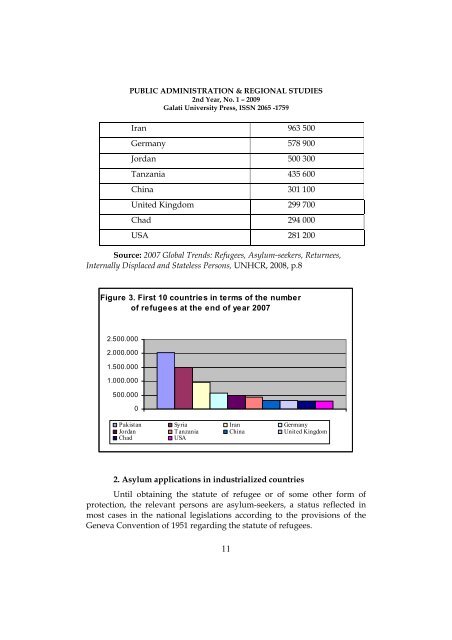
PUBLIC ADMINISTRATION & REGIONAL STUDIES 2nd Year, No. 1 – 2009 Galati University Press, ISSN 2065 -1759 Iran 963 500 Germany 578 900 Jordan 500 300 Tanzania 435 600 China 301 100 United Kingdom 299 700 Chad 294 000 USA 281 200 Source: 2007 Global Trends: Refugees, Asylum-seekers, Returnees, Internally Displaced and Stateless Persons, UNHCR, 2008, p.8 Figure 3. First 10 countries in terms of the number of refugees at the end of year 2007 2.500.000 2.000.000 1.500.000 1.000.000 500.000 0 Pakistan Syria Iran Germany Jordan Tanzania China United Kingdom Chad USA 2. Asylum applications in industrialized countries Until obtaining the statute of refugee or of some other form of protection, the relevant persons are asylum-seekers, a status reflected in most cases in the national legislations according to the provisions of the Geneva Convention of 1951 regarding the statute of refugees. 11
PUBLIC ADMINISTRATION & REGIONAL STUDIES 2nd Year, No. 1 – 2009 Galati University Press, ISSN 2065 -1759 UNHCR statistics concerning asylum applications have contemplated 43 countries, generically called “industrialized countries” 1,2 . Among these, most countries belong to the EU. To the possible extent, asylum-seekers are registered only once in each country. However, the total figures overestimate the number of new arrivals because there are persons who lodge asylum applications in more than one country. For example, the Eurodac system has <strong>de</strong>monstrated that, both in 2005 and in 2006, 17% of the asylum applications were in fact multiple applications. According to the available statistics at UNHCR level, in 2007 the number of asylum applications increased by 10% compared to 2006. In absolute figures, in 2007, 338,300 asylum applications were lodged, i.e. 32,000 more than in 2006. Nevertheless, the level in 2007 is only half of the number reached in 2001, when 655,000 asylum applications were recor<strong>de</strong>d in 51 countries. Table 5 and Figure 4 show the dynamics of the asylum applications in some areas of the world, between 2006-2007 as compared to 2001-2006. Table 5. Dynamics of asylum applications in some areas of the world between 2001 and 2006, and between 2007 and 2013 - percentages – Area 2001-2006 2006- 2007 EU-27 -54.7 10.9 Europe -53.9 12.9 Canada/USA -49.8 3.6 Australia/New Zeeland -72.8 11.1 Source: Asylum Level and Trends in Industrialized Countries, UNHCR, 2008, p.4 1 The 43 inclu<strong>de</strong>: 26 EU members (without Italy), Albania, Bosnia-Herzegovina, Croatia, Island, Liechtenstein, Montenegro, Norway, Serbia, Swiss, FRI Macedonia, Turkey, as well as Australia, Canada, Japan, New Zeeland, Korea and USA. 2 Recently, Armenia, Azerbaijan, Belarus, Georgia, Moldova, the Russian Fe<strong>de</strong>ration and Ukraine have recently joined them, out of statistic reasons. Italy was also inclu<strong>de</strong>d in these statistics starting with 2008. 12