D2 3 Computing e-Infrastructure cost calculations and business _models_vam1-final
D2 3 Computing e-Infrastructure cost calculations and business _models_vam1-final
D2 3 Computing e-Infrastructure cost calculations and business _models_vam1-final

You also want an ePaper? Increase the reach of your titles
YUMPU automatically turns print PDFs into web optimized ePapers that Google loves.
e-‐FISCAL: www.efiscal.eu <br />
EC Contract Number: 283449 <br />
*A respondent commented that for CPU, first level switches are included in the servers’ price. For instance, blade centres <br />
already include switches. <br />
** Four respondents made comments on the “other” option in this question. Their comments could be summarised as follows: <br />
These support terms are included in hardware tender specifications (for 3 years or 3-‐5 years) <strong>and</strong> are difficult to separate (not <br />
typically included in contract as a line item). Apart from that some centres pay extra money for support while others don’t. <br />
*** Due to the wording of the question the analyses that follows has used 50% of the average percentage value of auxiliary <br />
equipment over investment in order to calculate the yearly <strong>cost</strong> per core <strong>and</strong> <strong>cost</strong> per core hour. <br />
Table 21: Cost relations over investment<br />
The software <strong>cost</strong>s are most accurately characterised as an operating expense in today's e-‐<strong>Infrastructure</strong> <br />
ecosystem. The majority of the system software used today is produced in collaborations (in which many of the <br />
service providers participate) <strong>and</strong> released under open source license, which can explain both the relatively low <br />
proportion of the <strong>cost</strong>s <strong>and</strong> large variations between centres. <br />
This contrast with the situation in many of the ICT environments outside the research domain, where the software <br />
licenses for applications such as enterprise resource planning (ERP) systems may form the biggest part of the <br />
capital expenditure, <strong>and</strong> a division of the software <strong>cost</strong>s between CAPEX (license fees) <strong>and</strong> OPEX (service <br />
contracts) is necessary 74 . In Intersect 360 report a significant difference between software expenditure for <br />
academia <strong>and</strong> <strong>business</strong> is witnessed; academia spending significantly less on software licences <strong>and</strong> maintenance <br />
<strong>cost</strong>s. <br />
Personnel information <br />
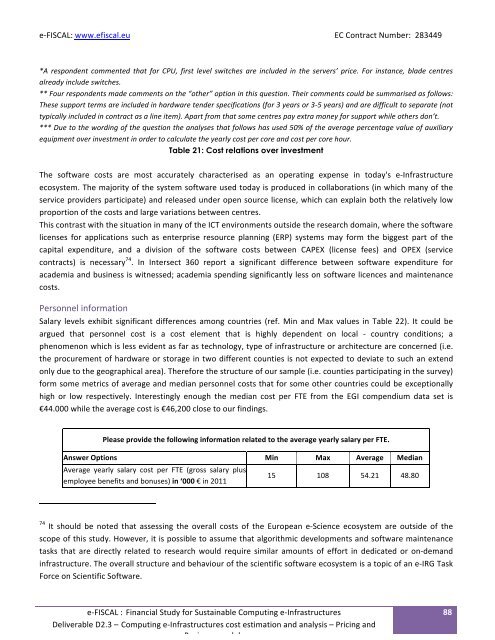
Salary levels exhibit significant differences among countries (ref. Min <strong>and</strong> Max values in Table 22). It could be <br />
argued that personnel <strong>cost</strong> is a <strong>cost</strong> element that is highly dependent on local -‐ country conditions; a <br />
phenomenon which is less evident as far as technology, type of infrastructure or architecture are concerned (i.e. <br />
the procurement of hardware or storage in two different counties is not expected to deviate to such an extend <br />
only due to the geographical area). Therefore the structure of our sample (i.e. counties participating in the survey) <br />
form some metrics of average <strong>and</strong> median personnel <strong>cost</strong>s that for some other countries could be exceptionally <br />
high or low respectively. Interestingly enough the median <strong>cost</strong> per FTE from the EGI compendium data set is <br />
€44.000 while the average <strong>cost</strong> is €46,200 close to our findings. <br />
Please provide the following information related to the average yearly salary per FTE. <br />
Answer Options Min Max Average Median <br />
Average yearly salary <strong>cost</strong> per FTE (gross salary plus <br />
employee benefits <strong>and</strong> bonuses) in ‘000 € in 2011 <br />
15 108 54.21 48.80 <br />
74 It should be noted that assessing the overall <strong>cost</strong>s of the European e-‐Science ecosystem are outside of the <br />
scope of this study. However, it is possible to assume that algorithmic developments <strong>and</strong> software maintenance <br />
tasks that are directly related to research would require similar amounts of effort in dedicated or on-‐dem<strong>and</strong> <br />
infrastructure. The overall structure <strong>and</strong> behaviour of the scientific software ecosystem is a topic of an e-‐IRG Task <br />
Force on Scientific Software. <br />
e-‐FISCAL : Financial Study for Sustainable <strong>Computing</strong> e-‐<strong>Infrastructure</strong>s <br />
Deliverable <strong>D2</strong>.3 – <strong>Computing</strong> e-‐<strong>Infrastructure</strong>s <strong>cost</strong> estimation <strong>and</strong> analysis – Pricing <strong>and</strong> <br />
Business <strong>models</strong> <br />
88