D2 3 Computing e-Infrastructure cost calculations and business _models_vam1-final
D2 3 Computing e-Infrastructure cost calculations and business _models_vam1-final
D2 3 Computing e-Infrastructure cost calculations and business _models_vam1-final

You also want an ePaper? Increase the reach of your titles
YUMPU automatically turns print PDFs into web optimized ePapers that Google loves.
e-‐FISCAL: www.efiscal.eu <br />
EC Contract Number: 283449 <br />
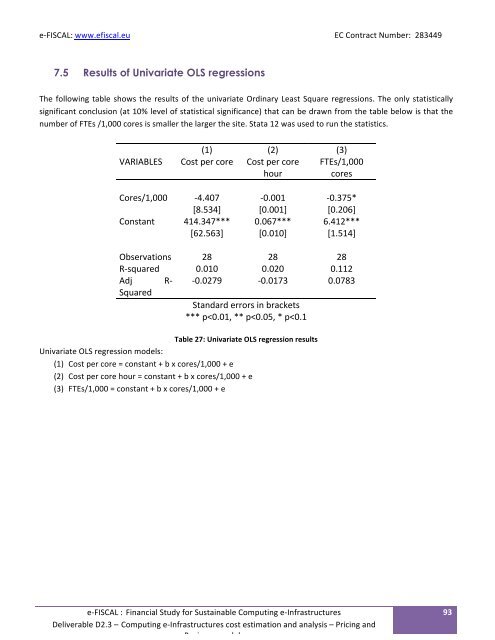
7.5 Results of Univariate OLS regressions<br />
The following table shows the results of the univariate Ordinary Least Square regressions. The only statistically <br />
significant conclusion (at 10% level of statistical significance) that can be drawn from the table below is that the <br />
number of FTEs /1,000 cores is smaller the larger the site. Stata 12 was used to run the statistics. <br />
(1) (2) (3) <br />
VARIABLES Cost per core Cost per core <br />
hour <br />
FTEs/1,000 <br />
cores <br />
Cores/1,000 -‐4.407 -‐0.001 -‐0.375* <br />
[8.534] [0.001] [0.206] <br />
Constant 414.347*** 0.067*** 6.412*** <br />
[62.563] [0.010] [1.514] <br />
Observations 28 28 28 <br />
R-‐squared 0.010 0.020 0.112 <br />
Adj R-‐ -‐0.0279 -‐0.0173 0.0783 <br />
Squared <br />
St<strong>and</strong>ard errors in brackets <br />
*** p