ON THE NEED FOR VOLUMETRIC RADAR DATA WHEN ISSUING ...
ON THE NEED FOR VOLUMETRIC RADAR DATA WHEN ISSUING ...
ON THE NEED FOR VOLUMETRIC RADAR DATA WHEN ISSUING ...

You also want an ePaper? Increase the reach of your titles
YUMPU automatically turns print PDFs into web optimized ePapers that Google loves.
L<br />
4 National Weather Digest<br />
-2<br />
-15------<br />
-10<br />
576'<br />
----------<br />
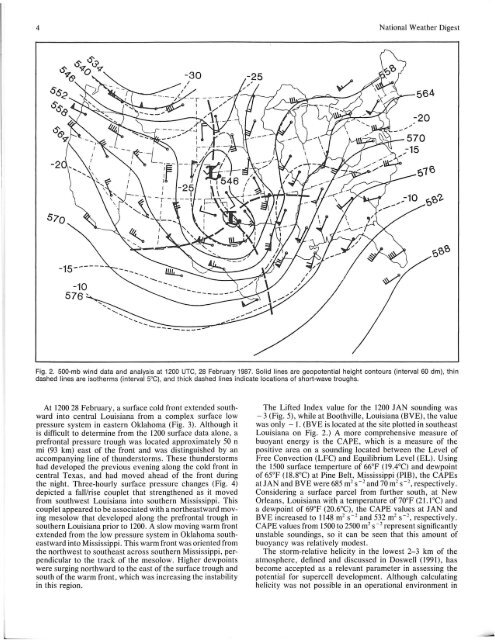
Fig. 2. 500-mb wind data and analysis at 1200 UTC, 28 February 1987. Solid lines are geopotential height contours (interval 60 dm), thin<br />
dashed lines are isotherms (interval 5°C), and thick dashed lines indicate locations of short-wave troughs.<br />
At 120028 February, a surface cold front extended southward<br />
into central Louisiana from a complex surface low<br />
pressure system in eastern Oklahoma (Fig. 3). Although it<br />
is difficult to determine from the 1200 sUlface data alone, a<br />
prefrontal pressure trough was located approximately 50 n<br />
mi (93 km) east of the front and was distinguished by an<br />
accompanying line of thunderstorms. These thunderstorms<br />
had developed the previous evening along the cold front in<br />
central Texas, and had moved ahead of the front during<br />
the night. Three-hourly surface pressure changes (Fig. 4)<br />
depicted a fall/rise couplet that strengthened as it moved<br />
from southwest Louisiana into southern Mississippi. This<br />
couplet appeared to be associated with a northeastward moving<br />
mesolow that developed along the prefrontal trough in<br />
southern Louisiana prior to 1200. A slow moving warm front<br />
extended from the low pressure system in Oklahoma southeastward<br />
into Mississippi. This warm front was oriented from<br />
the northwest to southeast across southern Mississippi, perpendicular<br />
to the track of the meso low . Higher dewpoints<br />
were surging northward to the east of the surface trough and<br />
south of the warm front , which was increasing the instability<br />
in this region.<br />
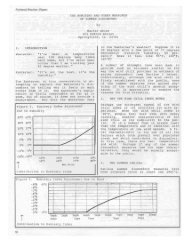
The Lifted Index value for the 1200 JAN sounding was<br />
- 3 (Fig. 5), while at Boothville, Louisiana (BVE), the value<br />
was only - I. (BVE is located at the site plotted in southeast<br />
Louisiana on Fig. 2.) A more comprehensive measure of<br />
buoyant energy is the CAPE, which is a measure of the<br />
positive area on a sounding located between the Level of<br />
Free Convection (LFC) and Equilibrium Level (EL). Using<br />
the 1500 surface temperture of 66°F (l9.4°C) and dewpoint<br />
of 65°F (18.8°C) at Pine Belt, Mississippi (PIB), the CAPEs<br />
at JAN and BVE were 685 m~ s -2 and 70 m~ s -2, respectively.<br />
Considering a sUlface parcel from further south, at New<br />
Orleans, Louisiana with a temperature of 70°F (21.I O C) and<br />
a dewpoint of 69°F (20.6°C), the CAPE values at JAN and<br />
BVE increased to 1148 m 2 s - ~ and 532 m 2 s-~, respectively.<br />
CAPE values from 1500 to 2500 m 2 s - ~ represent significantly<br />
unstable soundings, so it can be seen that this amount of<br />
buoyancy was relatively modest.<br />
The storm-relative helicity in the lowest 2-3 km of the<br />
atmosphere, defined and discussed in Doswell (1991), has<br />
become accepted as a relevant parameter in assessing the<br />
potential for supercell development. Although calculating<br />
helicity was not possible in an operational environment in