Requirements on Consumer Information about Product ... - ANEC
Requirements on Consumer Information about Product ... - ANEC
Requirements on Consumer Information about Product ... - ANEC

You also want an ePaper? Increase the reach of your titles
YUMPU automatically turns print PDFs into web optimized ePapers that Google loves.
C<strong>on</strong>sumer Informati<strong>on</strong> <strong>about</strong> PCF<br />
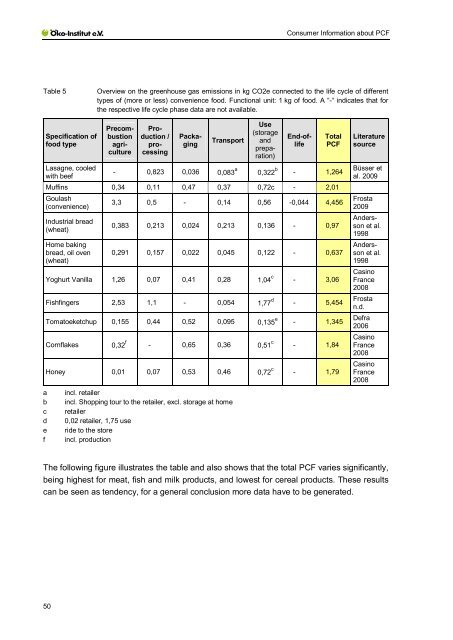
Table 5<br />
Overview <strong>on</strong> the greenhouse gas emissi<strong>on</strong>s in kg CO2e c<strong>on</strong>nected to the life cycle of different<br />
types of (more or less) c<strong>on</strong>venience food. Functi<strong>on</strong>al unit: 1 kg of food. A “-“ indicates that for<br />
the respective life cycle phase data are not available.<br />
Specificati<strong>on</strong> of<br />
food type<br />
Lasagne, cooled<br />
with beef<br />
Precombusti<strong>on</strong><br />
agriculture<br />
<strong>Product</strong>i<strong>on</strong><br />
/<br />
processing<br />
Packaging<br />
Transport<br />
Total<br />
PCF<br />
- 0,823 0,036 0,083 a 0,322 b - 1,264<br />
Muffins 0,34 0,11 0,47 0,37 0,72c - 2,01<br />
Goulash<br />
(c<strong>on</strong>venience)<br />
Industrial bread<br />
(wheat)<br />
Home baking<br />
bread, oil oven<br />
(wheat)<br />
a<br />
b<br />
c<br />
d<br />
e<br />
f<br />
3,3 0,5 - 0,14 0,56 -0,044 4,456<br />
0,383 0,213 0,024 0,213 0,136 - 0,97<br />
0,291 0,157 0,022 0,045 0,122 - 0,637<br />
Yoghurt Vanilla 1,26 0,07 0,41 0,28 1,04 c - 3,06<br />
Fishfingers 2,53 1,1 - 0,054 1,77 d - 5,454<br />
Tomatoeketchup 0,155 0,44 0,52 0,095 0,135 e - 1,345<br />
Cornflakes 0,32 f - 0,65 0,36 0,51 c - 1,84<br />
H<strong>on</strong>ey 0,01 0,07 0,53 0,46 0,72 c - 1,79<br />
incl. retailer<br />
incl. Shopping tour to the retailer, excl. storage at home<br />
retailer<br />
0,02 retailer, 1,75 use<br />
ride to the store<br />
incl. producti<strong>on</strong><br />
Literature<br />
source<br />
Büsser et<br />
al. 2009<br />
Frosta<br />
2009<br />
Use<br />
(storage<br />
and<br />
preparati<strong>on</strong>)<br />
End-oflife<br />
Anderss<strong>on</strong><br />
et al.<br />
1998<br />
Anderss<strong>on</strong><br />
et al.<br />
1998<br />
Casino<br />
France<br />
2008<br />
Frosta<br />
n.d.<br />
Defra<br />
2006<br />
Casino<br />
France<br />
2008<br />
Casino<br />
France<br />
2008<br />
The following figure illustrates the table and also shows that the total PCF varies significantly,<br />
being highest for meat, fish and milk products, and lowest for cereal products. These results<br />
can be seen as tendency, for a general c<strong>on</strong>clusi<strong>on</strong> more data have to be generated.<br />
50