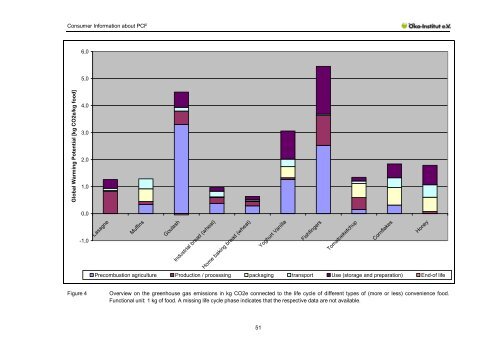
C<strong>on</strong>sumer Informati<strong>on</strong> <strong>about</strong> PCF Table 5 Overview <strong>on</strong> the greenhouse gas emissi<strong>on</strong>s in kg CO2e c<strong>on</strong>nected to the life cycle of different types of (more or less) c<strong>on</strong>venience food. Functi<strong>on</strong>al unit: 1 kg of food. A “-“ indicates that for the respective life cycle phase data are not available. Specificati<strong>on</strong> of food type Lasagne, cooled with beef Precombusti<strong>on</strong> agriculture <strong>Product</strong>i<strong>on</strong> / processing Packaging Transport Total PCF - 0,823 0,036 0,083 a 0,322 b - 1,264 Muffins 0,34 0,11 0,47 0,37 0,72c - 2,01 Goulash (c<strong>on</strong>venience) Industrial bread (wheat) Home baking bread, oil oven (wheat) a b c d e f 3,3 0,5 - 0,14 0,56 -0,044 4,456 0,383 0,213 0,024 0,213 0,136 - 0,97 0,291 0,157 0,022 0,045 0,122 - 0,637 Yoghurt Vanilla 1,26 0,07 0,41 0,28 1,04 c - 3,06 Fishfingers 2,53 1,1 - 0,054 1,77 d - 5,454 Tomatoeketchup 0,155 0,44 0,52 0,095 0,135 e - 1,345 Cornflakes 0,32 f - 0,65 0,36 0,51 c - 1,84 H<strong>on</strong>ey 0,01 0,07 0,53 0,46 0,72 c - 1,79 incl. retailer incl. Shopping tour to the retailer, excl. storage at home retailer 0,02 retailer, 1,75 use ride to the store incl. producti<strong>on</strong> Literature source Büsser et al. 2009 Frosta 2009 Use (storage and preparati<strong>on</strong>) End-oflife Anderss<strong>on</strong> et al. 1998 Anderss<strong>on</strong> et al. 1998 Casino France 2008 Frosta n.d. Defra 2006 Casino France 2008 Casino France 2008 The following figure illustrates the table and also shows that the total PCF varies significantly, being highest for meat, fish and milk products, and lowest for cereal products. These results can be seen as tendency, for a general c<strong>on</strong>clusi<strong>on</strong> more data have to be generated. 50
C<strong>on</strong>sumer Informati<strong>on</strong> <strong>about</strong> PCF 6,0 5,0 Global Warming Potential [kg CO2e/kg food] 4,0 3,0 2,0 1,0 0,0 -1,0 Lasagne Muffins Goulash Industrial bread (wheat) Home baking bread (wheat) Yoghurt Vanilla Fishfingers Tomatoeketchup Cornflakes Precombusti<strong>on</strong> agriculture <strong>Product</strong>i<strong>on</strong> / processing packaging transport Use (storage and preparati<strong>on</strong>) End-of life H<strong>on</strong>ey Figure 4 Overview <strong>on</strong> the greenhouse gas emissi<strong>on</strong>s in kg CO2e c<strong>on</strong>nected to the life cycle of different types of (more or less) c<strong>on</strong>venience food. Functi<strong>on</strong>al unit: 1 kg of food. A missing life cycle phase indicates that the respective data are not available. 51