Anza Borrego Desert State Park - California State Parks - State of ...
Anza Borrego Desert State Park - California State Parks - State of ...
Anza Borrego Desert State Park - California State Parks - State of ...

Create successful ePaper yourself
Turn your PDF publications into a flip-book with our unique Google optimized e-Paper software.
Final Report – October 2001<br />
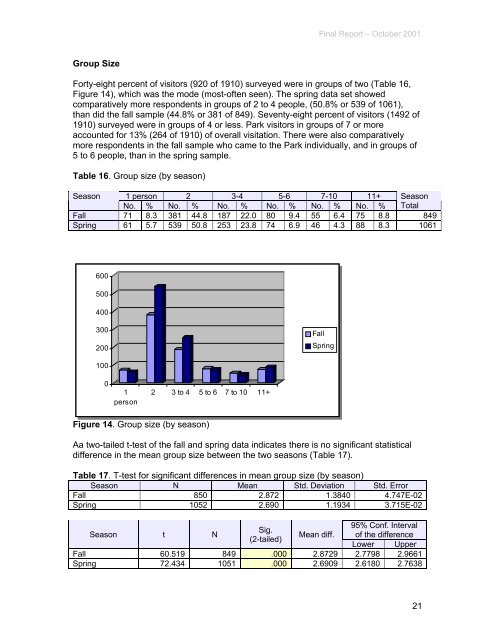
Group Size<br />
Forty-eight percent <strong>of</strong> visitors (920 <strong>of</strong> 1910) surveyed were in groups <strong>of</strong> two (Table 16,<br />
Figure 14), which was the mode (most-<strong>of</strong>ten seen). The spring data set showed<br />
comparatively more respondents in groups <strong>of</strong> 2 to 4 people, (50.8% or 539 <strong>of</strong> 1061),<br />
than did the fall sample (44.8% or 381 <strong>of</strong> 849). Seventy-eight percent <strong>of</strong> visitors (1492 <strong>of</strong><br />
1910) surveyed were in groups <strong>of</strong> 4 or less. <strong>Park</strong> visitors in groups <strong>of</strong> 7 or more<br />
accounted for 13% (264 <strong>of</strong> 1910) <strong>of</strong> overall visitation. There were also comparatively<br />
more respondents in the fall sample who came to the <strong>Park</strong> individually, and in groups <strong>of</strong><br />
5 to 6 people, than in the spring sample.<br />
Table 16. Group size (by season)<br />
Season 1 person 2 3-4 5-6 7-10 11+ Season<br />
No. % No. % No. % No. % No. % No. % Total<br />
Fall 71 8.3 381 44.8 187 22.0 80 9.4 55 6.4 75 8.8 849<br />
Spring 61 5.7 539 50.8 253 23.8 74 6.9 46 4.3 88 8.3 1061<br />
600 600<br />
500 500<br />
400 400<br />
300 300<br />
200 200<br />
Fall Fall<br />
Spring Spring<br />
100 100<br />
0<br />
1<br />
person person<br />
2 3 to to 4 5 to to 6 7 to to 10 10 11+ 11+<br />
Figure 14. Group size (by season)<br />
Aa two-tailed t-test <strong>of</strong> the fall and spring data indicates there is no significant statistical<br />
difference in the mean group size between the two seasons (Table 17).<br />
Table 17. T-test for significant differences in mean group size (by season)<br />
Season N Mean Std. Deviation Std. Error<br />
Fall 850 2.872 1.3840 4.747E-02<br />
Spring 1052 2.690 1.1934 3.715E-02<br />
Season t N<br />
95% Conf. Interval<br />
Sig.<br />
Mean diff. <strong>of</strong> the difference<br />
(2-tailed)<br />
Lower Upper<br />
Fall 60.519 849 .000 2.8729 2.7798 2.9661<br />
Spring 72.434 1051 .000 2.6909 2.6180 2.7638<br />
21