Anza Borrego Desert State Park - California State Parks - State of ...
Anza Borrego Desert State Park - California State Parks - State of ...
Anza Borrego Desert State Park - California State Parks - State of ...

You also want an ePaper? Increase the reach of your titles
YUMPU automatically turns print PDFs into web optimized ePapers that Google loves.
Value<br />
Final Report – October 2001<br />
1.00 2.00<br />
4.00<br />
<br />
<br />
<br />
<br />
<br />
<br />
<br />
<br />
<br />
<br />
2.00<br />
<br />
<br />
<br />
<br />
<br />
0.00<br />
<br />
<br />
<br />
<br />
<br />
<br />
<br />
<br />
<br />
<br />
Acceptable<br />
------------------<br />
Unacceptable<br />
-2.00<br />
<br />
<br />
<br />
<br />
<br />
<br />
<br />
<br />
<br />
-4.00<br />
<br />
<br />
<br />
<br />
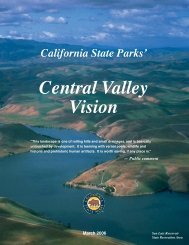
photo1 photo2 photo3 photo4 photo5 photo6<br />
Category<br />
Fall<br />
photo1 photo2 photo3 photo4 photo5 photo6<br />
Category<br />
Spring<br />
Figure 35. Box plot <strong>of</strong> acceptability <strong>of</strong> photo series – Blair Valley<br />
The acceptability measures discussed previously are reinforced by the mean and<br />
median scores given each photo. Table 44 illustrates where the median score (most<strong>of</strong>ten<br />
assigned) is within the acceptable range (green) and where it falls below the range<br />
<strong>of</strong> acceptability (red). Table 45 demonstrates the break-point where the majority <strong>of</strong><br />
people responding found conditions unacceptable.<br />
Table 44. Summary statistics <strong>of</strong> photo series by season and total – Blair Valley<br />
Blair Valley (fall) Photo 1 Photo 2 Photo 3 Photo 4 Photo 5 Photo 6<br />
N<br />
Valid 90 89 88 88 89 89<br />
Missing 264 265 266 266 265 265<br />
Mean 3.27 2.62 .42 -1.67 -2.45 -3.28<br />
Median 4.00 3.00 1.00 -2.00 -3.00 -4.00<br />
Std Dev 1.78 1.74 2.41 2.22 2.09 1.83<br />
Blair Valley (spring) Photo 1 Photo 2 Photo 3 Photo 4 Photo 5 Photo 6<br />
N<br />
Valid 118 119 116 117 117 118<br />
Missing 236 235 238 237 237 236<br />
Mean 3.06 2.46 .91 -1.38 -2.03 -3.02<br />
Median 4.00 3.00 2.00 -1.00 -3.00 -4.00<br />
Std Dev 2.09 1.89 2.53 2.47 2.11 1.85<br />
Blair Valley (total) Photo 1 Photo 2 Photo 3 Photo 4 Photo 5 Photo 6<br />
N<br />
Valid 137 135 137 137 136 138<br />
Missing 217 219 217 217 218 216<br />
Mean 3.31 3.21 2.95 -1.12 -1.10 -3.48<br />
Median 4.00 3.00 2.00 -1.00 -3.00 -4.00<br />
Std Dev 2.57 1.80 1.86 1.73 2.50 3.10<br />
52