Anza Borrego Desert State Park - California State Parks - State of ...
Anza Borrego Desert State Park - California State Parks - State of ...
Anza Borrego Desert State Park - California State Parks - State of ...

Create successful ePaper yourself
Turn your PDF publications into a flip-book with our unique Google optimized e-Paper software.
Final Report – October 2001<br />
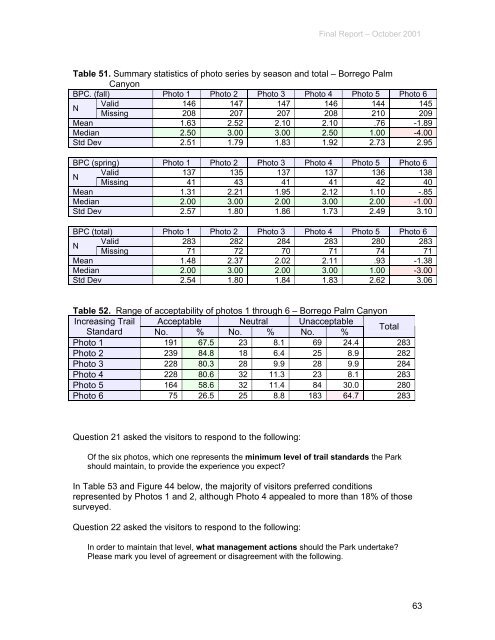
Table 51. Summary statistics <strong>of</strong> photo series by season and total – <strong>Borrego</strong> Palm<br />
Canyon<br />
BPC. (fall) Photo 1 Photo 2 Photo 3 Photo 4 Photo 5 Photo 6<br />
N<br />
Valid 146 147 147 146 144 145<br />
Missing 208 207 207 208 210 209<br />
Mean 1.63 2.52 2.10 2.10 .76 -1.89<br />
Median 2.50 3.00 3.00 2.50 1.00 -4.00<br />
Std Dev 2.51 1.79 1.83 1.92 2.73 2.95<br />
BPC (spring) Photo 1 Photo 2 Photo 3 Photo 4 Photo 5 Photo 6<br />
N<br />
Valid 137 135 137 137 136 138<br />
Missing 41 43 41 41 42 40<br />
Mean 1.31 2.21 1.95 2.12 1.10 -.85<br />
Median 2.00 3.00 2.00 3.00 2.00 -1.00<br />
Std Dev 2.57 1.80 1.86 1.73 2.49 3.10<br />
BPC (total) Photo 1 Photo 2 Photo 3 Photo 4 Photo 5 Photo 6<br />
N<br />
Valid 283 282 284 283 280 283<br />
Missing 71 72 70 71 74 71<br />
Mean 1.48 2.37 2.02 2.11 .93 -1.38<br />
Median 2.00 3.00 2.00 3.00 1.00 -3.00<br />
Std Dev 2.54 1.80 1.84 1.83 2.62 3.06<br />
Table 52. Range <strong>of</strong> acceptability <strong>of</strong> photos 1 through 6 – <strong>Borrego</strong> Palm Canyon<br />
Increasing Trail Acceptable Neutral Unacceptable<br />
Standard No. % No. % No. %<br />
Total<br />
Photo 1 191 67.5 23 8.1 69 24.4 283<br />
Photo 2 239 84.8 18 6.4 25 8.9 282<br />
Photo 3 228 80.3 28 9.9 28 9.9 284<br />
Photo 4 228 80.6 32 11.3 23 8.1 283<br />
Photo 5 164 58.6 32 11.4 84 30.0 280<br />
Photo 6 75 26.5 25 8.8 183 64.7 283<br />
Question 21 asked the visitors to respond to the following:<br />
Of the six photos, which one represents the minimum level <strong>of</strong> trail standards the <strong>Park</strong><br />
should maintain, to provide the experience you expect?<br />
In Table 53 and Figure 44 below, the majority <strong>of</strong> visitors preferred conditions<br />
represented by Photos 1 and 2, although Photo 4 appealed to more than 18% <strong>of</strong> those<br />
surveyed.<br />
Question 22 asked the visitors to respond to the following:<br />
In order to maintain that level, what management actions should the <strong>Park</strong> undertake?<br />
Please mark you level <strong>of</strong> agreement or disagreement with the following.<br />
63