Anza Borrego Desert State Park - California State Parks - State of ...
Anza Borrego Desert State Park - California State Parks - State of ...
Anza Borrego Desert State Park - California State Parks - State of ...

You also want an ePaper? Increase the reach of your titles
YUMPU automatically turns print PDFs into web optimized ePapers that Google loves.
Final Report – October 2001<br />
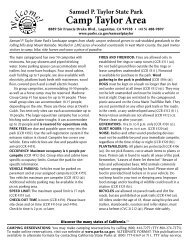
Percent<br />
40 40<br />
35 35<br />
30 30<br />
25 25<br />
20 20<br />
15 15<br />
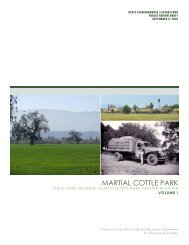
34.42<br />
30.84<br />
10 10<br />
5<br />
0<br />
11.36<br />
9.42<br />
8.44<br />
5.52<br />
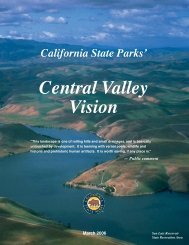
Photo1 Photo 2 Photo 13 Photo 4 Photo 5 Photo 6<br />
Figure 45. Highest level <strong>of</strong> trail standard tolerated – <strong>Borrego</strong> Palm Canyon<br />
Acceptability <strong>of</strong> Trail Standards at Mountain Palm Springs<br />
The issue identified by ABDSP staff for Mountain Palm Springs also included questions<br />
<strong>of</strong> trail standards and maintenance, as at <strong>Borrego</strong> Palm Canyon. To assess these<br />
preferences, a photo series identical to that used at <strong>Borrego</strong> Palm Canyon (Panel 5) was<br />
used portraying a range <strong>of</strong> trail conditions (Photos 1 through 6),<br />
The question presented to visitors taking the survey was:<br />
<strong>Anza</strong>-<strong>Borrego</strong> <strong>Desert</strong> <strong>State</strong> <strong>Park</strong> provides a variety <strong>of</strong> trails. The computer-generated<br />
photographs simulate a range <strong>of</strong> trail conditions that the <strong>Park</strong> can provide. The managers<br />
are interested in your opinion on how trail standards may affect your experience. To<br />
help us assess this, please indicate the acceptability <strong>of</strong> the conditions represented by<br />
each photo. The photo indicates what the trail would be like all the way to <strong>Borrego</strong><br />
Palm Springs. A rating <strong>of</strong> –4 signifies conditions are very unacceptable; a rating <strong>of</strong> +4 is<br />
very acceptable.<br />
The responses to this question and set <strong>of</strong> photos was very mixed (Tables 54 and 55).<br />
The acceptability rating <strong>of</strong> Photo 1 (71.7%) was lower than that <strong>of</strong> Photo 2 (85.9%) in a<br />
similar way as occurred in the <strong>Borrego</strong> Palm Canyon results. In Photos 3 (77.1%) and 4<br />
(73.2%), acceptability was still higher than that <strong>of</strong> Photo 1, but not to the degree <strong>of</strong> the<br />
<strong>Borrego</strong> Palm Canyon results. This may indicate that the Mountain Palm Springs survey<br />
participants were less accepting <strong>of</strong> the additional trail engineering and evidence <strong>of</strong><br />
impacts portrayed in Photos 3 and 4, compared to the <strong>Borrego</strong> Palm Canyon sample. At<br />
Photo 5 however, acceptability drops below 50%, although the mean is still barely above<br />
the zero-line (Figures 46 and 47, Tables 54 and 55). By the time trail conditions depicted<br />
in Photo 6 are reached, a large majority <strong>of</strong> visitors (75.2%) find the trail unacceptable.<br />
Like the results <strong>of</strong> the <strong>Borrego</strong> Palm Canyon group, the shape <strong>of</strong> the acceptability curve<br />
for the Mountain Palm Springs sample is parabolic. Similarly, it indicates the preferred<br />
trail conditions for most visitors lie somewhere in the range <strong>of</strong> conditions portrayed in<br />
65