REGINE Regularisations in Europe Final Report - European ...
REGINE Regularisations in Europe Final Report - European ...
REGINE Regularisations in Europe Final Report - European ...

Create successful ePaper yourself
Turn your PDF publications into a flip-book with our unique Google optimized e-Paper software.
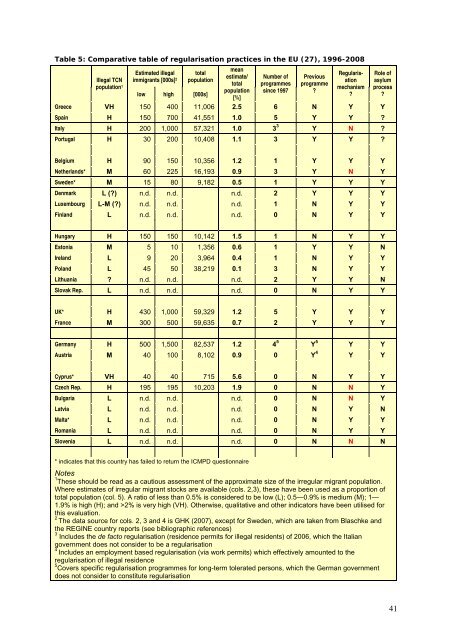
Table 5: Comparative table of regularisation practices <strong>in</strong> the EU (27), 1996-2008<br />
Illegal TCN<br />
population 1<br />
Estimated illegal<br />
immigrants [000s] 2<br />
total<br />
population<br />
low high [000s]<br />
mean<br />
estimate/<br />
total<br />
population<br />
[%]<br />
Number of<br />
programmes<br />
s<strong>in</strong>ce 1997<br />
Previous<br />
programme<br />
?<br />
Regularisation<br />
mechanism<br />
?<br />
Greece VH 150 400 11,006 2.5 6 N Y Y<br />
Spa<strong>in</strong> H 150 700 41,551 1.0 5 Y Y ?<br />
Italy H 200 1,000 57,321 1.0 3 3 Y N ?<br />
Portugal H 30 200 10,408 1.1 3 Y Y ?<br />
Role of<br />
asylum<br />
process<br />
?<br />
Belgium H 90 150 10,356 1.2 1 Y Y Y<br />
Netherlands* M 60 225 16,193 0.9 3 Y N Y<br />
Sweden* M 15 80 9,182 0.5 1 Y Y Y<br />
Denmark L (?) n.d. n.d. n.d. 2 Y Y Y<br />
Luxembourg L-M (?) n.d. n.d. n.d. 1 N Y Y<br />
F<strong>in</strong>land L n.d. n.d. n.d. 0 N Y Y<br />
Hungary H 150 150 10,142 1.5 1 N Y Y<br />
Estonia M 5 10 1,356 0.6 1 Y Y N<br />
Ireland L 9 20 3,964 0.4 1 N Y Y<br />
Poland L 45 50 38,219 0.1 3 N Y Y<br />
Lithuania ? n.d. n.d. n.d. 2 Y Y N<br />
Slovak Rep. L n.d. n.d. n.d. 0 N Y Y<br />
UK* H 430 1,000 59,329 1.2 5 Y Y Y<br />
France M 300 500 59,635 0.7 2 Y Y Y<br />
Germany H 500 1,500 82,537 1.2 4 5 Y 5 Y Y<br />
Austria M 40 100 8,102 0.9 0 Y 4 Y Y<br />
Cyprus* VH 40 40 715 5.6 0 N Y Y<br />
Czech Rep. H 195 195 10,203 1.9 0 N N Y<br />
Bulgaria L n.d. n.d. n.d. 0 N N Y<br />
Latvia L n.d. n.d. n.d. 0 N Y N<br />
Malta* L n.d. n.d. n.d. 0 N Y Y<br />
Romania L n.d. n.d. n.d. 0 N Y Y<br />
Slovenia L n.d. n.d. n.d. 0 N N N<br />
* <strong>in</strong>dicates that this country has failed to return the ICMPD questionnaire<br />
Notes<br />
1 These should be read as a cautious assessment of the approximate size of the irregular migrant population.<br />
Where estimates of irregular migrant stocks are available (cols. 2,3), these have been used as a proportion of<br />
total population (col. 5). A ratio of less than 0.5% is considered to be low (L); 0.5—0.9% is medium (M); 1—<br />
1.9% is high (H); and >2% is very high (VH). Otherwise, qualitative and other <strong>in</strong>dicators have been utilised for<br />
this evaluation.<br />
2<br />
The data source for cols. 2, 3 and 4 is GHK (2007), except for Sweden, which are taken from Blaschke and<br />
the <strong>REGINE</strong> country reports (see bibliographic references)<br />
3 Includes the de facto regularisation (residence permits for illegal residents) of 2006, which the Italian<br />
government does not consider to be a regularisation<br />
4<br />
Includes an employment based regularisation (via work permits) which effectively amounted to the<br />
regularisation of illegal residence<br />
5 Covers specific regularisation programmes for long-term tolerated persons, which the German government<br />
does not consider to constitute regularisation<br />
41