Optimal Design of LCL Harmonic Filters for Three-Phase PFC ...
Optimal Design of LCL Harmonic Filters for Three-Phase PFC ...
Optimal Design of LCL Harmonic Filters for Three-Phase PFC ...

You also want an ePaper? Increase the reach of your titles
YUMPU automatically turns print PDFs into web optimized ePapers that Google loves.
MÜHLETHALER et al.: OPTIMAL DESIGN OF <strong>LCL</strong> HARMONIC FILTERS FOR THREE-PHASE <strong>PFC</strong> RECTIFIERS 3123<br />
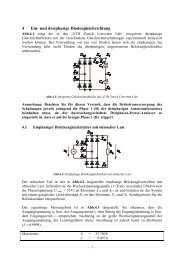
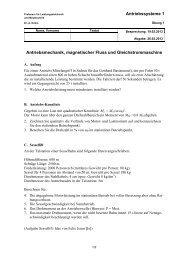
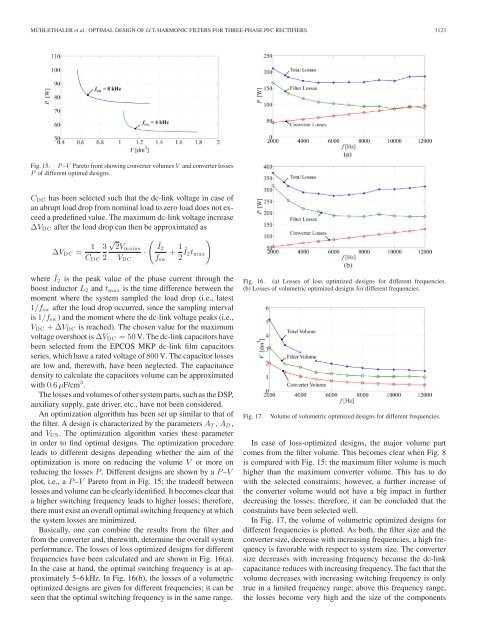
Fig. 15. P –V Pareto front showing converter volumes V and converter losses<br />
P <strong>of</strong> different optimal designs.<br />
C DC has been selected such that the dc-link voltage in case <strong>of</strong><br />
an abrupt load drop from nominal load to zero load does not exceed<br />
a predefined value. The maximum dc-link voltage increase<br />
ΔV DC after the load drop can then be approximated as<br />
ΔV DC = 1<br />
√<br />
3 2Vmains<br />
·<br />
C DC 2 V DC<br />
(<br />
Î2<br />
f sw<br />
+ 1 2Î2t max<br />
)<br />
where Î2 is the peak value <strong>of</strong> the phase current through the<br />
boost inductor L 2 and t max is the time difference between the<br />
moment where the system sampled the load drop (i.e., latest<br />
1/f sw after the load drop occurred, since the sampling interval<br />
is 1/f sw ) and the moment where the dc-link voltage peaks (i.e.,<br />
V DC +ΔV DC is reached). The chosen value <strong>for</strong> the maximum<br />
voltage overshoot is ΔV DC =50V. The dc-link capacitors have<br />
been selected from the EPCOS MKP dc-link film capacitors<br />
series, which have a rated voltage <strong>of</strong> 800 V. The capacitor losses<br />
are low and, therewith, have been neglected. The capacitance<br />
density to calculate the capacitors volume can be approximated<br />
with 0.6 μF/cm 3 .<br />
The losses and volumes <strong>of</strong> other system parts, such as the DSP,<br />
auxiliary supply, gate driver, etc., have not been considered.<br />
An optimization algorithm has been set up similar to that <strong>of</strong><br />
the filter. A design is characterized by the parameters A T , A D ,<br />
and V CS . The optimization algorithm varies these parameter<br />
in order to find optimal designs. The optimization procedure<br />
leads to different designs depending whether the aim <strong>of</strong> the<br />
optimization is more on reducing the volume V or more on<br />
reducing the losses P . Different designs are shown by a P –V<br />
plot, i.e., a P –V Pareto front in Fig. 15; the trade<strong>of</strong>f between<br />
losses and volume can be clearly identified. It becomes clear that<br />
a higher switching frequency leads to higher losses; there<strong>for</strong>e,<br />
there must exist an overall optimal switching frequency at which<br />
the system losses are minimized.<br />
Basically, one can combine the results from the filter and<br />
from the converter and, therewith, determine the overall system<br />
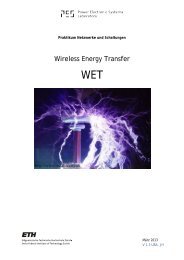
per<strong>for</strong>mance. The losses <strong>of</strong> loss optimized designs <strong>for</strong> different<br />
frequencies have been calculated and are shown in Fig. 16(a).<br />
In the case at hand, the optimal switching frequency is at approximately<br />
5–6 kHz. In Fig. 16(b), the losses <strong>of</strong> a volumetric<br />
optimized designs are given <strong>for</strong> different frequencies; it can be<br />
seen that the optimal switching frequency is in the same range.<br />
Fig. 16. (a) Losses <strong>of</strong> loss optimized designs <strong>for</strong> different frequencies.<br />
(b) Losses <strong>of</strong> volumetric optimized designs <strong>for</strong> different frequencies.<br />
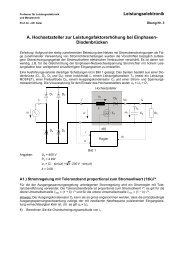
Fig. 17.<br />
Volume <strong>of</strong> volumetric optimized designs <strong>for</strong> different frequencies.<br />
In case <strong>of</strong> loss-optimized designs, the major volume part<br />
comes from the filter volume. This becomes clear when Fig. 8<br />
is compared with Fig. 15: the maximum filter volume is much<br />
higher than the maximum converter volume. This has to do<br />
with the selected constraints; however, a further increase <strong>of</strong><br />
the converter volume would not have a big impact in further<br />
decreasing the losses; there<strong>for</strong>e, it can be concluded that the<br />
constraints have been selected well.<br />
In Fig. 17, the volume <strong>of</strong> volumetric optimized designs <strong>for</strong><br />
different frequencies is plotted. As both, the filter size and the<br />
converter size, decrease with increasing frequencies, a high frequency<br />
is favorable with respect to system size. The converter<br />
size decreases with increasing frequency because the dc-link<br />
capacitance reduces with increasing frequency. The fact that the<br />
volume decreases with increasing switching frequency is only<br />
true in a limited frequency range; above this frequency range,<br />
the losses become very high and the size <strong>of</strong> the components