Optimal Design of LCL Harmonic Filters for Three-Phase PFC ...
Optimal Design of LCL Harmonic Filters for Three-Phase PFC ...
Optimal Design of LCL Harmonic Filters for Three-Phase PFC ...

Create successful ePaper yourself
Turn your PDF publications into a flip-book with our unique Google optimized e-Paper software.
3120 IEEE TRANSACTIONS ON POWER ELECTRONICS, VOL. 28, NO. 7, JULY 2013<br />
Fig. 8. P –V Pareto front showing filter volumes V and filter losses P <strong>of</strong><br />
different optimal designs.<br />
V. OPTIMIZATION OUTCOMES<br />
The optimization procedure leads to different filter designs<br />
depending on the chosen weighting factors k 1 and k 2 in (13),<br />
i.e., depending whether the aim <strong>of</strong> the optimization is more<br />
on reducing the volume V or more on reducing the losses P .<br />
Limiting factors are the maximum temperature T max (limits<br />
the volume from being too low) and a maximum volume V max<br />
(limits the efficiency from being too high). Different designs are<br />
shown by a P –V plot, i.e., a P –V Pareto front in Fig. 8; the<br />
trade<strong>of</strong>f between losses and volume can be clearly identified.<br />
One design <strong>of</strong> Fig. 8 has been selected <strong>for</strong> further investigations.<br />
Particularly, a comparison between the (<strong>for</strong> the optimization<br />
procedure) simplified and the more elaborate calculation<br />
based on voltage/current wave<strong>for</strong>ms from a circuit simulator<br />
has been made. The filter parameters <strong>of</strong> the selected<br />
design are detailed in Fig. 8. The circuit <strong>of</strong> the three-phase<br />
<strong>PFC</strong> rectifier with the selected input filter has been simulated<br />
in MATLAB/Simulink, and the simulated current and voltage<br />
wave<strong>for</strong>ms have been taken to calculate the losses according<br />
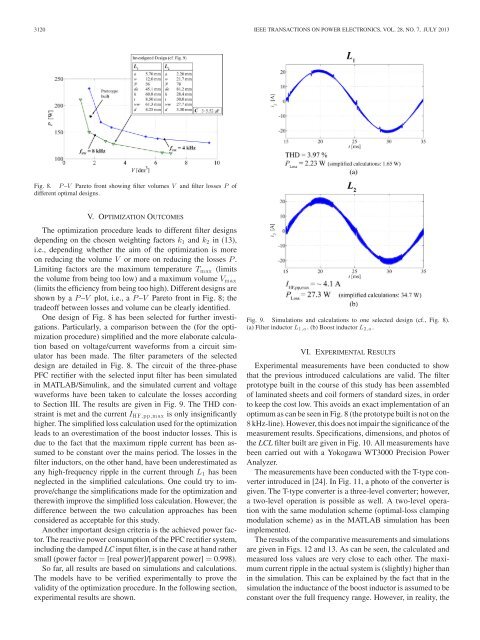
to Section III. The results are given in Fig. 9. The THD constraint<br />
is met and the current I HF,pp,max is only insignificantly<br />
higher. The simplified loss calculation used <strong>for</strong> the optimization<br />
leads to an overestimation <strong>of</strong> the boost inductor losses. This is<br />
due to the fact that the maximum ripple current has been assumed<br />
to be constant over the mains period. The losses in the<br />
filter inductors, on the other hand, have been underestimated as<br />
any high-frequency ripple in the current through L 1 has been<br />
neglected in the simplified calculations. One could try to improve/change<br />
the simplifications made <strong>for</strong> the optimization and<br />
therewith improve the simplified loss calculation. However, the<br />
difference between the two calculation approaches has been<br />
considered as acceptable <strong>for</strong> this study.<br />
Another important design criteria is the achieved power factor.<br />
The reactive power consumption <strong>of</strong> the <strong>PFC</strong> rectifier system,<br />
including the damped LC input filter, is in the case at hand rather<br />
small (power factor = [real power]/[apparent power] = 0.998).<br />
So far, all results are based on simulations and calculations.<br />
The models have to be verified experimentally to prove the<br />
validity <strong>of</strong> the optimization procedure. In the following section,<br />
experimental results are shown.<br />
Fig. 9. Simulations and calculations to one selected design (cf., Fig. 8).<br />
(a) Filter inductor L 1,a . (b) Boost inductor L 2,a .<br />
VI. EXPERIMENTAL RESULTS<br />
Experimental measurements have been conducted to show<br />
that the previous introduced calculations are valid. The filter<br />
prototype built in the course <strong>of</strong> this study has been assembled<br />
<strong>of</strong> laminated sheets and coil <strong>for</strong>mers <strong>of</strong> standard sizes, in order<br />
to keep the cost low. This avoids an exact implementation <strong>of</strong> an<br />
optimum as can be seen in Fig. 8 (the prototype built is not on the<br />
8 kHz-line). However, this does not impair the significance <strong>of</strong> the<br />
measurement results. Specifications, dimensions, and photos <strong>of</strong><br />
the <strong>LCL</strong> filter built are given in Fig. 10. All measurements have<br />
been carried out with a Yokogawa WT3000 Precision Power<br />
Analyzer.<br />
The measurements have been conducted with the T-type converter<br />
introduced in [24]. In Fig. 11, a photo <strong>of</strong> the converter is<br />
given. The T-type converter is a three-level converter; however,<br />
a two-level operation is possible as well. A two-level operation<br />
with the same modulation scheme (optimal-loss clamping<br />
modulation scheme) as in the MATLAB simulation has been<br />
implemented.<br />
The results <strong>of</strong> the comparative measurements and simulations<br />
are given in Figs. 12 and 13. As can be seen, the calculated and<br />
measured loss values are very close to each other. The maximum<br />
current ripple in the actual system is (slightly) higher than<br />
in the simulation. This can be explained by the fact that in the<br />
simulation the inductance <strong>of</strong> the boost inductor is assumed to be<br />
constant over the full frequency range. However, in reality, the