assessment of the socio-economic and environmental impact
assessment of the socio-economic and environmental impact
assessment of the socio-economic and environmental impact

You also want an ePaper? Increase the reach of your titles
YUMPU automatically turns print PDFs into web optimized ePapers that Google loves.
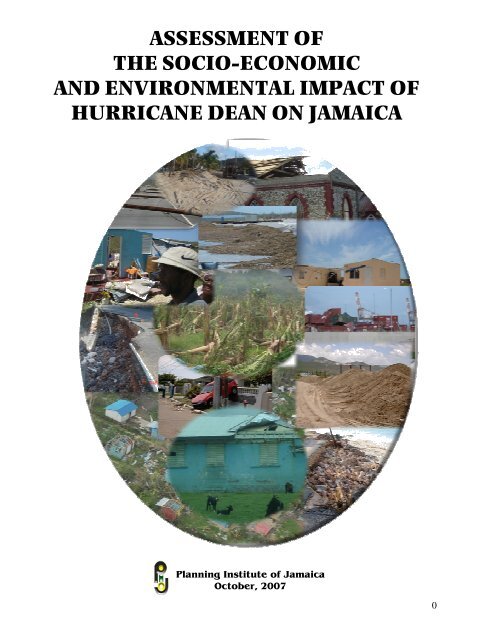
ASSESSMENT OF<br />
THE SOCIO-ECONOMIC<br />
AND ENVIRONMENTAL IMPACT OF<br />
HURRICANE DEAN ON JAMAICA<br />
Planning Institute <strong>of</strong> Jamaica<br />
October, 2007<br />
0
TABLE OF CONTENTS<br />
Page<br />
Executive Summary<br />
i<br />
Preface<br />
I. Introduction 2<br />
II. Social Sectors 15<br />
III. Productive Sectors 25<br />
IV. Infrastructure 46<br />
V. Impact on <strong>the</strong> Environment 61<br />
VI. Summary <strong>of</strong> Damage <strong>and</strong> Losses 71<br />
<strong>and</strong> Macro<strong>economic</strong> Effects<br />
VII. Guidelines for a Rehabilitation <strong>and</strong> Reconstruction Programme 79<br />
i
Executive Summary<br />
As at October 26, 2007 <strong>the</strong> preliminary estimate <strong>of</strong> <strong>the</strong> damage <strong>and</strong> losses incurred by <strong>the</strong><br />
Jamaican economy due to <strong>the</strong> passage <strong>of</strong> Hurricane Dean on August 19, 2007 was $23.05 billion<br />
(US$ 329.34 million). See Table 1.<br />
Damage <strong>and</strong> losses in <strong>the</strong> productive sector represented <strong>the</strong> greatest portion <strong>of</strong> <strong>impact</strong> accounting<br />
for over 50.0 percent <strong>of</strong> <strong>the</strong> estimated total. See Figure 1. Most <strong>of</strong> <strong>the</strong> cost was incurred within<br />
<strong>the</strong> agricultural sector <strong>and</strong> is related mainly to projected loss <strong>of</strong> revenue associated with damage<br />
to traditional export crops such as bananas, sugar <strong>and</strong> c<strong>of</strong>fee. Domestic agriculture, particularly<br />
ground provisions, vegetables <strong>and</strong> pulses, <strong>and</strong> fruit crops experienced significant <strong>impact</strong>. While<br />
damage to road infrastructure was relatively minimal, <strong>the</strong>re were instances <strong>of</strong> severe erosion <strong>of</strong><br />
sea defence which led to <strong>the</strong> damage <strong>of</strong> coastal roads in St. Thomas, Portl<strong>and</strong> <strong>and</strong> St. Andrew<br />
<strong>and</strong> disruption <strong>of</strong> social <strong>and</strong> <strong>economic</strong> activities.<br />
With <strong>the</strong> effect <strong>of</strong> Hurricane Dean, <strong>the</strong> economy is expected to grow by 1.1 per cent for 2007<br />
instead <strong>of</strong> <strong>the</strong> 2.1 per cent forecast prior to its passage. This will result from losses in output<br />
flows primarily in <strong>the</strong> Agriculture, Forestry & Fishing, Mining & Quarrying <strong>and</strong> Electricity &<br />
Water sectors. However, <strong>the</strong> Construction & Installation <strong>and</strong> Distributive Trade sectors are<br />
estimated to be positively <strong>impact</strong>ed by <strong>the</strong> effects <strong>of</strong> <strong>the</strong> hurricane. The Construction &<br />
Installation sector is expected to benefit from reconstruction activity. An expansion in activity in<br />
<strong>the</strong> Distributive Trade sector is predicated on projected higher gross sales associated with<br />
preparations prior to <strong>the</strong> hurricane <strong>and</strong> reconstructive work in <strong>the</strong> aftermath <strong>of</strong> <strong>the</strong> passage <strong>of</strong> <strong>the</strong><br />
hurricane.<br />
The social cost <strong>of</strong> <strong>the</strong> hurricane was fairly substantial. Approximately 6.7 per cent <strong>of</strong> <strong>the</strong> total<br />
population or some 179 552 persons from 169 communities were directly affected by <strong>the</strong> natural<br />
disaster. At <strong>the</strong> peak <strong>of</strong> <strong>the</strong> event, a total <strong>of</strong> 213 shelters were opened across all parishes housing<br />
5 169 persons. The parishes with <strong>the</strong> highest number <strong>of</strong> persons in shelters were Portl<strong>and</strong>,<br />
Kingston <strong>and</strong> St. Andrew <strong>and</strong> St. James with 914; 714; <strong>and</strong> 555 persons respectively. Up to<br />
seven days after <strong>the</strong> event, 11 communities in <strong>the</strong> parishes <strong>of</strong> St. Thomas <strong>and</strong> Kingston <strong>and</strong> St.<br />
Andrew were still marooned <strong>and</strong> over 500 persons remained in emergency shelters isl<strong>and</strong>-wide.<br />
However, by August 26, electricity had been restored to approximately 80 percent <strong>of</strong> customers<br />
<strong>and</strong> water supplies to close to 90 per cent.<br />
Some 518 schools <strong>and</strong> public educational institutions <strong>and</strong> an estimated 70 000 houses were<br />
damaged. At <strong>the</strong> time <strong>of</strong> <strong>the</strong> preparation <strong>of</strong> this report, it was indicated that over 55 per cent <strong>of</strong><br />
houses assessed had experienced major damage <strong>and</strong> over 39 per cent were totally destroyed.<br />
Most <strong>of</strong> <strong>the</strong>se were in poor <strong>and</strong> vulnerable coastal communities such as Old Harbour Bay, Rocky<br />
Point <strong>and</strong> Portl<strong>and</strong> Cottage along <strong>the</strong> south coast.<br />
The <strong>impact</strong> on livelihood is considered significant as some 56 537 food crop <strong>and</strong> 7 170 livestock<br />
farmers, <strong>and</strong> over 3 500 fisher folk were directly affected. The income <strong>of</strong> some 3 000 banana<br />
workers was also affected. The negative <strong>impact</strong> on crop losses <strong>and</strong> timing <strong>of</strong> <strong>the</strong> hurricane was<br />
particularly bad in farming communities as many families which lost crops <strong>and</strong> income would<br />
have been preparing for back to school expenditures.<br />
The Ministry <strong>of</strong> Health confirmed six (6) deaths due to Hurricane Dean, 4 males <strong>and</strong> 2 females<br />
ii
esulting from falling concrete block, flying debris, wind effect <strong>and</strong> ro<strong>of</strong> collapse <strong>and</strong> two<br />
indirect deaths from electrocution. Hospital <strong>and</strong> sentinel surveillance sites reported 628 injuries<br />
between August 19 <strong>and</strong> 25.<br />
Table 1: Preliminary Costs <strong>of</strong> Damage <strong>and</strong> Losses caused by Hurricane Dean ($million)<br />
Sector <strong>and</strong> Sub-sector<br />
$million<br />
Direct Indirect Total Private Public<br />
Total 14,392.15 8,661.78 23,053.92 18,753.69 4,300.24<br />
Social 6,994.24 80.18 7,074.42 5,961.68 1,112.74<br />
Housing 5,961.68 5,961.68 5,961.68<br />
Education <strong>and</strong> Culture 727.86 727.86 727.86<br />
Health 218.35 80.18 298.53 298.53<br />
Correctional Facilities 77.08 77.08 77.08<br />
Heritage Sites 9.27 9.27 9.27<br />
Productive 3,957.68 7,708.60 11,666.28 11,451.08 215.20<br />
Domestic Crop 904.37 904.37 904.37<br />
Livestock 74.50 74.50 74.50<br />
Greenhouse/Protected Cultivation 52.47 52.47 52.47<br />
Agricultural Crops*1 2,357.45 5,603.00 7,960.45 7,960.45<br />
Fisheries*2 310.00 75.60 385.60 385.60<br />
Irrigation 17.20 0.00 17.20 0.00 17.20<br />
Mining 2,030.00 2,030.00 2,030.00<br />
Tourism 43.69 0.00 43.69 43.69<br />
Manufacturing 0.00 0.00 0.00<br />
Relief Assistance (Agriculture)*3 198.00 0.00 198.00 0.00 198.00<br />
Infrastructure 3,440.23 150.00 3,590.23 1,340.93 2,249.30<br />
Electricity*4 1,073.25 1,073.25 1,073.25<br />
Water Supply <strong>and</strong> Sanitation 52.00 150.00 202.00 202.00<br />
Transport/Roads <strong>and</strong> Bridges 2,047.30 2,047.30 2,047.30<br />
Telecommunications*5 267.68 267.68 267.68<br />
Environment 0.00 120.00 120.00 120.00<br />
Forestry 0.00 0.00<br />
Waste Management 120.00 120.00 120.00<br />
Emergency Operations 603.00 603.00 603.00<br />
Government Relief Assistance 580.00 580.00 580.00<br />
ODPEM Recovery Activities 23.00 23.00 23.00<br />
Source: Compiled by <strong>the</strong> PIOJ with data from various agencies<br />
*1 Agricultural crops include citrus, c<strong>of</strong>fee, cocoa, banana <strong>and</strong> sugar<br />
*2 Calculations for Indirect cost based on 52,500 lost fish traps with an average catch 2kg <strong>of</strong> fish <strong>and</strong><br />
harvested 3 times within a 2 week period at a cost <strong>of</strong> $240/kg<br />
*3 Includes funds provided by <strong>the</strong> MOA to purchase <strong>and</strong> distribute fertilizer, assistance to farmers who lost greenhouses,<br />
rehabilitation <strong>of</strong> fruit trees, assistance to fishermen <strong>and</strong> banana farmers <strong>and</strong> a grant to <strong>the</strong> Sugar Industry<br />
*4 Calculated at approximately 75% <strong>of</strong> JPS claim to OUR for Hurricane Ivan (1.431 billion)<br />
*5 Includes preliminary estimates <strong>of</strong> damage to Cable & Wireless, Digicel <strong>and</strong> Post & Telecommunications infrastructure<br />
iii
Environmental <strong>impact</strong>s <strong>of</strong> Hurricane Dean included damage to coastal <strong>and</strong> inl<strong>and</strong> ecosystems<br />
from storm surge, <strong>and</strong> defoliation; destruction <strong>of</strong> wildlife habitats, l<strong>and</strong>slides <strong>and</strong> vegetation<br />
damage (Table 2). Due to <strong>the</strong> sou<strong>the</strong>rly path taken by <strong>the</strong> hurricane, most <strong>of</strong> <strong>the</strong> <strong>impact</strong>s<br />
occurred in <strong>the</strong> sou<strong>the</strong>rn part <strong>of</strong> <strong>the</strong> country. The parishes experiencing <strong>the</strong> worst <strong>environmental</strong><br />
damage were Portl<strong>and</strong>; Clarendon; Manchester; St. Elizabeth; Hanover <strong>and</strong> Westmorel<strong>and</strong>; St.<br />
Thomas; Kingston & St. Andrew <strong>and</strong> St. Ca<strong>the</strong>rine.<br />
Figure 1: Sectoral Cost <strong>of</strong> Damage & Losses<br />
2.6%<br />
0.5%<br />
15.6%<br />
30.7%<br />
50.6%<br />
Social Productive Infrastructure Environment Emergency Operations<br />
Table 2: Summary <strong>of</strong> Impacts on Ecosystems by Parish by Hurricane Dean<br />
HABITAT<br />
Beaches Marshl<strong>and</strong>s Mangroves Forests<br />
IMPACT Erosion Lateral Compression Crown Damage<br />
PARISH Level % Affected Level % Affected Level % Affected Level % Affected<br />
Clarendon High 100 Low 100 Low 40 Low 90<br />
Moderate 30 High 10<br />
High 30<br />
Manchester Moderate 100 Moderate 100 Low 20 Low 95<br />
Moderate 50 Moderate 5<br />
High 30<br />
St. Ann Low 100<br />
St. Ca<strong>the</strong>rine Moderate 40 Low 95<br />
High 60 Moderate 5<br />
St. Elizabeth Moderate 100 Low 100 Low 50 Low 95<br />
Moderate 30 Moderate 5<br />
High 20<br />
St. James Low 100<br />
St. Thomas Moderate 20 Low 60 Low 95<br />
High 80 Moderate 40 Moderate 5<br />
Portl<strong>and</strong> Moderate 40 Low 90<br />
High 60 Moderate 10<br />
Trelawny Low 100<br />
Westmorel<strong>and</strong> Low 100<br />
St. Mary Low 100<br />
Source: National Environment <strong>and</strong> Planning Agency, 2007<br />
Crown Damage: 0-25% - Low; 26-50% - Moderate; > than 50% - High<br />
iv
Lessons Learnt<br />
The <strong>impact</strong> <strong>of</strong> Hurricane Dean highlighted issues relating to continued improper l<strong>and</strong> use,<br />
building practices <strong>and</strong> coastal roads design <strong>and</strong> construction. A considerable portion <strong>of</strong> <strong>the</strong><br />
<strong>impact</strong> resulted from inappropriate location <strong>of</strong> settlements, for example communities such as<br />
Portl<strong>and</strong> Cottage, <strong>and</strong> Rocky Point in Clarendon <strong>and</strong> Caribbean Terrace, St. Andrew. The areas<br />
affected in Clarendon, St. Ca<strong>the</strong>rine, Kingston, St. Thomas <strong>and</strong> St. Elizabeth are below 10<br />
metres threshold <strong>and</strong> are <strong>the</strong>refore prone to flooding. (Figure 5.1).<br />
Planning <strong>and</strong> design defects were evident <strong>and</strong> were contributory factors cited with respect to<br />
damaged housing in Rocky Point, Clarendon, Portl<strong>and</strong> Cottage, Clarendon, Old Harbour, St.<br />
Ca<strong>the</strong>rine <strong>and</strong> White Horses, St. Thomas. In <strong>the</strong> past, building practices incorporated more<br />
mitigation measures <strong>and</strong> <strong>the</strong> housing stock were better able to withst<strong>and</strong> wind <strong>and</strong> flood <strong>impact</strong>.<br />
Older buildings were likely to be built on stilts with a finish >2ft above ground level compared<br />
with newer buildings with a finish <strong>of</strong> < 1 ft above ground level.<br />
Coastal Roads: A common feature <strong>of</strong> coastal roads in Jamaica is that <strong>the</strong>y are constructed in low<br />
lying areas <strong>and</strong> are <strong>the</strong>refore prone to flooding <strong>and</strong> subsequent damage. As evidenced, roads<br />
such as Roselle <strong>and</strong> Palisadoes have been subjected to frequent flooding. The imperative <strong>of</strong><br />
engineering coastal roads with adequate height (above sea level), drainage, central slope <strong>and</strong><br />
protective structures to minimize effects from coastal hazards was again underlined.<br />
v
PREFACE<br />
This report is prepared to document <strong>impact</strong> on affected population; estimate costs <strong>of</strong> damages<br />
<strong>and</strong> losses; identify geographically affected areas; <strong>and</strong> identifying <strong>the</strong> financial priorities for<br />
rehabilitation <strong>and</strong> reconstruction.<br />
The <strong>assessment</strong> was prepared by <strong>the</strong> Planning Institute <strong>of</strong> Jamaica in close collaboration with<br />
<strong>the</strong> Office <strong>of</strong> Disaster Preparedness <strong>and</strong> Emergency Management (ODPEM), <strong>and</strong> <strong>the</strong> National<br />
Environmental Planning Agency. Data <strong>and</strong> information were provided by various ministries <strong>and</strong><br />
agencies <strong>of</strong> <strong>the</strong> Government <strong>of</strong> Jamaica as well as several non-government institutions <strong>and</strong><br />
private sector entities. These include, among o<strong>the</strong>rs:<br />
- The Meteorological Office<br />
- Ministry <strong>of</strong> Labour <strong>and</strong> Social Security<br />
- Ministry <strong>of</strong> Health<br />
- Ministry <strong>of</strong> Education <strong>and</strong> Youth<br />
- National Works Agency<br />
- Ministry <strong>of</strong> Water, Housing, Transport <strong>and</strong> Works<br />
- Ministry <strong>of</strong> Agriculture <strong>and</strong> L<strong>and</strong>s<br />
- RADA<br />
- Insurance Association <strong>of</strong> Jamaica<br />
- National Water Commission<br />
- Jamaica Public Service<br />
The <strong>assessment</strong> was made following <strong>the</strong> st<strong>and</strong>ard ECLAC methodology for Estimating <strong>the</strong><br />
Socio-<strong>economic</strong> <strong>and</strong> Environmental Effects <strong>of</strong> Disasters. The information supplied in <strong>the</strong> report<br />
is preliminary <strong>and</strong> subject to revision. The cut-<strong>of</strong>f point for data used in <strong>the</strong> report was October<br />
26, 2007.<br />
1
I. INTRODUCTION<br />
1. Description <strong>of</strong> <strong>the</strong> Event<br />
Meteorological Phenomenon<br />
Hurricane Dean <strong>and</strong> its passage<br />
Tropical Depression #4 developed over <strong>the</strong> far eastern Atlantic near latitude 12.0º North,<br />
longitude 31.6º West on August 13 at 1500 UTC <strong>and</strong> showed signs <strong>of</strong> streng<strong>the</strong>ning as it moved<br />
quickly towards <strong>the</strong> west. The depression was upgraded to Tropical Storm Dean on August 14 at<br />
1500 UTC <strong>and</strong> continued on a more or less westward track while continuing to streng<strong>the</strong>n. On<br />
<strong>the</strong> 15th at 1500 UTC forecast models indicated that <strong>the</strong> system could have some <strong>impact</strong> on<br />
Jamaica on Monday, August 20. (See Figure 1.1).<br />
Tropical Storm Dean was upgraded to a<br />
hurricane on August 16 <strong>and</strong> continued to<br />
streng<strong>the</strong>n as it moved quickly towards <strong>the</strong><br />
west. It was fur<strong>the</strong>r upgraded to a category 2<br />
hurricane on August 16.<br />
The forecast track<br />
was now for Hurricane Dean to make l<strong>and</strong>fall<br />
in <strong>the</strong> Eastern Caribbean, somewhere in <strong>the</strong><br />
vicinity <strong>of</strong> Martinique <strong>and</strong> to pass just south <strong>of</strong><br />
Jamaica during <strong>the</strong> afternoon <strong>of</strong> Sunday,<br />
August 19.<br />
Once Hurricane Dean crossed into <strong>the</strong> Caribbean Sea, <strong>environmental</strong> conditions became more<br />
favourable for continued streng<strong>the</strong>ning, <strong>the</strong> Meteorological Service, Jamaica (MET) issued<br />
Bulletin #1 at 1500 UTC on Friday, August 17 indicating that Hurricane Dean (close to 1500<br />
kilometres (940 miles) east sou<strong>the</strong>ast <strong>of</strong> Morant Point, Jamaica), posed a possible threat to <strong>the</strong><br />
isl<strong>and</strong>. At this time, MET issued an immediate evacuation order for all Fishers on <strong>the</strong> cays <strong>and</strong><br />
banks <strong>and</strong> an advisory for all o<strong>the</strong>r small craft operators in coastal waters to return to port <strong>and</strong><br />
those in port were advised not to venture out.<br />
Figure 1.1: Tropical Storm Dean at 1500 UTC,<br />
August 15, 2007. Projected to <strong>impact</strong> on Jamaica<br />
2
Hurricane Dean was upgraded to a major hurricane (Category 3) with sustained wind speeds near<br />
205 km/h (125 mph) on <strong>the</strong> 17 th . The Hurricane Watch was continued for <strong>the</strong> isl<strong>and</strong> overnight<br />
while Hurricane Dean streng<strong>the</strong>ned to become a dangerous category 4 hurricane at 1200 UTC.<br />
MET upgraded <strong>the</strong> Hurricane Watch to<br />
a Hurricane Warning on Saturday August<br />
18. The forecast was for Hurricane Dean to<br />
move south <strong>of</strong> Hispaniola overnight <strong>and</strong><br />
<strong>the</strong>n to make l<strong>and</strong>fall over eastern Jamaica<br />
during <strong>the</strong> afternoon on Sunday, August 19<br />
before tracking across <strong>the</strong> isl<strong>and</strong> Sunday<br />
evening/night. (See Figure 1.2).<br />
The outer b<strong>and</strong>s <strong>of</strong> <strong>the</strong> hurricane were forecast to start affecting <strong>the</strong> isl<strong>and</strong> by late Saturday night<br />
with increasing cloudiness, showers <strong>and</strong> gusty winds. On August 19 (10 p.m. local time Saturday<br />
night) <strong>the</strong> forecast track was adjusted to indicate that <strong>the</strong> eye <strong>of</strong> Hurricane Dean could now move<br />
very close along <strong>the</strong> south coast <strong>of</strong><br />
Jamaica on Sunday afternoon <strong>and</strong> through<br />
<strong>the</strong> evening (see Figure 1.3). The forecast<br />
was for <strong>the</strong> outer b<strong>and</strong>s <strong>of</strong> <strong>the</strong> hurricane to<br />
start affecting <strong>the</strong> isl<strong>and</strong> by early Sunday<br />
morning with periods <strong>of</strong> showers <strong>and</strong><br />
gusty winds reaching near gale force. With<br />
Dean’s approach, heavy rainfall was<br />
expected to spread across <strong>the</strong> isl<strong>and</strong> with<br />
<strong>the</strong> potential for severe flash flooding <strong>and</strong><br />
l<strong>and</strong>slides. Storm surge flooding <strong>of</strong> 1.5-3<br />
Figure 1.2: Hurricane Dean at 1500 UTC,<br />
August 18, 2007.<br />
Figure 1.3: Hurricane Dean at 03500 UTC,<br />
August 19, 2007.<br />
metres (7-9 feet) above normal tide levels along with large <strong>and</strong> dangerous battering waves were<br />
also forecast near <strong>the</strong> centre <strong>of</strong> Dean, especially over sou<strong>the</strong>rn coastal areas.<br />
3
Wea<strong>the</strong>r conditions associated with Hurricane Dean started to affect Jamaica, especially eastern<br />
parishes at around 1245 UTC (0745 hours local time) on Sunday morning August 19. MET<br />
indicated that <strong>the</strong>se conditions could spread westward to influence <strong>the</strong> entire isl<strong>and</strong> <strong>and</strong> as <strong>the</strong><br />
eye <strong>of</strong> Hurricane Dean moved closer to <strong>the</strong> isl<strong>and</strong>, wea<strong>the</strong>r conditions progressively deteriorated<br />
(see Figure 1.4). Hurricane Warnings remained in effect for Jamaica as heavy rains associated<br />
with Hurricane Dean began to affect <strong>the</strong> eastern sections <strong>of</strong> <strong>the</strong> isl<strong>and</strong> as <strong>the</strong> system approached.<br />
Hurricane Dean continued west just <strong>of</strong>f <strong>the</strong><br />
south coast with an average forward speed<br />
<strong>of</strong> 31 km/h (19mph) to pass between <strong>the</strong><br />
Pedro Banks <strong>and</strong> <strong>the</strong> mainl<strong>and</strong>. The eye <strong>of</strong><br />
Hurricane Dean was located at its possible<br />
closest position to <strong>the</strong> mainl<strong>and</strong> at 1800<br />
hours local time when it was estimated to<br />
be about 35 kilometres (21 miles) south <strong>of</strong><br />
Portl<strong>and</strong> Point, central Jamaica. An hour<br />
later on <strong>the</strong> 20th at 0000 UTC (1900<br />
hours local time Sunday night) <strong>the</strong> eye <strong>of</strong><br />
Hurricane Dean was located about 40<br />
kilometres (25 miles) south <strong>of</strong> Lover’s Leap, St. Elizabeth. Between this time <strong>and</strong> <strong>the</strong> next half<br />
hour wind speeds reaching 165 km/h or 103mph; category 2 hurricane force wind speed were<br />
reported at Munro just to <strong>the</strong> north <strong>of</strong> Lover’s Leap.<br />
Figure 1.4: Satellite imagery <strong>of</strong> Hurricane Dean near<br />
its possible closest position to mainl<strong>and</strong> Jamaica on<br />
August 19, 2007 at 2145 UTC (1645 hours local time)<br />
The Hurricane Warning in effect for Jamaica was downgraded to a Tropical Storm Warming in<br />
at 1500 UTC on August 20. The final Bulletin was issued by MET on <strong>the</strong> 20th at 1800 UTC<br />
lifting all warning messages for <strong>the</strong> isl<strong>and</strong>.<br />
Meteorological Data Analysis<br />
Data collection associated with <strong>the</strong> passage <strong>of</strong> Hurricane Dean has been limited due to a number<br />
<strong>of</strong> challenges: At <strong>the</strong> Norman Manley International Airport, <strong>the</strong> wea<strong>the</strong>r station tower was blown<br />
4
down just after 1800 UTC (1300 local time) on Sunday, August 19, which resulted in <strong>the</strong> loss <strong>of</strong><br />
data. Data from <strong>the</strong> station located at <strong>the</strong> Pedro Bank were limited due to communication<br />
difficulties. Rainfall data is limited as a result <strong>of</strong> <strong>the</strong> loss <strong>of</strong> a number <strong>of</strong> rain gauges <strong>and</strong> <strong>the</strong> fact<br />
that manual collection <strong>of</strong> data from most <strong>of</strong> <strong>the</strong> stations in remote areas was not possible due to<br />
<strong>the</strong> inaccessible roadways. Available data associated with <strong>the</strong> passage <strong>of</strong> Hurricane Dean are<br />
presented as follows:<br />
Folly Point (Portl<strong>and</strong>):<br />
Data recorded at <strong>the</strong> Folly Point automatic wea<strong>the</strong>r station located in north-eastern Portl<strong>and</strong><br />
indicated that <strong>the</strong>re was a gradual increase in wind speed <strong>and</strong> <strong>the</strong> resultant gradual decrease in<br />
<strong>the</strong> atmospheric pressure to <strong>the</strong> point <strong>of</strong> <strong>the</strong> maximum sustained wind speed. The maximum wind<br />
speed recorded was 43.6 knots or 80.7 km/h or 50.1 mph at 1928 UTC (1428 hours local time)<br />
on <strong>the</strong> 19th. The minimum pressure recorded was, however, not at <strong>the</strong> time <strong>of</strong> maximum wind<br />
but lagged by one <strong>and</strong> a half to 2 hours to be recorded as 1000.0 millibars at 2058 UTC <strong>and</strong> 2128<br />
UTC (that is 1558 <strong>and</strong> 1628 hours local time) respectively. After <strong>the</strong> passage <strong>of</strong> <strong>the</strong> trough line<br />
<strong>the</strong>re was a gradual decrease in wind speed <strong>and</strong> a gradual increase in atmospheric pressure.<br />
Tropical storm force winds were recorded at Folly Point between 1828 UTC <strong>and</strong> 2258 UTC<br />
(1328 <strong>and</strong> 1758 hours local time). Rainfall amounts recorded at Folly Point on August 19 was<br />
106.4 mm with a maximum half–an-hour rainfall <strong>of</strong> 14.4mm between 2258 <strong>and</strong> 2328 UTC <strong>and</strong> a<br />
1 hour maximum rainfall amount <strong>of</strong> 25.0 mm between 2228 <strong>and</strong> 2328 UTC on <strong>the</strong> 19th (see<br />
Appendix 1 for Folly Point data).<br />
Morant Point (St. Thomas):<br />
At <strong>the</strong> Morant Point automatic wea<strong>the</strong>r station located in eastern St. Thomas, <strong>the</strong> average one<br />
hour winds increased gradually to a maximum <strong>of</strong> 54.5 knots or 100.8 km/h or 62.7 mph at 1747<br />
UTC (1247 local time) <strong>and</strong> <strong>the</strong>n gradually decreased <strong>the</strong>reafter. There was a corresponding<br />
gradual decrease in atmospheric pressure to a minimum <strong>of</strong> 999.1 millibars at 2047 UTC (1547<br />
local time ), lagging <strong>the</strong> maximum wind speed by about 3 hours <strong>and</strong> <strong>the</strong>n <strong>the</strong>re was a gradual<br />
increase in <strong>the</strong> pressure afterwards. Tropical storm force winds were experienced at Morant Point<br />
between 1647 UTC <strong>and</strong> 2347 UTC (1147 <strong>and</strong> 1847 hours local time) (see Appendix 2 for Morant<br />
Point data).<br />
5
Reports from Ham Radio Operators:<br />
One Ham Radio Operator in Stony Hill,<br />
St. Andrew reported maximum<br />
sustained wind speeds <strong>of</strong> 120 km/h or<br />
75 mph <strong>and</strong> a corresponding<br />
atmospheric pressure <strong>of</strong> 992 millibars at<br />
2219 UTC (1719 hours local time) on<br />
Sunday August 19. Ano<strong>the</strong>r operator in<br />
Portmore, St. Ca<strong>the</strong>rine reported<br />
maximum sustained wind speeds <strong>of</strong> 158<br />
km/h or 98 mph at about 2030 UTC<br />
(1530 hours local time), while a third<br />
operator in Munro, St. Elizabeth<br />
reported sustained wind speed <strong>of</strong> 165 km/h or 103 mph between 0000 <strong>and</strong> 0030 UTC on <strong>the</strong> 20th<br />
(1900 <strong>and</strong> 1930 hours local time Sunday August 19) before <strong>the</strong> instrument broke. Wind speeds<br />
reported in Portmore <strong>and</strong> Munro indicated Category 2 hurricane force winds, while those<br />
reported in Stony Hill were category 1 hurricane force winds. These seem to be consistent with<br />
<strong>the</strong> swath <strong>of</strong> <strong>the</strong> wind data from <strong>the</strong> National Hurricane Centre (see figure 1.5) indicating that<br />
Jamaica should have experienced hurricane force winds.<br />
Figure 1.5: Hurricane <strong>and</strong> Storm force wind pr<strong>of</strong>ile<br />
associated with Dean.<br />
Rainfall<br />
Most <strong>of</strong> <strong>the</strong> rain gauges along <strong>the</strong> south coast <strong>of</strong> <strong>the</strong> isl<strong>and</strong> were ei<strong>the</strong>r washed away or blown<br />
away. As a result, just a few stations were able to report rainfall (Appendix 3). Of those stations<br />
able to report rainfall, Ingleside in Manchester reported <strong>the</strong> maximum 24 hour rainfall <strong>of</strong> 342.9<br />
mm. This was followed by amounts <strong>of</strong> 256 mm recorded at <strong>the</strong> Sugar Industry Research<br />
Institute (S.I.R.I.) station also in Manchester. This amount represents 183 % <strong>of</strong> <strong>the</strong> normal<br />
rainfall expected for that station for <strong>the</strong> month <strong>of</strong> August. In St. Thomas, <strong>the</strong> amount <strong>of</strong> rainfall<br />
recorded over <strong>the</strong> 2-day period August 19 <strong>and</strong> 20 for Morant Bay was 331.5 mm or 217% <strong>of</strong> <strong>the</strong><br />
normal expected for that station for <strong>the</strong> month <strong>of</strong> August. Norris also in St. Thomas followed<br />
with 24 hour rainfall amounts <strong>of</strong> 210 mm on <strong>the</strong> 19th. In St. Ca<strong>the</strong>rine, <strong>the</strong> two Bernard lodge<br />
stations (Blair Pen 251% <strong>and</strong> Phoenix Park 211%) reported in excess <strong>of</strong> 200% <strong>of</strong> normal rainfall<br />
6
expected for <strong>the</strong> month <strong>of</strong> August. O<strong>the</strong>r stations reporting in excess <strong>of</strong> 100% <strong>of</strong> normal rainfall<br />
were: Kingston & St. Andrew; Norman Manley International Airport (130.2 mm or 161% <strong>of</strong> <strong>the</strong><br />
normal for August); New Yarmouth in Clarendon 158% <strong>and</strong> Monymusk in Clarendon 117%.<br />
Windsor Park in St. Ca<strong>the</strong>rine received (127%) <strong>of</strong> normal rainfall expected for <strong>the</strong> month <strong>of</strong><br />
August.<br />
The maximum 24 hour rainfall amounts associated with <strong>the</strong> passage <strong>of</strong> Hurricane Dean was 133.4<br />
mm (see Appendix 4). In general, no significant flooding was associated with <strong>the</strong> passage <strong>of</strong><br />
Hurricane Dean. This may be attributed to <strong>the</strong> fact that Hurricane Dean was traveling quite<br />
quickly as it moved <strong>of</strong>fshore <strong>the</strong> south coast. Some level <strong>of</strong> flooding was, however, reported in<br />
eastern parishes which had possible saturated ground conditions resulting from heavy rainfall <strong>the</strong><br />
previous week.<br />
2. Emergency Actions<br />
In preparation for Hurricane Dean a fully functional National Emergency Operations Centre<br />
(NEOC) was activated on August 19 <strong>and</strong> a m<strong>and</strong>atory evacuation order was issued for some 25<br />
coastal <strong>and</strong> flood prone communities in Portmore <strong>and</strong> Nightingale Grove in St Ca<strong>the</strong>rine, Bull<br />
Bay St. Andrew, Seaforth <strong>and</strong> Bath in St. Thomas, <strong>and</strong> Port Royal in Kingston. In response to<br />
<strong>the</strong> <strong>impact</strong> <strong>of</strong> <strong>the</strong> event, <strong>the</strong> Office <strong>of</strong> Disaster Preparedness <strong>and</strong> Emergency Management<br />
(ODPEM) carried out several emergency activities. Within 12 hours <strong>of</strong> <strong>the</strong> event, two rapid<br />
aerial reconnaissance flights were undertaken primarily along <strong>the</strong> sou<strong>the</strong>rn parishes <strong>of</strong> <strong>the</strong> isl<strong>and</strong>.<br />
These flights covered <strong>the</strong> parishes <strong>of</strong> Westmorel<strong>and</strong>, St. Elizabeth, Manchester, Clarendon, St.<br />
Ca<strong>the</strong>rine, Kingston & St. Andrew, St. Thomas, Portl<strong>and</strong> <strong>and</strong> St. Mary. Within three days <strong>of</strong> <strong>the</strong><br />
event 12 damage <strong>assessment</strong> field visits were conducted by <strong>the</strong> ODPEM in <strong>the</strong> parishes <strong>of</strong> St.<br />
Ca<strong>the</strong>rine, Clarendon, Manchester, St Elizabeth <strong>and</strong> Kingston <strong>and</strong> St. Andrew. Food drops were<br />
also made to 10 marooned communities (Westphalia, Halls Delight, Hagley’s Gap, Penlyne<br />
Castle, Tower Hill, Lime Tree, Big Tree Pear, Somerset, River Head <strong>and</strong> St. Peter) <strong>and</strong> water<br />
tanks <strong>and</strong> stations set up in affected communities like Portl<strong>and</strong> Cottage, Old Harbour <strong>and</strong> Old<br />
Harbour Bay.<br />
At <strong>the</strong> peak <strong>of</strong> <strong>the</strong> event a total <strong>of</strong> 213 shelters were opened across all parishes housing 5,169<br />
persons (Table 1.1). The parishes with <strong>the</strong> highest number <strong>of</strong> persons in shelters were Portl<strong>and</strong>,<br />
7
Kingston <strong>and</strong> St. Andrew <strong>and</strong> St. James with 914; 714; <strong>and</strong> 555 persons respectively. By August<br />
24, 5 days after <strong>the</strong> event, 1 293 persons remained in 58 shelters in 9 parishes, down from <strong>the</strong> 6<br />
445 persons in 268 shelters in <strong>the</strong> days immediately following <strong>the</strong> event.<br />
Table 1.1: Number <strong>of</strong> Persons in Shelters, August 19,2007<br />
PARISH NO. OF<br />
SHELTERS<br />
NO. OF<br />
PERSONS<br />
Trelawny 19 451<br />
St. Thomas 14 264<br />
St. Mary 5 68<br />
St. James 22 555<br />
St. Ca<strong>the</strong>rine 16 394<br />
St. Ann 19 461<br />
Portl<strong>and</strong> 31 914<br />
Manchester 21 90<br />
KSA 21 714<br />
Hanover 17 268<br />
Clarendon 11 415<br />
Westmorel<strong>and</strong> 8 352<br />
St. Elizabeth 9 223<br />
TOTAL 213 5169<br />
Source: ODPEM<br />
The emergency distribution <strong>of</strong> critical relief supplies commenced <strong>the</strong> day after <strong>the</strong> event <strong>and</strong> was<br />
undertaken through <strong>the</strong> combined efforts <strong>of</strong> <strong>the</strong> ODPEM, MLSS, Local Authorities <strong>and</strong> o<strong>the</strong>r<br />
volunteer organisations. The National Welfare Sub-committee established 30 registration<br />
centres in Kingston & St. Andrew for persons who were severely <strong>impact</strong>ed by <strong>the</strong> event. At<br />
August 25, a total <strong>of</strong> 13 026 relief items were distributed isl<strong>and</strong>wide. These included foam pads,<br />
collapsible water containers, plastic plates, forks, spoons, rain coats, plastic sheeting, canned<br />
food, hygiene kits, adult blankets, tarpaulins, lanterns, bottled water, <strong>and</strong> flash lights. The cost <strong>of</strong><br />
emergency activities coordinated <strong>and</strong> executed by <strong>the</strong> ODPEM was estimated at $ 4.8 million. 1<br />
The Government <strong>of</strong> Jamaica’s relief assistance took <strong>the</strong> form <strong>of</strong> two special hurricane relief<br />
benefits package amounting to some $580 million dollars. Over 90 000 households registered<br />
under <strong>the</strong> Programme for Advancement Through Health <strong>and</strong> Education (PATH) 2 received cash<br />
grants valued at $2 000 each, while some 75,000 National Insurance Scheme (NIS) pensioners<br />
1 This figure does not include Jamaica Defense Force (JDF) activities <strong>and</strong> parish level recovery activities.<br />
2 PATH is a programme funded by <strong>the</strong> Government <strong>of</strong> Jamaica <strong>and</strong> <strong>the</strong> World Bank, aimed at delivering benefits by<br />
8
<strong>and</strong> elderly received a special payment <strong>of</strong> $5 000.<br />
3. International Assistance<br />
In <strong>the</strong> period immediately following <strong>the</strong> event, contributions in cash <strong>and</strong> kind from <strong>the</strong> regional<br />
<strong>and</strong> international community as well as <strong>the</strong> International Development Partners (IDPs), totaled<br />
an estimated US$1.4 million. These resources were mainly channeled through government<br />
agencies <strong>and</strong> non-governmental organizations.<br />
For <strong>the</strong> recovery <strong>and</strong> reconstruction phase, approximately US$5.9 million in cash <strong>and</strong> kind have<br />
been donated <strong>and</strong> pledged by several countries, international donors as well as <strong>the</strong> private sector.<br />
Fur<strong>the</strong>r discussions will be conducted between <strong>the</strong> Government <strong>of</strong> Jamaica <strong>and</strong> <strong>the</strong> IDPs<br />
regarding loans <strong>and</strong> grants which can be accessed to facilitate <strong>the</strong> recovery <strong>and</strong> reconstruction<br />
efforts over <strong>the</strong> short to medium term.<br />
4. Affected Population<br />
The projected population when Hurricane Dean struck <strong>the</strong> isl<strong>and</strong> on August 19 was 2.68 million.<br />
Approximately 6.7 per cent <strong>of</strong> <strong>the</strong> total population or some 179 552 persons 3 from 169<br />
communities were directly affected by <strong>the</strong> natural disaster. Table 1.2 <strong>and</strong> Figure 1.6 indicate that<br />
<strong>the</strong> most severely <strong>impact</strong>ed parishes <strong>and</strong> communities were:<br />
1 Kingston & St. Andrew - Bull Bay, Caribbean Terrace,<br />
2 St. Ca<strong>the</strong>rine - Old Harbour Bay,<br />
3 Clarendon - Rocky Point <strong>and</strong> Portl<strong>and</strong> Cottage.<br />
4 St Elizabeth – Sou<strong>the</strong>rn belt<br />
5 Manchester – Sou<strong>the</strong>rn sections including Cross Keys, Prattville <strong>and</strong> Alligator Pond<br />
6 St. Thomas<br />
way <strong>of</strong> cash grants to <strong>the</strong> most needy persons in <strong>the</strong> society<br />
3 Calculations based on number <strong>of</strong> households assessed by MLSS as at October 8, 2007<br />
9
Table 1.2: Jamaica: Estimated Population Affected by Hurricane Dean<br />
End <strong>of</strong><br />
Year<br />
Population<br />
2003<br />
% End <strong>of</strong><br />
Year<br />
Population<br />
2004<br />
% End <strong>of</strong><br />
Year<br />
Population<br />
2005<br />
% End <strong>of</strong><br />
Year<br />
Population<br />
2006<br />
% Projected<br />
Population<br />
At <strong>the</strong><br />
time <strong>of</strong><br />
Hurricane<br />
Dean<br />
(August<br />
19, 2007)<br />
Estimated<br />
Population<br />
Affected<br />
during<br />
Hurricane<br />
Dean<br />
Jamaica 2,635,673 100.0 2,648,224 100.0 2,660,723 100.0 2,673,815 100.0 2,682,278 179,552<br />
Kingston <strong>and</strong><br />
St. Andrew<br />
653,379 24.8 656,062 24.8 658,759 24.8 661,594 24.7 663,688 30,624<br />
St. Thomas 92,587 3.5 92,917 3.5 93,243 3.5 93,596 3.5 93,892 21,049<br />
Portl<strong>and</strong> 80,866 3.0 81,131 3.1 81,393 3.1 81,678 3.1 81,936 7,730<br />
St. Mary 112,614 4.3 112,909 4.3 113,204 4.2 113,529 4.3 113,888 6,925<br />
St. Ann 169,477 6.4 170,382 6.5 171,282 6.4 172,220 6.4 172,765 2,136<br />
Trelawny 74,163 2.8 74,347 2.8 74,713 2.8 75,097 2.8 75,335 1,450<br />
St. James 179,657 6.8 180,350 6.8 181,728 6.8 183,142 6.8 183,722 4,333<br />
Hanover 68,302 2.6 68,528 2.5 68,978 2.6 69,445 2.6 69,665 1,146<br />
Westmorel<strong>and</strong> 141,666 5.4 142,127 5.4 143,042 5.4 143,990 5.4 144,446 776<br />
St. Elizabeth 148,354 5.6 148,693 5.5 149,368 5.6 150,081 5.6 150,556 13,512<br />
Manchester 187,875 7.1 188,215 7.3 188,885 7.1 189,605 7.1 190,205 16,001<br />
Clarendon 241,792 9.2 242,389 9.1 243,575 9.2 244,820 9.2 245,595 50,425<br />
St. Ca<strong>the</strong>rine 488,979 18.5 490,174 18.4 492,551 18.5 495,018 18.5 496,585 23,445<br />
Source: Demographic Statistics 2006<br />
Note: Population Projection by <strong>the</strong> Social Policy, Planning <strong>and</strong> Research Division, PIOJ.<br />
Estimated population affected during Hurricane Dean was calculated using <strong>the</strong> Mean Household Size by Parish, Jamaica<br />
Survey <strong>of</strong> Living Conditions, Parish Report 2002.<br />
Up to seven days after <strong>the</strong> event 11 communities in <strong>the</strong> parishes <strong>of</strong> St. Thomas <strong>and</strong> Kingston <strong>and</strong><br />
St. Andrew were still marooned. Figures 1.6 show <strong>the</strong> location <strong>of</strong> affected communities.<br />
10
Figure1.6: Hurricane Dean Affected Communities<br />
Source: ODPEM<br />
As at September 30, <strong>the</strong> cost <strong>of</strong> insurance claims for damage caused by Hurricane Dean was<br />
estimated at $2215.98 million 4 . Of a total <strong>of</strong> 2733 claims, 1550 were related to housing <strong>and</strong><br />
personal effects, 1002 to business properties <strong>and</strong> 181 to motor vehicles. (See Table 1.3)<br />
Table 1.3 : Insurance Claims for Damage caused by Hurricane Dean<br />
Type <strong>of</strong> Claim Cost ($ million) Number <strong>of</strong> Claims<br />
Personal Lines 837.78 1550<br />
Commercial Lines 1,368.20 1002<br />
O<strong>the</strong>r Lines (Motor) 10.00 181<br />
Total 2,215.98 2733<br />
Source: Insurance Association <strong>of</strong> Jamaica<br />
4 Estimate based on responses from 11 general insurance companies.<br />
11
5.0 Impact on livelihoods <strong>and</strong> women <strong>and</strong> children<br />
The farming community was among <strong>the</strong> most severely affected by <strong>the</strong> hurricane given <strong>the</strong><br />
geographical location <strong>of</strong> greatest <strong>impact</strong> as well as <strong>the</strong> overall <strong>impact</strong> on <strong>the</strong> agriculture sector. It<br />
is estimated that in <strong>the</strong> banana industry, <strong>the</strong> livelihoods <strong>of</strong> over 3 000 persons were directly<br />
affected while an additional 8 000 persons including shopkeepers, processors, truckers etc. had<br />
<strong>the</strong>ir income disrupted. A total <strong>of</strong> 810 growers who supply <strong>the</strong> domestic <strong>and</strong> export markets<br />
were also affected.<br />
Overall, 56 537 food crop farmers <strong>and</strong> 7 170 livestock farmers were negatively affected by<br />
Hurricane Dean. The data suggest that many <strong>of</strong> <strong>the</strong>se farmers had small holdings (Table 1.4).<br />
The <strong>impact</strong> on vegetable farmers, at about 20 per cent <strong>of</strong> <strong>the</strong> overall losses in domestic<br />
agriculture, was significant <strong>and</strong> was particularly noticeable in Clarendon, Manchester <strong>and</strong> St.<br />
Elizabeth. In <strong>the</strong>se parishes some 20 000 vegetable farmers lost 850 hectares 5 <strong>of</strong> <strong>the</strong> 1314<br />
hectares <strong>of</strong> vegetables <strong>and</strong> pulses damaged. Livestock farmers in <strong>the</strong>se three parishes also<br />
suffered relatively heavy losses especially with respect to poultry where <strong>the</strong>y accounted for some<br />
60 percent <strong>of</strong> <strong>the</strong> number <strong>of</strong> birds lost.<br />
Table 1.4: Number <strong>of</strong> Farmers Affected <strong>and</strong> Value <strong>of</strong> Losses by Parish<br />
PARISH Affected Value Affected Value ($)M<br />
Farmers ($)M Farmers<br />
(Food Crop)<br />
(Livestock)<br />
St. Ca<strong>the</strong>rine 5000 23.10 500 9.00<br />
St. Andrew 3000 74.00 360 1.95<br />
Portl<strong>and</strong> 3358 99.60 125 2.15<br />
St. Ann 4200 64.85 300 2.14<br />
St. Mary 4850 71.63 300 0.77<br />
St. Thomas 6000 46.00 670 7.36<br />
Clarendon 8000 104.99 2000 18.13<br />
St. Elizabeth 5179 60.50 1313 21.94<br />
Manchester 6678 153.00 1295 5.00<br />
Hanover 1100 46.60 80 2.09<br />
Trelawny 4680 66.50 30 2.00<br />
St. James 2820 71.60 37 0.60<br />
Westmorel<strong>and</strong> 1672 22.00 160 1.38<br />
Total 56537 904.37 7170 74.50<br />
Source: RADA<br />
12
In <strong>the</strong> fishing industry, approximately 3 500 marine fisher folk, mainly on <strong>the</strong> south coast, were<br />
directly <strong>impact</strong>ed as <strong>the</strong>y lost fishing equipment including nets <strong>and</strong> traps. Assuming that each<br />
fisher supplies an average <strong>of</strong> two vendors, <strong>the</strong> minimum indirect <strong>impact</strong> would be approximately<br />
7 000 persons. The extent <strong>of</strong> <strong>the</strong> <strong>impact</strong> for <strong>the</strong>se persons would have been worsened by <strong>the</strong><br />
length <strong>of</strong> <strong>the</strong> recovery period which itself was extended by <strong>the</strong> severe erosion <strong>of</strong> some fishing<br />
beaches <strong>and</strong> destruction <strong>of</strong> fishing villages. The income flow <strong>of</strong> <strong>the</strong>se persons would also have<br />
been disrupted by reduction in dem<strong>and</strong>, as electricity supplies were not restored to approximately<br />
one-third <strong>of</strong> customers up to seven days following <strong>the</strong> event. It is anticipated that <strong>the</strong> worst<br />
affected persons would require some 2 - 6 weeks before returning to <strong>the</strong>ir fishing activities. Men<br />
constitute <strong>the</strong> largest proportion <strong>of</strong> fishers <strong>and</strong> would <strong>the</strong>refore bear <strong>the</strong> greatest over-all burden<br />
<strong>of</strong> damage <strong>and</strong> loss in this industry. The gender <strong>impact</strong> was none<strong>the</strong>less severe for women who<br />
make up <strong>the</strong> largest portion <strong>of</strong> fish vendors.<br />
The main livelihood <strong>impact</strong> <strong>of</strong> <strong>the</strong> hurricane would have been on small farmers 6 , farm families<br />
<strong>and</strong> persons involved in related <strong>economic</strong> activities such as vending <strong>and</strong> shop keeping. The<br />
timing <strong>of</strong> <strong>the</strong> hurricane would have amplified <strong>the</strong> <strong>impact</strong>, particularly in farming communities as<br />
many families would have been preparing for back to school expenditure.<br />
Approximately 1,237 children plus <strong>the</strong>ir respective care givers were affected by damage to<br />
nineteen (19) residential Child Care Facilities, six (6) <strong>of</strong> which are Government facilities.<br />
6.0 Casualties<br />
The Ministry <strong>of</strong> Health has confirmed six (6) deaths due to Hurricane Dean, 4 males <strong>and</strong> 2<br />
females. Table 1.5 outlines that <strong>the</strong>re were four direct deaths resulting from falling concrete<br />
block, flying debris, wind effect <strong>and</strong> ro<strong>of</strong> collapse <strong>and</strong> two indirect deaths from electrocution.<br />
Hospital <strong>and</strong> sentinel surveillance sites reported 628 injuries between August 19 <strong>and</strong> 25 7 .<br />
5 Approximately two-thirds <strong>the</strong> total hectarage lost<br />
6 As in <strong>the</strong> case <strong>of</strong> fishing, most farmers are males but women are predominate with respect to <strong>the</strong> vending <strong>of</strong> farm<br />
produce<br />
7 A total <strong>of</strong> 213 injuries were reported for August 25, 2007. These may not be directly hurricane related but reflects<br />
injuries in <strong>the</strong> post hurricane period.<br />
13
Table 1.5: Summary <strong>of</strong> Confirmed Deaths Related to Hurricane Dean<br />
Parish Date <strong>of</strong> Sex Age Cause Remarks<br />
Death<br />
St. Thomas 8/19/2007 F 14 Head Injury Head Crushed by<br />
rock<br />
St. Elizabeth 8/19/2007 F 48 Abdominal Trauma Flying Debris<br />
Clarendon 8/19/2007 M 44 Crush Injury Ro<strong>of</strong> Collapsed<br />
Manchester 8/19/2007 M 34 Motor Vehicle Wind effect<br />
Accident<br />
St. Andrew 8/18/2007 M 34 Electrocuted Pruning a tree<br />
St. Ca<strong>the</strong>rine 8/23/2007 M ND Electrocuted Repairing JPS line<br />
Source: Ministry <strong>of</strong> Health<br />
ND: Not Determined<br />
14
II. SOCIAL SECTORS<br />
1. Education<br />
Damage to <strong>the</strong> education sector (public institutions) was significant. Preliminary reports from<br />
<strong>the</strong> Ministry <strong>of</strong> Education <strong>and</strong> Youth (MoEY) indicated that 518 primary <strong>and</strong> secondary schools<br />
<strong>and</strong> <strong>the</strong> Ministry’s <strong>of</strong>fices sustained damage estimated at $727.86 million. The damage was<br />
mostly to ro<strong>of</strong>s <strong>and</strong> structures. There was also damage to electrical equipment, sanitary facilities<br />
<strong>and</strong> fences. Numerically, <strong>the</strong> schools in sou<strong>the</strong>rn parishes accounted for <strong>the</strong> majority <strong>of</strong> <strong>the</strong><br />
damage with Kingston <strong>and</strong> St. Andrew (KSA) schools accounting for 14.7 per cent, St. Ca<strong>the</strong>rine<br />
11.78, Manchester 11.20 percent, Clarendon 10.23 per cent, <strong>and</strong> St. Elizabeth 9.65 per cent (see<br />
Figure 2.1). Since <strong>the</strong> hurricane occurred during <strong>the</strong> summer holidays, classes were not<br />
disrupted. Despite <strong>the</strong> damage sustained <strong>and</strong> <strong>the</strong> fact that many schools were used as shelters,<br />
most schools reopened on schedule for <strong>the</strong> beginning <strong>of</strong> <strong>the</strong> Christmas term.<br />
Table 2.1: Damage to Primary <strong>and</strong> Secondary Schools<br />
Parish<br />
No. <strong>of</strong><br />
Schools<br />
Total Estimated Cost<br />
(Million)<br />
KSA 76 113.18<br />
St. Thomas 25 38.13<br />
Portl<strong>and</strong> 26 11.97<br />
St. Mary 25 26.57<br />
St. Ann 51 48.07<br />
Trelawny 19 19.94<br />
St. James 32 53.81<br />
Hanover 21 10.65<br />
Westmorel<strong>and</strong> 21 13.25<br />
St. Elizabeth 50 136.49<br />
Manchester 58 166.98<br />
Clarendon 53 43.47<br />
St. Ca<strong>the</strong>rine 61 35.36<br />
Schools Equipment & MoEY<br />
10.00<br />
Offices<br />
Total 518 727.86<br />
Source: Ministry <strong>of</strong> Education <strong>and</strong> Youth<br />
15
The Early Childhood Commission (ECC) reported that a total <strong>of</strong> 179 basic schools were affected<br />
by Hurricane Dean. Thirteen (7%) were mildly damaged (e.g. leaking ro<strong>of</strong>,), 84 (47%) were<br />
moderately damaged (e.g. part <strong>of</strong> ro<strong>of</strong> damaged, bathroom or kitchen damaged) <strong>and</strong> 82 (46%)<br />
were severely damaged (ro<strong>of</strong> completely damaged).<br />
2. Housing<br />
As at September 14, approximately 54 percent <strong>of</strong> <strong>the</strong> estimated number <strong>of</strong> houses reportedly<br />
damaged had been assessed by <strong>the</strong> Ministry <strong>of</strong> Labour <strong>and</strong> Social Security (MLSS). Table 2.2<br />
shows <strong>the</strong> summary <strong>of</strong> <strong>the</strong> <strong>assessment</strong>s <strong>and</strong> <strong>the</strong> cost <strong>of</strong> <strong>the</strong> damage by parish. Most <strong>of</strong> <strong>the</strong><br />
<strong>assessment</strong>s were done in <strong>the</strong> sou<strong>the</strong>rn parishes, which were more severely affected by Hurricane<br />
Dean.<br />
Table 2.2: Summary <strong>of</strong> Damages to <strong>the</strong> Housing Sector<br />
PARISH<br />
Assessment<br />
# Assessed Minor<br />
Damage<br />
COST<br />
$<br />
Major<br />
Damage<br />
COST<br />
$<br />
Totally<br />
Destroyed<br />
COST<br />
$<br />
No<br />
Damage<br />
KSA 5746 2643 49952700 2682 506898000 342 258552000<br />
St. Thomas 4479 2679 50633100 1429 270081000 371 280476000<br />
Portl<strong>and</strong> 1505 764 14439600 641 121149000 100 75600000<br />
St. Mary 1486 664 12549600 758 143262000 74 55944000 17<br />
St. Ann 532 276 5216400 215 40635000 41 30996000<br />
Trelawny 346 75 1417500 244 46116000 27 20412000<br />
St. James 1146 659 12455100 347 65583000 40 30240000<br />
Hanover 358 155 2929500 169 31941000 34 25704000<br />
Westmorel<strong>and</strong> 203 97 1833300 93 17577000 13 9828000<br />
St. Elizabeth 2338 1367 25836300 896 169344000 75 56700000<br />
Manchester 3515 1591 30069900 1708 322812000 216 163296000<br />
Clarendon 10713 4243 80192700 5161 975429000 1327 1003212000<br />
St. Ca<strong>the</strong>rine 5759 2840 53676000 2307 436023000 612 462672000<br />
Total 38126 18053 341201700 16650 3146850000 3272 2473632000 17<br />
TOTAL<br />
DAMAGE<br />
Source: MLSS<br />
5961683700<br />
17
The total damage to <strong>the</strong> housing sector was estimated at $5,961.7 million, <strong>of</strong> which 41.5% were<br />
for totally destroyed structures, 52.8% for major damage <strong>and</strong> 5.72% for minor damage 8 . Areas<br />
with totally destroyed houses included were vulnerable areas such as Rocky Point <strong>and</strong> Portl<strong>and</strong><br />
Cottage in Clarendon, Old Harbour Bay St. Ca<strong>the</strong>rine <strong>and</strong> Manchioneal, Portl<strong>and</strong>.<br />
8 Based on <strong>the</strong> varying quality <strong>of</strong> housing, calculations were based on <strong>the</strong> following assumptions:<br />
1. A 12x18 feet starter house (concrete) is $3 500 per square foot totaling $756 000<br />
2. Repairing minor damage = 2.5% <strong>of</strong> <strong>the</strong> cost <strong>of</strong> <strong>the</strong> building<br />
3. Repairing major damage (an entire ro<strong>of</strong>) = 25% <strong>of</strong> <strong>the</strong> cost <strong>of</strong> <strong>the</strong> building<br />
18
3. Public Buildings<br />
a) Correctional Facilities & Police Stations<br />
Ro<strong>of</strong>, window <strong>and</strong> o<strong>the</strong>r structural damage were reported by 47 police stations in 11 parishes<br />
affected by flooding <strong>and</strong> wind damage. Stations most affected are shown in Table 2.3.<br />
Table 2.3: Stations Most affected by Hurricane Dean<br />
PARISH STATION TYPE OF DAMAGE<br />
St. Mary Highgate Extensively damaged<br />
Clarendon Exeter Ro<strong>of</strong> blown <strong>of</strong>f<br />
St. Elizabeth Malvern Major damage <strong>and</strong> flooding<br />
St. Ca<strong>the</strong>rine Shady Grove Ro<strong>of</strong> totally destroyed<br />
Major damage to building<br />
St. Ca<strong>the</strong>rine Old Harbour Bay Ro<strong>of</strong> totally destroyed<br />
St. Thomas Bath Ro<strong>of</strong> totally destroyed.<br />
Source: Jamaica Constabulary Force<br />
All <strong>the</strong> above stations had to be relocated. Damage was also sustained by some non-geographic<br />
sections <strong>of</strong> <strong>the</strong> Jamaica Constabulary Force (JCF) including <strong>the</strong> facilities <strong>of</strong> <strong>the</strong> Mounted Troop,<br />
Twickenham Park Training Estate, Community Relations <strong>and</strong> Traffic Headquarters which<br />
suffered flooding <strong>and</strong> major ro<strong>of</strong> damage.<br />
The Department <strong>of</strong> Correctional Services reported damage to 12 correctional institutions. Most<br />
facilities affected suffered damage to ro<strong>of</strong>s, fencing <strong>and</strong> windows. Six dormitories at <strong>the</strong><br />
Tamarind Farm Adult Correctional Facility sustained significant damage to ro<strong>of</strong>s. Total damage<br />
to correctional facilities has been estimated at $77.08 million.<br />
20
) Heritage Sites<br />
The National Heritage Trust reported damage to <strong>the</strong>ir headquarters <strong>and</strong> <strong>of</strong>fice in Roxborough,<br />
Kingston, as well as 12 <strong>of</strong> its heritage sites. The ro<strong>of</strong> <strong>of</strong> <strong>the</strong> Auxiliary building <strong>of</strong> <strong>the</strong> historic<br />
Naval Hospital was blown <strong>of</strong>f while 25 % <strong>of</strong> <strong>the</strong> brick wall <strong>of</strong> <strong>the</strong> historic Military Barracks in<br />
Spanish Town collapsed. Several windows <strong>of</strong> <strong>the</strong> historic Kings House in Spanish Town Square<br />
were also damaged. Damage to heritage sites <strong>and</strong> structures is estimated at $9.28 million.<br />
4. Health<br />
Damage <strong>and</strong> losses to <strong>the</strong> health sector totaled $298.53 million (Table 2.3). Damage to<br />
infrastructure (ro<strong>of</strong>s <strong>and</strong> structure) accounted for 62.23 per cent. However, 258 (84.9%) <strong>of</strong> <strong>the</strong><br />
304 health centres isl<strong>and</strong>wide were operational within a week <strong>of</strong> <strong>the</strong> passage <strong>of</strong> Hurricane Dean.<br />
Only one <strong>of</strong> <strong>the</strong> 25 hospitals isl<strong>and</strong>wide suffered damage to <strong>the</strong> extent that services were<br />
interrupted for up to five days after <strong>the</strong> event (Figure 2.3). As such, up to Sunday August 27,<br />
only partial services –in-patient <strong>and</strong> emergency services) were being <strong>of</strong>fered at <strong>the</strong> Lionel Town<br />
Hospital.<br />
Nineteen (19) residential Child Care Facilities were damaged with estimates <strong>of</strong> $78.8M. Six (6)<br />
<strong>of</strong> <strong>the</strong>se are Government facilities with estimates <strong>of</strong> $47.1M. The majority have sustained ro<strong>of</strong><br />
loss or damage.<br />
Direct damage, including hospitals <strong>and</strong> health centers, accounted for $ 218.35 million, <strong>of</strong> which<br />
85.08 per cent ($ 185.77 million) relate to partial damage or total destruction <strong>of</strong> infrastructure.<br />
Over 14 per cent <strong>of</strong> <strong>the</strong> direct costs were for <strong>the</strong> replacement <strong>of</strong> latrine facilities while 0.5 per<br />
cent was for loss <strong>of</strong> equipment, furniture, pharmaceuticals, sundries <strong>and</strong> supplies.<br />
The critical facilities for ro<strong>of</strong> <strong>and</strong> structural repairs are:<br />
1. National Public Health Laboratory – was undergoing work prior to <strong>the</strong> event<br />
2. Shalimar Stores (Main MOH stores)<br />
3. Ken Royes Rehabilitation Centre<br />
21
4. St. Ann’s Bay hospital – Main surgical ward<br />
5. Lionel Town hospital – Doctor’s quarters.<br />
6. Falmouth hospital – kitchen, linen <strong>and</strong> store room<br />
7. Savanna-la-Mar hospital – partial ro<strong>of</strong> damage<br />
8. Black River hospital – structural damage<br />
Table 2.3: Summary <strong>of</strong> Damage to <strong>the</strong> Health Sector<br />
Damage<br />
Total (J$) Direct (J$) Indirect (J$)<br />
Partial or total destruction <strong>of</strong><br />
infrastructure<br />
185,769,100.00 185,769,100.00 0.00<br />
Loss <strong>of</strong> equipment <strong>and</strong><br />
furniture<br />
3,700,000.00 1,200,000.00 2,500,000.00<br />
Loss <strong>of</strong> vaccines 0.00 0.00 0.00<br />
Loss / replacement <strong>of</strong><br />
pharmaceuticals, sundries 14,700,000.00 200,000.00 14,500,000.00<br />
<strong>and</strong> supplies<br />
Vector Control 13,700,000.00 0.00 13,700,000.00<br />
Water Quality Monitoring 1,500,000.00 0.00 1,500,000.00<br />
Environmental Health<br />
Sanitation<br />
645,000.00 0.00 645,000.00<br />
Latrine Replacement 31,180,000.00 31,180,000.00<br />
Health Education<br />
Programme<br />
11,583,733.00 0.00 11,583,733.00<br />
Epidemiological/Shelter<br />
Surveillance<br />
5,250,000.00 0.00 5,250,000.00<br />
Vehicles 25,000,000.00 0.00 25,000,000.00<br />
MOH Emergency Operations<br />
Centre<br />
5,500,000.00 0.00 5,500,000.00<br />
Total 298,527,833.00 218,349,100.00 80,178,733.00<br />
Source: Emergency, Disaster Management <strong>and</strong> Special Services Branch, MOH September 14, 2007<br />
Indirect losses to <strong>the</strong> health sector amounted to $80.18 million (26.86% <strong>of</strong> total damage <strong>and</strong> losses),<br />
which could be attributable to <strong>the</strong> response <strong>of</strong> <strong>the</strong> health sector to <strong>the</strong> challenges brought on by<br />
<strong>the</strong> passing <strong>of</strong> Hurricane Dean. Special health education programmes had to be mounted in order<br />
to increase knowledge <strong>of</strong> water safety; proper personal hygiene; food safety; mosquito, fly <strong>and</strong><br />
rodent control; <strong>and</strong> <strong>the</strong> prevention <strong>of</strong> disease outbreaks such as malaria <strong>and</strong> leptospirosis.<br />
23
Environmental Health<br />
In <strong>the</strong> area <strong>of</strong> <strong>environmental</strong> health focus was placed on <strong>the</strong> priority areas <strong>of</strong> water quality<br />
control monitoring, food safety, vector control <strong>and</strong> <strong>environmental</strong> sanitation. Monitoring<br />
continued at water supply points, treatment plants <strong>and</strong> at distribution points with water quality<br />
improving as electricity returned to plants <strong>and</strong> turbidity improved. Up to ten days after <strong>the</strong> event<br />
food safety inspections led to 90,000 kg <strong>of</strong> meat, 8,300 kg <strong>of</strong> ice cream, 300 kg milk <strong>and</strong> 220kg<br />
<strong>of</strong> patties being seized <strong>and</strong> condemned isl<strong>and</strong>wide.<br />
Comprehensive programmes for mosquitoes, flies <strong>and</strong> rodents were implemented in all parishes,<br />
focusing on <strong>the</strong> worst affected areas. Source reduction, larvicidal work (oiling <strong>and</strong> placement <strong>of</strong><br />
larvicidal agents <strong>and</strong> fish in pools <strong>of</strong> water) <strong>and</strong> fogging were <strong>the</strong> priorities.<br />
Environmental Sanitation: A total <strong>of</strong> 328 latrines were destroyed <strong>and</strong> thirty one (31) damaged<br />
in five (5) parishes. All 359 will need to be replaced. In addition accumulation <strong>of</strong> solid waste<br />
isl<strong>and</strong>wide required special interventions in collaboration with <strong>the</strong> NSWMA to prevent <strong>the</strong><br />
breeding <strong>of</strong> vectors.<br />
Veterinary Public Health: After <strong>the</strong> event, <strong>the</strong> Health Departments were required to dispose<br />
<strong>of</strong>/monitor <strong>the</strong> disposal <strong>of</strong> dead animals <strong>and</strong> over 50,000 birds in <strong>the</strong> parishes <strong>of</strong> Kingston, St.<br />
Andrew <strong>and</strong> St. Ca<strong>the</strong>rine.<br />
Special Service Delivery: The delivery <strong>of</strong> special services such as blood transfusion <strong>and</strong> public<br />
health laboratory services were generally uninterrupted although only partial services were being<br />
<strong>of</strong>fered at <strong>the</strong> Government Chemist facilities due to insufficient power supply.<br />
24
III. PRODUCTIVE SECTORS<br />
Damage <strong>and</strong> losses to <strong>the</strong> agricultural sector was estimated at $3.715 billion. Table 3.1<br />
summarizes <strong>the</strong> damage.<br />
Table 3.1: Estimate <strong>of</strong> Direct Damage to <strong>the</strong> Agricultural Sector<br />
Activity<br />
Estimate <strong>of</strong> Damage ($ million)<br />
Domestic Crop 904.37<br />
C<strong>of</strong>fee 761.45<br />
Sugar 802.00<br />
Banana 525.00<br />
Fisheries 310.00<br />
Citrus 116.00<br />
Cocoa 100.00<br />
Livestock 74.50<br />
Greenhouse/Protected Cultivation 52.47<br />
Irrigation 17.20<br />
Total $3,715.99<br />
Source: Ministry <strong>of</strong> Agriculture <strong>and</strong> L<strong>and</strong>s (MOAL)<br />
The major areas <strong>of</strong> devastation were domestic crop production, which suffered losses <strong>of</strong> just over<br />
$900 million <strong>and</strong> c<strong>of</strong>fee, sugar <strong>and</strong> banana with $855, $761.45 <strong>and</strong> $525 million respectively.<br />
Approximately 80 per cent <strong>of</strong> <strong>the</strong> isl<strong>and</strong>’s greenhouses were destroyed. The marine <strong>and</strong> aqua<br />
culture sub sector, experienced damage estimated at $310 million with capture representing $250<br />
million while aqua culture accounted for $60 million. The approximate number <strong>of</strong> fisher folk<br />
affected was 3,523 <strong>and</strong> estimated losses due to disruption <strong>of</strong> activities were $75.6 million.<br />
1. Domestic Crop & Livestock Sub Sector<br />
Preliminary figures from <strong>the</strong> Rural Agricultural Development Authority (RADA) revealed that<br />
domestic crops 9 <strong>and</strong> livestock 10 sustained considerable losses, totalling just over $1.0 billion.<br />
9 Domestic crop includes only those crops identified in Table 2, which would have been consumed locally <strong>and</strong><br />
25
Losses to <strong>the</strong> livestock sector amounted to $73.45 million, while greenhouse cultivation <strong>and</strong> <strong>the</strong><br />
domestic crop sub sector suffered losses <strong>of</strong> approximately $52.47 million <strong>and</strong> $904.37 million<br />
respectively.<br />
The areas most <strong>impact</strong>ed by <strong>the</strong> passage <strong>of</strong> <strong>the</strong> hurricane were concentrated mainly to <strong>the</strong><br />
sou<strong>the</strong>rn <strong>and</strong> easterly sections <strong>of</strong> <strong>the</strong> isl<strong>and</strong>. Damage sustained in <strong>the</strong>se areas to crops <strong>and</strong><br />
livestock were reportedly due to <strong>the</strong> effects <strong>of</strong> gusty winds in excess <strong>of</strong> one hundred miles per<br />
hour, ra<strong>the</strong>r than from flooding. The four most adversely affected parishes were Manchester,<br />
Clarendon, St. Elizabeth <strong>and</strong> Portl<strong>and</strong>; where a significant portion <strong>of</strong> <strong>the</strong> country’s agricultural<br />
activity takes place. In total, <strong>the</strong>se parishes accounted for approximately, 50 percent or $517.7<br />
million <strong>of</strong> <strong>the</strong> total losses to <strong>the</strong> sector.<br />
Manchester suffered <strong>the</strong> greatest estimated losses, amounting to $203 million. In this parish, <strong>the</strong><br />
domestic crop sub sector lost approximately $153 million worth <strong>of</strong> production. The majority <strong>of</strong><br />
<strong>the</strong> damage sustained to <strong>the</strong> isl<strong>and</strong>’s greenhouses was concentrated in this parish, at an estimated<br />
cost <strong>of</strong> $45 million.<br />
A loss to <strong>the</strong> livestock sector while relatively low, in comparison to that <strong>of</strong> domestic crop<br />
production, was estimated at $40 million. These losses are significant <strong>and</strong> should not be<br />
underestimated, as this industry contributes significantly to <strong>the</strong> livelihoods <strong>of</strong> many small<br />
farmers in <strong>the</strong>se areas.<br />
The cost <strong>of</strong> damage was greatest in Hanover <strong>and</strong> St. Thomas which in both cases accounted for<br />
approximately 5.0 per cent. Losses to <strong>the</strong>se four parishes amounted to approximately $160<br />
million. The least affected parishes were Westmorel<strong>and</strong> <strong>and</strong> St. Ca<strong>the</strong>rine which accounted for<br />
2.0 <strong>and</strong> 3.0 per cent <strong>of</strong> total losses respectively.<br />
Table 3.2 <strong>and</strong> Figure 3.1 below give an empirical breakdown <strong>of</strong> <strong>the</strong> figures used to arrive at <strong>the</strong>se<br />
preliminary estimates.<br />
excludes major exportable crops such as c<strong>of</strong>fee, pimento, banana for export etc as collated by RADA.<br />
10 Livestock here refers to poultry, pond fish, fingerlings, goats, sheep, beef cattle, dairy cows, pigs <strong>and</strong> o<strong>the</strong>r<br />
miscellaneous livestock as collated by RADA.<br />
26
Table 3.2: Preliminary Estimates <strong>of</strong> Damage from Hurricane Dean by Parish<br />
Parish<br />
Livestock<br />
$ million<br />
Domestic Crops<br />
$ million<br />
Greenhouse<br />
$ million<br />
Total Damage<br />
$ million<br />
Manchester 5.0 153 45 203<br />
Clarendon 18.125 104.9 6.27 129.295<br />
Portl<strong>and</strong> 2.15 99.6 - 101.75<br />
St. Elizabeth 21.94 60.5 1.2 83.64<br />
St. Andrew 1.95 74 - 75.95<br />
St. James 2 71.6 - 73.6<br />
St. Mary 0.765 71.633 - 72.398<br />
Trelawny 0.6 66.5 - 67.1<br />
At. Ann 2.14 64.85 - 66.99<br />
St. Thomas 7.36 46.6 - 53.96<br />
Hanover 2.09 46.6 - 48.69<br />
St. Ca<strong>the</strong>rine 7.95 23.1 - 31.05<br />
Westmorl<strong>and</strong> 1.38 22 - 23.38<br />
Total 73.45 904.883 52.47 1030.803<br />
Source: RADA<br />
Figure 3.1: Preliminary Estimate <strong>of</strong> Damage from Hurricane Dean to <strong>the</strong> Agriculture Sector by<br />
Parish ($ million)<br />
250<br />
200<br />
203<br />
J$ millions<br />
150<br />
100<br />
83.64<br />
129.295<br />
75.95<br />
101.75<br />
72.398<br />
66.99 67.1<br />
73.6<br />
50<br />
23.38<br />
31.05<br />
53.96<br />
48.69<br />
0<br />
Westmorl<strong>and</strong><br />
St. Elizabeth<br />
Manchester<br />
Clarendon<br />
St. Car<strong>the</strong>rine<br />
St. Andrew<br />
St. Thomas<br />
Portl<strong>and</strong><br />
St. Mary<br />
At. Ann<br />
Trelawny<br />
St. James<br />
Hanover<br />
Parish<br />
Source: RADA<br />
27
Estimates reveal that approximately 5,354 hectares <strong>of</strong> arable produce have been lost. It is also<br />
evident that <strong>the</strong> <strong>impact</strong> <strong>of</strong> <strong>the</strong> hurricane will adversely affect <strong>the</strong> isl<strong>and</strong>’s ability to produce roots<br />
<strong>and</strong> tubers in <strong>the</strong> short term. The estimates suggest that 1,514 hectares <strong>of</strong> roots <strong>and</strong> tubers have<br />
been destroyed representing approximately 28 percent <strong>of</strong> <strong>the</strong> total damage to <strong>the</strong> domestic crop<br />
production. The o<strong>the</strong>r sub groupings that were adversely affected include bananas (domestic<br />
market), vegetables <strong>and</strong> plantains. Toge<strong>the</strong>r <strong>the</strong>y account for less than 50 percent (2,596<br />
hectares) <strong>of</strong> <strong>the</strong> damage suffered to domestic crop production.<br />
Table 3.3 <strong>and</strong> Figure 3.2 below illustrate <strong>the</strong> damage to <strong>the</strong> sector based on hectare damage for<br />
various domestic crops in each parish. It is important to note here that increased damage per<br />
hectare does not necessarily equate to higher financial losses as this is a function <strong>of</strong> o<strong>the</strong>r<br />
variables, unique for each commodity produced in a particular area.<br />
Table 3.3: Preliminary Estimates <strong>of</strong> Hectare Damage by Parish<br />
Parish Legumes Cereal Vegetables Condiments Fruits FTC a Banana<br />
(domestic<br />
market)<br />
Plantain<br />
Roots <strong>and</strong><br />
Tubers<br />
Manchester 70 290 100 15 415 890<br />
St. Elizabeth 130 45 200 125 110 2 4 6 110 732<br />
Trelawny 30 25 25 50 50 490 670<br />
St. James 25 15 30 45 20 16 300 120 40 611<br />
Portl<strong>and</strong> 10 20 15 20 250 120 125 560<br />
St. Thomas 40 2 45 31 20 130 35 80 383<br />
St. Mary 11 30 10 22 150 100 55 378<br />
Clarendon 48 18 112 55 4 20 20 63 340<br />
St. Andrew 15 7 20 10 2 80 20 140 30 324<br />
Hanover 5 3 30 10 12 9 8 62 30 169<br />
St. Ann 4 28 52 16 2 63 165<br />
Westmorl<strong>and</strong> 10 1 55 15 10 5 10 25 131<br />
St. Ca<strong>the</strong>rine 10 32 14 1 15 15 13 100<br />
Total 368 129 946 446 263 137 957 11 693 12 1514 5453<br />
Source: RADA<br />
Note a) FTC (Fruit Tree Crops)<br />
Total<br />
11 These figures will vary from those <strong>of</strong> Banana Export Company (BECO) as <strong>the</strong> BECO figures include only those<br />
banana growers in <strong>the</strong> European Union Banana Support Programme (EUBSP) target parishes, whilst RADA’s<br />
figures include all banana growing farmers.<br />
12 These figures will vary from those <strong>of</strong> BECO as <strong>the</strong> BECO figures include only those plantain growers in <strong>the</strong><br />
EUBSP target parishes, whilst RADA’s figures include all plantain growing farmers.<br />
28
Figure 3.3: Total Hectare Damage per Parish<br />
1000<br />
900<br />
89 0<br />
800<br />
73 2<br />
700<br />
670<br />
600<br />
56 0<br />
61 1<br />
Hectares<br />
500<br />
400<br />
34 0<br />
32 4<br />
38 3<br />
378<br />
300<br />
200<br />
100<br />
13 1<br />
10 0<br />
16 5<br />
169<br />
0<br />
Westm orl<strong>and</strong><br />
St. Elizabeth<br />
Manchester<br />
C laren don<br />
St. Cath erine<br />
St. Andrew<br />
St. Thom as<br />
Portl<strong>and</strong><br />
St. Mary<br />
St. Ann<br />
Trela wny<br />
St. Jam es<br />
Hanover<br />
P ari sh<br />
Source: RADA<br />
2. The Cocoa Industry<br />
The cocoa sub-sector suffered severe damage particularly in Clarendon, St. Mary, St. Ca<strong>the</strong>rine<br />
<strong>and</strong> St. Thomas. The Cocoa Industry Board (CIB) revealed that approximately 9,000 hectares <strong>of</strong><br />
cocoa was under production prior to <strong>the</strong> passage <strong>of</strong> <strong>the</strong> hurricane. The preliminary estimates<br />
indicate that approximately 50 percent <strong>of</strong> this total suffered damage. Projected output prior to<br />
<strong>the</strong> hurricane was 850-1000 tonnes (or 85,000-180,000 boxes). The revised projection is 425-500<br />
tonnes. The fall crop, which runs from October to March <strong>and</strong> was valued at J $90-$100 million,<br />
has been totally wiped out.<br />
3. The Citrus Industry<br />
In <strong>the</strong> Eastern Area Council (Portl<strong>and</strong>, St. Mary) grapefruit <strong>and</strong> orange farmers sustained many<br />
losses. In Portl<strong>and</strong>, 75 per cent <strong>of</strong> <strong>the</strong> grapefruit crop was destroyed while 70 per cent <strong>of</strong> <strong>the</strong><br />
orange crop suffered a similar fate. In St. Mary grapefruit <strong>and</strong> orange crops suffered 30 per cent<br />
<strong>and</strong> 20 per cent damage respectively. See Table 3.4<br />
30
Table 3.4: Preliminary Estimates <strong>of</strong> Impact on <strong>the</strong> Citrus Industry by Parish<br />
Parish Type <strong>of</strong> Citrus % loss Remarks<br />
Portl<strong>and</strong> Grapefruit<br />
Orange<br />
75<br />
70<br />
St. Mary Grapefruit<br />
Orange<br />
50<br />
25<br />
In Portl<strong>and</strong> <strong>and</strong> St. Mary major loss <strong>of</strong> fruit resulted<br />
from early maturing fruits falling <strong>of</strong>f significantly<br />
St. Ca<strong>the</strong>rine Grapefruit<br />
5<br />
There was minimal fruit loss as a result <strong>of</strong> <strong>the</strong><br />
hurricane<br />
Oranges<br />
2 ½ - 3<br />
St. Ann<br />
Grapefruit<br />
5<br />
No significant damage or fruit loss<br />
Clarendon<br />
Westmorel<strong>and</strong><br />
Orange<br />
Grapefruit<br />
Oranges<br />
Oranges<br />
2<br />
25 -30<br />
4 – 6<br />
5<br />
Damage or fruit loss occurred mainly in <strong>the</strong> hilly<br />
terrains <strong>of</strong> Clarendon. There was minor damage in<br />
<strong>the</strong> low lying areas<br />
There was minimal loss <strong>of</strong> fruit in <strong>the</strong>se parishes<br />
Hanover<br />
Oranges<br />
1 -2<br />
St. James<br />
Grapefruit<br />
Oranges<br />
10<br />
5<br />
St. Elizabeth<br />
Orange<br />
10 -15<br />
There was moderate fruit fall significant damage to<br />
trees throughout St. Elizabeth<br />
Manchester<br />
Source: RADA<br />
Grapefruit<br />
Orange<br />
Grapefruit<br />
20 – 25<br />
15<br />
60<br />
Significant damage to fruit loss throughout St.<br />
Elizabeth<br />
There was severe damage <strong>and</strong> loss <strong>of</strong> fruit<br />
particularly to grapefruit in Manchester.<br />
However, trees were not toppled over.<br />
The preliminary estimate <strong>of</strong> damage to <strong>the</strong> sector is $116 million. Grapefruits suffered a 22% to<br />
25% loss in national yields as result <strong>of</strong> damage to fruit trees. The loss in yields for oranges <strong>and</strong><br />
ortaniques is between 7% <strong>and</strong> 10% <strong>of</strong> <strong>the</strong> national level. The Ugli fruit crop (which is largely<br />
concentrated in upper Clarendon <strong>and</strong> Trelawny) suffered minimal damage (Table 3.5).<br />
31
Table 3.5: Fruit Loss as a Percentage <strong>of</strong> National Production<br />
Parish<br />
Fruit loss/Parish as<br />
observed<br />
%<br />
Portl<strong>and</strong> Grapefruit 75<br />
Orange 70<br />
St. Mary Grapefruit 50 - 60<br />
Orange 25<br />
St. Ca<strong>the</strong>rine Grapefruit 5<br />
Orange 2 ½ - 3<br />
St. Ann Grapefruit 5<br />
Orange 2<br />
Clarendon Grapefruit 25 - 30<br />
Orange 4 - 6<br />
Westmorel<strong>and</strong> Grapefruit 0<br />
Orange 5<br />
Hanover Grapefruit 0<br />
Orange 1 – 2<br />
St. James Grapefruit 10<br />
Orange 5<br />
St. Elizabeth Grapefruit 20 – 25<br />
Oranges 10 – 15<br />
Manchester Grapefruit 60<br />
Orange 15<br />
Trelawny Grapefruit<br />
Orange 5<br />
Source: RADA<br />
Parish to National<br />
Production<br />
%<br />
Grapefruit - 4<br />
Orange - 1<br />
Grapefruit - 5<br />
Orange - 3<br />
Grapefruit - 20<br />
Orange - 34<br />
Grapefruit - 15<br />
Orange - 2<br />
Grapefruit - 45<br />
Orange - 28<br />
Grapefruit - 0<br />
Orange - 1<br />
Grapefruit - 0<br />
Orange - 1<br />
Grapefruit - 6<br />
Orange - 15<br />
Grapefruit - 2<br />
Orange - 7<br />
Grapefruit - 2<br />
Orange - 5<br />
Grapefruit - 0<br />
Orange - 2<br />
National Production %<br />
– Remainder after<br />
Hurricane damage<br />
1<br />
0.25<br />
2.5<br />
2.25<br />
19<br />
32.8<br />
14.25<br />
1.60<br />
33.75<br />
27.93<br />
0<br />
0.95<br />
0<br />
0.95<br />
5.4<br />
14.25<br />
1.6<br />
6.3<br />
0.8<br />
4.25<br />
0<br />
1.9<br />
4. The C<strong>of</strong>fee Industry<br />
The passage <strong>of</strong> <strong>the</strong> hurricane resulted in <strong>the</strong> following damage to c<strong>of</strong>fee due to loss <strong>of</strong> berries,<br />
defoliation <strong>of</strong> c<strong>of</strong>fee <strong>and</strong> shade trees, damage to c<strong>of</strong>fee trees as a result <strong>of</strong> falling branches from<br />
shade trees; <strong>and</strong> uprooting <strong>and</strong> twisting <strong>of</strong> young 2-3 year old plants resulting in severe root<br />
damage.<br />
It is projected that <strong>the</strong> 2007/2008 c<strong>of</strong>fee crop would have yielded 510,000 boxes <strong>of</strong> Blue<br />
Mountain c<strong>of</strong>fee <strong>and</strong> 90,000 boxes <strong>of</strong> non Blue Mountain c<strong>of</strong>fee. However, with preliminary<br />
estimates indicating that approximately 45 percent <strong>of</strong> <strong>the</strong> total c<strong>of</strong>fee crop sustained severe<br />
damage, losses are estimated at 240,000 <strong>and</strong> 30,000 boxes for Blue Mountain <strong>and</strong> non-Blue<br />
Mountain c<strong>of</strong>fee at a value <strong>of</strong> $855 million.<br />
32
In addition to crop loss, infrastructure including parochial roads has been significantly damaged.<br />
However, processing plants have sustained minimal damage. Currently, <strong>the</strong>re has been no<br />
determination <strong>of</strong> <strong>the</strong> total damage to c<strong>of</strong>fee infrastructure.<br />
5. The Banana Industry<br />
Direct damage to <strong>the</strong> banana industry was estimated at $525 million. There was an 85 per cent<br />
loss <strong>of</strong> <strong>the</strong> st<strong>and</strong>ing crops <strong>and</strong> 95 percent loss <strong>of</strong> maiden suckers. The greatest number <strong>of</strong> hectares<br />
lost from <strong>the</strong> non-estate sector was in Portl<strong>and</strong>, St. Mary <strong>and</strong> St. James. 13<br />
Total hectarage damaged was 2 358.7, with <strong>the</strong> export <strong>and</strong> domestic sector losing 1 552.51 <strong>and</strong><br />
806.19 hectares respectively. It is estimated that Hurricane Dean has directly caused a complete<br />
loss <strong>of</strong> income for up to 3 000 persons who depend solely on banana production for <strong>the</strong>ir<br />
livelihoods. There is also an indirect loss <strong>of</strong> income to ano<strong>the</strong>r 8 000 persons (shopkeepers, truck<br />
operators, processors etc).<br />
Indirect losses amounted to US$40 million. This comprised <strong>of</strong> loss in export earnings <strong>of</strong><br />
approximately US$15 million <strong>and</strong> loss in domestic earnings <strong>of</strong> US$25 million over <strong>the</strong> next six<br />
months. The banana sub-sector is extremely vulnerable to hurricanes, as over <strong>the</strong> last five years<br />
four major storms caused severe damage to <strong>the</strong> sector. Due to <strong>the</strong> risk associated with banana<br />
production, it is difficult to secure adequate insurance coverage for <strong>the</strong> sub sector. The<br />
frequency <strong>of</strong> <strong>the</strong>se storms, poses severe financial burden on <strong>the</strong> farmers as <strong>the</strong> recovery process<br />
is very slow <strong>and</strong> costly. The cost to full recovery as a result <strong>of</strong> Hurricane Dean is estimated at<br />
US$7.5 million dollars<br />
Tables 3.6, 3.7 <strong>and</strong> 3.8 detail <strong>the</strong> damage to <strong>the</strong> sub-sector as result <strong>of</strong> passage <strong>of</strong> <strong>the</strong> hurricane.<br />
13 The proportion <strong>of</strong> damage for <strong>the</strong>se parishes was due to increased banana <strong>and</strong> plantain activities in <strong>the</strong>se areas.<br />
33
Table 3.6:<br />
Analysis <strong>and</strong> Distribution <strong>of</strong> damage sustained by Non Estate Banana Growers in<br />
EUBSP Target Parishes<br />
Export Growers Domestic Growers Total<br />
Damaged<br />
Hectares<br />
No.<br />
Affected<br />
Hectares<br />
Established<br />
Hectares<br />
Damaged<br />
No.<br />
Affected<br />
Hectares<br />
Established<br />
Hectares Damaged<br />
St. Mary 36 260.02 256.77 134 178.98 178.98 435.75<br />
St. Thomas 1 3.0 3.0 4 5.0 5.0 8.00<br />
Portl<strong>and</strong> 137 356.54 354.54 172 209 206.75 561.29<br />
St. Ca<strong>the</strong>rine 1 88 91 3 6.0 6.0 85.20<br />
St. James 0 0 0 209 320.85 320.85 320.85<br />
Clarendon 0 0 0 3 6.62 6.62 6.62<br />
St. Ann 0 0 0 17 19.93 19.93 19.93<br />
Total 175 707.56 693.51 542 746.38 744.13 1 437.64<br />
Source: BECO<br />
Table3.7:<br />
Parishes<br />
Plantain Growers Affected by Hurricane Dean<br />
No. Of Growers Hectares Established Hectares Damaged<br />
Portl<strong>and</strong> 22 14.30 14.30<br />
St. Mary 34 23.66 23.66<br />
St. Thomas 21 8.6 8.6<br />
St. James 14 15.5 15.50<br />
Total 91 62.06 62.06<br />
Source: BECO<br />
34
Table 3.8:<br />
Growers<br />
Summary <strong>of</strong> Damage by Hurricane Dean<br />
# <strong>of</strong> Affected<br />
Growers<br />
Hectares<br />
Established<br />
Hectares<br />
Damaged<br />
Export<br />
Non-<br />
Estate<br />
Estate<br />
(banana)<br />
175 707.56 693.51<br />
2 907 859<br />
Domestic (banana) 542 746.38 744.13<br />
Plantain 91 62.06 62.06<br />
GRAND TOTAL 810 2 423.0 2 358.7<br />
Source: BECO<br />
6. The Poultry Industry<br />
The passage <strong>of</strong> <strong>the</strong> hurricane resulted in moderate damage to <strong>the</strong> poultry sub-sector. Small<br />
poultry farmers, which account for approximately 30-35 percent <strong>of</strong> national production,<br />
experienced <strong>the</strong> worst damage. It is estimated that prior to <strong>the</strong> hurricane small farmers had about<br />
2.5 million birds in production <strong>and</strong> would have lost approximately 20 percent (500 000 birds) <strong>of</strong><br />
<strong>the</strong>ir birds as a result <strong>of</strong> <strong>the</strong> hurricane. On <strong>the</strong> o<strong>the</strong>r h<strong>and</strong>, large farmers suffered minimal<br />
damage as <strong>the</strong>y only lost approximately 150 000 birds. However, o<strong>the</strong>r problems related to <strong>the</strong><br />
health <strong>of</strong> <strong>the</strong> birds could result in fur<strong>the</strong>r losses.<br />
The extent <strong>of</strong> <strong>the</strong> damage to infrastructure was not ascertained but preliminary inspections<br />
suggest that infrastructure loss is moderate.<br />
7. The Sugar Industry<br />
Hurricane Dean caused damage to cane cultivation which varied by location, cane variety <strong>and</strong><br />
age <strong>of</strong> cane at <strong>the</strong> time <strong>of</strong> <strong>the</strong> hurricane. The damage observed ranged from canes being blown<br />
down (extensive lodging) to severe stalk breakage, <strong>and</strong> minimum flooding.<br />
35
The <strong>impact</strong> <strong>of</strong> <strong>the</strong> loss on production will depend on <strong>the</strong> condition <strong>of</strong> lodged cane <strong>and</strong> adequate<br />
drainage to prevent rotting. Canes with stalk breakage at <strong>the</strong> top will be affected by side<br />
shooting which <strong>impact</strong>s on growth <strong>and</strong> also contribute to poor quality canes.<br />
7.1 Impact on Sugar Factories<br />
The Sugar Company <strong>of</strong> Jamaica (SCJ) factories incurred losses <strong>of</strong> approximately $761m. These<br />
resulted from damage to sugarcane, buildings, irrigation equipment, <strong>and</strong> o<strong>the</strong>r infrastructure. Of<br />
<strong>the</strong> five divisions, Monymusk <strong>and</strong> Bernard Lodge realized <strong>the</strong> most significant <strong>impact</strong>. These<br />
two divisions account for $467m (61%) <strong>of</strong> <strong>the</strong> total damage incurred. Due to <strong>the</strong> anticipated<br />
reduced cane volume <strong>and</strong> quality, it is estimated that total sugar production for <strong>the</strong> 2007/08 crop<br />
will likely be reduced by about 29 000 tonnes (21%), which represents lost revenue <strong>of</strong> about $1.1<br />
billion.<br />
In <strong>the</strong> case <strong>of</strong> non SCJ factories, indications are that <strong>the</strong>re was minimal infrastructural damage.<br />
However, information from <strong>the</strong> Sugar Industry Authority (SIA) indicate that <strong>the</strong> projected cane<br />
loss from Appleton <strong>and</strong> Worthy Park is 177 000 tonnes. At a ratio <strong>of</strong> 11.0 tonnes cane/tonnes<br />
sugar (tc/ts), <strong>the</strong> 177,000 tonnes cane converts to 16 090 tonnes sugar. At a price <strong>of</strong> $38, 400 per<br />
tonne, <strong>the</strong> projected loss in revenue <strong>of</strong> sugar from <strong>the</strong>se two factories amounts to approximately<br />
$618 million.<br />
7.2 Major Areas <strong>of</strong> Impact for SCJ Factories<br />
Table 3.9 shows total damage <strong>of</strong> approximately $123.40m to physical structures, $566m to<br />
agriculture which includes cane losses, <strong>and</strong> $72m to irrigation facilities. The projected loss in<br />
revenue foregone from both SCJ <strong>and</strong> Non-SCJ factories is estimated at $1, 732 million.<br />
36
Table 3.9 SCJ Damage to Physical Structures<br />
Main Losses Frome M/musk B. Lodge STS TSC Total<br />
($M)<br />
Buildings - 55.00 31.12 3.00 - 89.12<br />
Factory - 12.40 3.88 18.00 - 34.28<br />
Sub-Total<br />
Structure<br />
-<br />
67.40 35.00 21.00 - 123.40<br />
Irrigation - 52.00 20.00 - - 72.00<br />
Estate<br />
Sugarcane<br />
Losses 122.45 164.00 129.15 91.65 58.80 566.05<br />
Sub-Total<br />
Agriculture 122.45 216.00 149.15 91.65 58.80 638.05<br />
Total 122.45 283.40 184.15 112.65 58.80 761.45<br />
Losses-Tonnes<br />
Sugar 9,266 8,826 5,846 3,542 1,528 29,007<br />
Loss revenue<br />
@<br />
$38,400/Tonne 355.81 338.92 224.47 136.03 58.66 1,113.88<br />
Source: RADA<br />
*Revenue losses on sugar manufactured at factories.<br />
8. The Dairy Industry<br />
Dairy farmers located in <strong>the</strong> sou<strong>the</strong>rn parishes <strong>of</strong> Jamaica were <strong>the</strong> ones most adversely affected<br />
by <strong>the</strong> passage <strong>of</strong> Hurricane Dean. The widespread dislocation in electricity <strong>and</strong> water supplies,<br />
however, resulted in isl<strong>and</strong>-wide negative <strong>impact</strong>s on <strong>the</strong> sector, ei<strong>the</strong>r directly or as a result <strong>of</strong><br />
<strong>the</strong> suspension <strong>of</strong> milk purchases by <strong>the</strong> distributive trade.<br />
The major sources <strong>of</strong> losses to <strong>the</strong> sector were loss <strong>of</strong> milk production <strong>and</strong> revenue<br />
through:<br />
• Deliberate reduction in production by reducing feed to cattle to forestall<br />
dumping <strong>of</strong> milk<br />
• Reduction in production by cows due to lack <strong>of</strong> draining water supply<br />
• Absence <strong>of</strong> JPS electricity or st<strong>and</strong>by generators thus once per day h<strong>and</strong><br />
milking<br />
37
• Structural damage to milking parlours at WINDALCO necessitating pooled<br />
once per day milking at common site<br />
• Dumping <strong>of</strong> milk due to non-collection<br />
8.1 Preliminary Estimates <strong>of</strong> Production Losses<br />
The Dairy Board is at this time (September 10) unable to present an overall financial estimate <strong>of</strong><br />
<strong>the</strong> <strong>impact</strong> <strong>of</strong> <strong>the</strong> hurricane on <strong>the</strong> sector as individual farms are still in <strong>the</strong> process <strong>of</strong> finalizing<br />
<strong>the</strong>ir estimate <strong>of</strong> damage. Indications are, however, that damage to buildings, fences <strong>and</strong> animals<br />
are minimal.<br />
Based on information gleaned from contact with farmers, it is estimated that direct losses in milk<br />
production as at August 28 is approximately 25 percent <strong>of</strong> daily production. From <strong>the</strong> July<br />
production estimate <strong>of</strong> approximately 1.2 million litres, <strong>the</strong> estimated 25 percent loss <strong>of</strong><br />
production translates to approximately 96,700 litres <strong>of</strong> milk or equivalently $2.9 million during<br />
<strong>the</strong> 10 day period since <strong>the</strong> hurricane.<br />
The experience from Hurricane Ivan in 2004 suggests that, assuming a similarly early<br />
resumption in electricity <strong>and</strong> water supply to affected areas, it may take up to three months to<br />
resume pre-hurricane levels <strong>of</strong> production. On this basis <strong>the</strong> residual effects on revenues to dairy<br />
farms is projected as follows:<br />
Table 3.10:<br />
Estimated Losses in Production Revenue<br />
Period Estimated Loss In Production (Litres) Estimated Loss In Revenue ($ M)<br />
TO 19/09<br />
20/09 – 14/10<br />
20/10 – 19/11<br />
216,000 (18%)<br />
144,000 (12%)<br />
96,000 (8%)<br />
6.48<br />
4.33<br />
2.88<br />
TOTAL 456,000 13.70<br />
Source: RADA<br />
38
9. The Fisheries Sector<br />
Damage within <strong>the</strong> Fisheries Sector was estimated to be $310 million <strong>of</strong> which <strong>the</strong> Aquaculture<br />
Sub-sector was $60 million <strong>and</strong> <strong>the</strong> Marine Sub-sector was $250 million. Much <strong>of</strong> <strong>the</strong> damage to<br />
<strong>the</strong> Fisheries Sector resulted from damage to <strong>the</strong> general coastline, infrastructure such as<br />
buildings, wharves, utility poles <strong>and</strong> fences, <strong>and</strong> fishing equipment such as gear, boats <strong>and</strong><br />
engines. The <strong>impact</strong> was not restricted to <strong>the</strong> Capture Fisheries but <strong>the</strong> Culture Fisheries also<br />
underwent significant damage. The sou<strong>the</strong>rn coast suffered most substantially as many beaches<br />
were inundated by copious amounts <strong>of</strong> s<strong>and</strong> <strong>and</strong> debris, changing <strong>the</strong> l<strong>and</strong>scape, while some<br />
beaches have been totally eroded. In some areas on <strong>the</strong> south coast, fishing equipment has been<br />
severely or totally destroyed. Many traps <strong>and</strong> o<strong>the</strong>r fishing gear have been lost at sea <strong>and</strong> this<br />
can subsequently lead to “ghost-fishing” which poses a major threat to <strong>the</strong> viable existence <strong>of</strong> <strong>the</strong><br />
fishery.<br />
The income generating capacity <strong>of</strong> <strong>the</strong> fisher folk has been severely interrupted. In addition to<br />
losses within <strong>the</strong> sector some fishers have experienced personal losses such as houses, cars <strong>and</strong><br />
furniture 14 . Many commercial entities on fishing beaches were also affected.<br />
Damage was reported primarily for fishing beaches on <strong>the</strong> South Coast, particularly from<br />
Clarendon, St. Ca<strong>the</strong>rine, St. Thomas <strong>and</strong> Portl<strong>and</strong> on <strong>the</strong> North East Coast (refer to Appendix<br />
3A). Less severe damage was reported for <strong>the</strong> North Coast which may be attributed to <strong>the</strong> fact<br />
that Hurricane Dean veered south <strong>of</strong> <strong>the</strong> isl<strong>and</strong> causing more significant <strong>impact</strong>s on <strong>the</strong> south<br />
coast, <strong>the</strong> sou<strong>the</strong>rn proximal banks <strong>and</strong> <strong>the</strong> Pedro Bank.<br />
Fishing beaches have been severely affected in some areas. These include Rocky Point (St.<br />
Thomas), Rocky Point (Clarendon), Old Harbour Bay Beach, Port Henderson, Hellshire,<br />
Manchioneal, Yallahs, Morant Bay, Buff Bay <strong>and</strong> <strong>the</strong> Pedro Cays.<br />
14 Fishers from St. Thomas, St. Ca<strong>the</strong>rine, Clarendon, Manchester <strong>and</strong> St. Elizabeth were directly affected. This<br />
translates to 3,500 fishers. For <strong>the</strong> south coast, from Westmorel<strong>and</strong> east to St. Ca<strong>the</strong>rine <strong>and</strong> o<strong>the</strong>r affected parishes<br />
such as Trelawny, St. Ann, St. Mary, Portl<strong>and</strong>, St. Andrew <strong>and</strong> Kingston each fisher on average lost 15 traps or<br />
fishing gear unit. Each trap or gear unit is valued at $4, 000.00.<br />
39
Table 3.11:<br />
Summary <strong>of</strong> damage to <strong>the</strong> Fisheries Sector Caused by Hurricane Dean<br />
Capture Fisheries<br />
Aquaculture<br />
Approximate number <strong>of</strong><br />
fishers directly <strong>impact</strong>ed<br />
3,500 Approximate number <strong>of</strong><br />
farmers directly <strong>impact</strong>ed<br />
Fishing gear damaged Value $ Estimate <strong>of</strong> damage to<br />
farms<br />
• Traps, nets<br />
210 million • Ornamental farms<br />
• Boats<br />
30 million • Shrimp farms<br />
• Engines<br />
4.9 million • Food fish farms<br />
• Gear sheds 580,000<br />
23<br />
Value $<br />
27.23 million<br />
2.5 million<br />
30.37 million<br />
250 million<br />
60 million<br />
Infrastructure damaged<br />
- access roads, beach<br />
damage etc.<br />
Habitat or Fishing grounds<br />
damaged<br />
Unquantified,<br />
but damage<br />
done in areas<br />
such as<br />
Rocky Point,<br />
Old Harbour<br />
<strong>and</strong> Pedro<br />
Cays<br />
Resource <strong>and</strong><br />
Habitat<br />
<strong>assessment</strong>,<br />
<strong>and</strong><br />
Rehabilitation<br />
needed<br />
Infrastructure damaged<br />
- Included pond dykes,<br />
buildings, access roads<br />
Unquantified,<br />
but<br />
significant.<br />
Source: Fisheries Division<br />
10. Irrigation<br />
Preliminary <strong>assessment</strong> indicates no significant structural damage to <strong>the</strong> irrigation <strong>and</strong> drainage<br />
infrastructure. However, fallen trees <strong>and</strong> debris in all districts resulted in blockage <strong>of</strong> <strong>the</strong><br />
irrigation canal network, access roads <strong>and</strong> drainage network. The systems mainly affected are<br />
those located in St. Elizabeth, Clarendon <strong>and</strong> St. Ca<strong>the</strong>rine. The National Irrigation Commission<br />
(NIC) has commenced some clean up work in <strong>the</strong>se main districts. However, additional<br />
budgetary support is required to fully execute <strong>the</strong> recovery process in <strong>the</strong> shortest possible time.<br />
In <strong>the</strong> days following <strong>the</strong> event <strong>the</strong> pumping stations were without electricity supply. By<br />
September 3, 2007, two weeks after <strong>the</strong> event, electricity was restored to 25 per cent <strong>of</strong> stations<br />
in Clarendon <strong>and</strong> St. Ca<strong>the</strong>rine.<br />
40
The preliminary estimate <strong>of</strong> <strong>the</strong> damage caused by Hurricane Dean is $17.2 million (Table 3.12).<br />
Approximately 50 per cent <strong>of</strong> <strong>the</strong> sum is required immediately in order to return a reasonable<br />
level <strong>of</strong> service.<br />
Table 3.12: Estimated Recovery Cost ($ million) Resulting from Hurricane Dean<br />
Head<br />
Office<br />
St.<br />
Thomas<br />
Source: National Irrigation Commission (NIC)<br />
St.<br />
Ca<strong>the</strong>rine<br />
St.<br />
Elizabeth Trelawny TOTAL<br />
Clarendon<br />
Irrigation<br />
Work 0.15 2.2 1.8 0.25 0.15 4.55<br />
Drainage<br />
Structure 0.3 0.4 2.8 3.50<br />
Access<br />
Roads 0.1 1.2 1.1 1.6 4.00<br />
Pumps <strong>and</strong><br />
Electrical<br />
Equipment<br />
0.1 1.5 1.8 0.3 0.15 3.85<br />
Offices <strong>and</strong> 0.25 0 0.6 0.15 0.3 1.30<br />
o<strong>the</strong>r<br />
Buildings<br />
TOTAL 0.25 0.35 5.8 5.25 5.25 0.30 17.30<br />
11. Mining<br />
The bauxite <strong>and</strong> alumina sector was directly <strong>and</strong> indirectly affected by Hurricane Dean. A<br />
Preliminary estimate <strong>of</strong> losses for <strong>the</strong> industry as a whole is set at a minimum <strong>of</strong> approximately<br />
US$29 million. In terms <strong>of</strong> <strong>the</strong> direct <strong>impact</strong>, <strong>the</strong> JAMALCO refinery sustained severe damage<br />
to its port at Rocky Point. Due to <strong>the</strong> damage <strong>the</strong> plant will be unable to export from that port<br />
until repairs are carried out. The port will require significant repairs <strong>and</strong> temporary logistical<br />
support for shipping alumina while repair work is being undertaken. This work includes<br />
preparing storage for alumina which is currently limiting production to 50.0 percent <strong>of</strong> capacity,<br />
with full operation anticipated by early November. Taking into consideration insurance<br />
coverage, <strong>the</strong> total Jamalco <strong>impact</strong> from <strong>the</strong> hurricane – including lost production, business<br />
interruption <strong>and</strong> repairs is estimated to be US$10.0 million after-tax.<br />
The WINDALCO refinery sustained damage to a turbine at <strong>the</strong> Ewarton Plant. In terms <strong>of</strong><br />
indirect <strong>impact</strong>, all refineries <strong>and</strong> <strong>the</strong> St. Ann Bauxite Company lost production time due to <strong>the</strong><br />
41
closure <strong>of</strong> plants in preparation for <strong>the</strong> hurricane <strong>and</strong> <strong>the</strong> consequential effect <strong>of</strong> power outage<br />
after <strong>the</strong> hurricane’s passage. On average a total <strong>of</strong> 4-5 days <strong>of</strong> production time was lost. In <strong>the</strong><br />
Quarrying sub-sector production time was lost due to power outage. There were also reports <strong>of</strong><br />
ro<strong>of</strong> damage, slippage <strong>and</strong> damage to road infrastructure.<br />
Distributive Trade<br />
12. Services<br />
Preliminary investigations have revealed that distributors within <strong>the</strong> sector have suffered<br />
minimal damage due to Hurricane Dean. Most <strong>of</strong> <strong>the</strong> goods categories within <strong>the</strong> sector have<br />
reported damage associated with <strong>the</strong> hurricane. Damage which accrued to distributors included:<br />
1. inventory losses<br />
2. some major <strong>and</strong> minor structural damage; <strong>and</strong><br />
3. disruption <strong>of</strong> <strong>the</strong>ir production process.<br />
Perishable items which were lost were attributed to <strong>the</strong> power outage after <strong>the</strong> hurricane, <strong>and</strong> in<br />
some cases, pilferage.<br />
Tourism<br />
Damage to <strong>the</strong> tourist resort areas was estimated at $43.7 Million. Of this amount, $29.5 m<br />
occurred in <strong>the</strong> Accommodation Sub-sector while $14.1m was accounted for by <strong>the</strong> Attractions<br />
Sub-sector (Tables 3.13 <strong>and</strong> 3.14). The damage was mainly caused by <strong>the</strong> strong winds <strong>and</strong> <strong>the</strong><br />
associated storm surge. Extensive beach damage resulted from <strong>the</strong> action <strong>of</strong> <strong>the</strong> storm surge<br />
particularly in <strong>the</strong> eastern <strong>and</strong> sou<strong>the</strong>rn parts <strong>of</strong> <strong>the</strong> isl<strong>and</strong>. Some cruise ships were diverted from<br />
Jamaican ports after <strong>the</strong> arrival <strong>of</strong> <strong>the</strong> hurricane.<br />
In <strong>the</strong> South Coast Resort Area, a total <strong>of</strong> 13 entities reported extensive damage to <strong>the</strong>ir facilities;<br />
12 reported moderate damage; <strong>and</strong> 23 were identified as having minor damage. Accommodation<br />
providers reported damage to ro<strong>of</strong>, water tanks, generator, windows <strong>and</strong> some structural damage.<br />
Attractions report damage to l<strong>and</strong>scaping.<br />
42
In <strong>the</strong> North Coast Resort Areas, a total <strong>of</strong> 7 entities reported extensive damage to <strong>the</strong>ir facilities;<br />
9 reported moderate damage; <strong>and</strong> 24 were identified as having minor damage. Initial estimates<br />
<strong>of</strong> damage to date st<strong>and</strong> at $11.3 Million. Some accommodation in <strong>the</strong> Port Antonio Resort Area<br />
reported damage to l<strong>and</strong>scaping, ro<strong>of</strong>s, retaining wall <strong>and</strong> driveway; <strong>and</strong> electronic equipment<br />
Table 3.13: Estimated Value <strong>of</strong> Damage to <strong>the</strong> Accommodation Sub-sector – Summary<br />
Parish Estimated Value <strong>of</strong> Damages ($)<br />
Portl<strong>and</strong> Resort Area<br />
Portl<strong>and</strong> Resort Areas 1,320,000<br />
Sub-total 1,320.000<br />
Kingston Metropolitan Resort Area<br />
Kingston & St. Andrew<br />
St. Thomas 4,000,000<br />
Sub-Total 4,000.000<br />
South Coast Resort Area<br />
Clarendon 4,316,000<br />
Manchester 700.000<br />
St. Elizabeth 4,070,000<br />
Westmorel<strong>and</strong> (Scotts’ Cove Ferris Crossing) 1,015,000<br />
Sub-Total 10,101,000<br />
Montego Bay Resort Area<br />
St. James 40,000<br />
Falmouth Resort Area<br />
Trelawny 2,070,000<br />
Sub-Total 2,070,000<br />
Negril Resort Area<br />
Westmorel<strong>and</strong> (Savannah La Mar to Negril) 2,040,000<br />
Hanover<br />
Sub-Total 2,040,000<br />
Ocho Rios Resort Area<br />
St. Ann 3,224,213<br />
St. Mary 1564,000<br />
Sub-Total 4,788,213<br />
TOTAL 24,359,213<br />
Source: Hurricane Dean Damage Assessment Report, September 2007<br />
Tourism Product Development Company Ltd. (TPDCo)<br />
43
In <strong>the</strong> Falmouth Resort Area <strong>the</strong> Starfish Resort Hotel reported <strong>the</strong> most extensive damage<br />
(thatch hut, vent, gazebo <strong>and</strong> two rooms) estimated at $2 Million, but <strong>the</strong> facility is operational.<br />
Minor damage was reported at Glistening Waters. The Bamboo Craft market sustained severe<br />
damage to several shops <strong>and</strong> had to be closed.<br />
Table 3.14: Estimated Value <strong>of</strong> Damage to <strong>the</strong> Attractions Sub-sector – Summary<br />
Resort Area Estimated Value <strong>of</strong> Damage ($)<br />
Portl<strong>and</strong> Resort Area<br />
Portl<strong>and</strong> Resort Areas<br />
n/a<br />
Sub-total<br />
n/a<br />
Kingston Metropolitan Resort Area<br />
Kingston<br />
n/a<br />
St. Thomas 15<br />
n/a<br />
St. Ca<strong>the</strong>rine 0<br />
Sub-Total<br />
n/a<br />
South Coast Resort Area<br />
Clarendon 0<br />
Manchester 5,500,000<br />
St. Elizabeth 3,300.000<br />
Westmorel<strong>and</strong> (Scotts’ Cove Ferris Crossing) 700,000<br />
Sub-Total 9,500,000<br />
Montego Bay Resort Area<br />
St. James 0<br />
Sub-Total 0<br />
Falmouth Resort Area<br />
Trelawny 0<br />
Sub-Total 0<br />
Negril Resort Area<br />
Westmorel<strong>and</strong> (Savannah La Mar to Negril) 0<br />
Hanover 0<br />
Sub-Total 0<br />
Ocho Rios Resort Area<br />
St. Ann 2,380,000<br />
St. Mary 0<br />
Sub-Total 2,380,000<br />
TOTAL 11,880,000<br />
Source: Hurricane Dean Damage Assessment Report, September 2007<br />
Tourism Product Development Company Ltd. (TPDCo)<br />
15 Bath Botanical Gardens estimates remain outst<strong>and</strong>ing<br />
44
In St. Ann, some properties reported minor to moderate damage to ro<strong>of</strong>ing, l<strong>and</strong>scaping <strong>and</strong><br />
signage. Breezes Runaway Bay reported damage to <strong>the</strong>ir Wedding Chapel <strong>and</strong> huts on <strong>the</strong><br />
beach. Seville Great House lost a hut, a number <strong>of</strong> trees <strong>and</strong> an entrance sign. Dunn’s River<br />
Falls <strong>and</strong> Dolphin Cove, <strong>the</strong> country’s two biggest attractions, were undamaged <strong>and</strong> are open for<br />
business. The Pineapple Craft Market, which was <strong>the</strong> most severely affected craft market in <strong>the</strong><br />
parish, lost five shops as a result <strong>of</strong> hurricane; however, <strong>the</strong> facility is opened<br />
45
IV. INFRASTRUCTURE<br />
The <strong>impact</strong> <strong>of</strong> <strong>the</strong> hurricane on infrastructure included damage to roads, water mains <strong>and</strong> utility<br />
poles. Direct damage was estimated at $3.44 billion while indirect was estimated at $150<br />
million. It is important to note that information to evaluate damage <strong>and</strong> losses in <strong>the</strong><br />
infrastructure sectors was not fully available at <strong>the</strong> time <strong>of</strong> <strong>the</strong> <strong>assessment</strong>. Some service<br />
providers were still executing restoration <strong>and</strong> recovery activities <strong>and</strong> were, <strong>the</strong>refore, unable to<br />
quantify <strong>the</strong> total cost <strong>of</strong> damage. The estimation <strong>of</strong> damage <strong>and</strong> losses in infrastructure<br />
presented is, <strong>the</strong>refore preliminary <strong>and</strong> is subject to change.<br />
a) Electricity<br />
1. Public Utility Systems<br />
The Jamaica Public Service Company Limited (JPS), <strong>the</strong> private entity entrusted with <strong>the</strong><br />
provision <strong>of</strong> electricity in <strong>the</strong> isl<strong>and</strong>, stated that Hurricane Dean did not significantly affect <strong>the</strong><br />
Company’s generating units, although <strong>the</strong>re was some infrastructural damage at some <strong>of</strong> <strong>the</strong><br />
power stations.<br />
The transmission system, however, sustained severe damage, particularly in <strong>the</strong> sou<strong>the</strong>rn<br />
parishes. Indications are that <strong>the</strong> damage from Hurricane Dean on <strong>the</strong> transmission system was<br />
significantly greater than that caused by Hurricane Ivan in 2004. There was damage to about 60<br />
<strong>of</strong> <strong>the</strong> Company’s 72 transmission line segments, plus some damage at a number <strong>of</strong> substations.<br />
On <strong>the</strong> power distribution system, all <strong>of</strong> <strong>the</strong> Company’s 114 distribution feeder circuits suffered<br />
some level <strong>of</strong> damage. In addition, close to 3,000 pole locations show signs <strong>of</strong> damage, while<br />
approximately 150 kilometers <strong>of</strong> power lines were destroyed (See Figure 4.1).<br />
In order to minimize long-term damage to key elements <strong>of</strong> <strong>the</strong> power system, JPS started <strong>the</strong><br />
phased shutdown <strong>of</strong> <strong>the</strong> power system on August 19 by shutting down <strong>the</strong> electricity in eastern<br />
<strong>and</strong> sou<strong>the</strong>rn parishes, where customers had been experiencing power outages earlier in <strong>the</strong> day<br />
as a result <strong>of</strong> broken power lines. An all-isl<strong>and</strong> system shutdown was effected in <strong>the</strong> afternoon<br />
as <strong>the</strong> isl<strong>and</strong> began to feel <strong>the</strong> full effects <strong>of</strong> Hurricane Dean.<br />
46
The restoration <strong>of</strong> electricity was done according to <strong>the</strong> JPS restoration protocol with first<br />
priority given to damage <strong>assessment</strong> <strong>and</strong> repair <strong>of</strong> power plants <strong>and</strong> main transmission lines. On<br />
completion <strong>of</strong> that phase, electricity was first restored to <strong>the</strong> main lines that provide essential<br />
services such as hospitals, airports, communication systems <strong>and</strong> water supply facilities.<br />
Electricity was <strong>the</strong>n restored to power lines serving <strong>the</strong> largest number <strong>of</strong> customers, smaller<br />
power lines serving smaller groups <strong>and</strong> finally to individual customers with isolated problems.<br />
On August 26, 2007, one week after <strong>the</strong> event, power supply had been restored to approximately<br />
78 per cent <strong>of</strong> JPS customers isl<strong>and</strong>wide. Figure 4.2 <strong>and</strong> 4.4 shows recovery performance <strong>of</strong><br />
electrical services after <strong>the</strong> hurricane. Figure 4.3 illustrates that <strong>the</strong> restoration timeline has<br />
significantly improved over that <strong>of</strong> Hurricane Ivan.<br />
Challenges to <strong>the</strong> restoration process include severe damage to some areas <strong>of</strong> <strong>the</strong> power delivery<br />
system, difficult terrain, inclement wea<strong>the</strong>r, <strong>and</strong> lack <strong>of</strong> access to some areas. In addition, <strong>the</strong><br />
<strong>the</strong>ft <strong>of</strong> wires, transformers <strong>and</strong> o<strong>the</strong>r material from <strong>the</strong> power delivery system slowed down <strong>the</strong><br />
process in some areas. The restoration process was also hampered by v<strong>and</strong>alism evident in <strong>the</strong><br />
<strong>the</strong>ft <strong>of</strong> 20,000 meters <strong>of</strong> wire.<br />
Figure 4.1: Fallen utility poles along <strong>the</strong> main road leading to Hellshire<br />
47
Figure 4.2: Progress <strong>of</strong> JPS Customers Restored to Date<br />
Progress <strong>of</strong> Customers Restored<br />
to Date<br />
0.9<br />
0.8<br />
0.7<br />
78%<br />
% <strong>of</strong> Customers<br />
0.6<br />
0.5<br />
0.4<br />
0.3<br />
0.2<br />
0.1<br />
0<br />
8%<br />
20-Aug-<br />
2007<br />
27%<br />
21-Aug-<br />
2007<br />
34%<br />
22-Aug-<br />
2007<br />
40%<br />
23-Aug-<br />
2007<br />
60%<br />
24-Aug-<br />
2007<br />
67%<br />
25-Aug-<br />
2007<br />
26-Aug-<br />
2007<br />
Date<br />
Customer Restored<br />
Source: Hurricane Dean Restoration Update August 27, 2007, JPS<br />
Figure 4.3: Comparison: Restoration Timelines – Ivan vs Dean<br />
Customers Restored August 27, 10 am<br />
80<br />
70<br />
60<br />
50<br />
%<br />
40<br />
30<br />
20<br />
% Ivan<br />
% Dean<br />
10<br />
-<br />
1<br />
2<br />
3<br />
Day<br />
4<br />
5<br />
6<br />
7<br />
% Ivan<br />
% Dean<br />
Source: Hurricane Dean Restoration Update August 27, 2007, JPS<br />
48
FIGURE 4.4: PERCENTAGE OF FEEDERS ENERGIZED<br />
UP TO SUNDAY, AUGUST 26, 2007<br />
s<br />
Kingston & St. Andrew<br />
Source: JPS Hurricane Dean Restoration Update, August 27, 2007<br />
49
Preliminary estimates indicate that <strong>the</strong> electrical subsector sustained total damage <strong>and</strong> losses <strong>of</strong><br />
some $1,073.25 Million 16 , all or which are reportedly direct (see Table 6.1).<br />
b) Water Supply <strong>and</strong> Sanitation<br />
The National Water Commission (NWC), <strong>the</strong> country’s primary provider <strong>of</strong> essential water <strong>and</strong><br />
wastewater services has estimated that damage to water systems amounted to approximately<br />
$229.62 million, <strong>of</strong> which direct damage amounted to $79.62 million <strong>and</strong> indirect losses were<br />
$150.0 million (See Table 4.1 <strong>and</strong> Figure 4.5). More than four hundred <strong>and</strong> sixty (460) water<br />
supply systems <strong>and</strong> over six hundred (600) electricity-dependent facilities, including sewerage<br />
facilities, across <strong>the</strong> isl<strong>and</strong> were affected in one way or ano<strong>the</strong>r by <strong>the</strong> passage <strong>of</strong> this hurricane 17 .<br />
Prior to Hurricane Dean making l<strong>and</strong> fall, <strong>the</strong> Commission carried out a number <strong>of</strong> pre-hurricane<br />
measures to protect <strong>and</strong> mitigate against possible damage <strong>of</strong> its facilities <strong>and</strong> assets. Some <strong>of</strong><br />
<strong>the</strong>se measures included <strong>the</strong> procurement <strong>of</strong> 23 portable Genset st<strong>and</strong>by generator units, capping<br />
<strong>of</strong> <strong>the</strong> Yallah’s Intake, including <strong>the</strong> diversion <strong>of</strong> <strong>the</strong> water source from <strong>the</strong> intake <strong>and</strong> <strong>the</strong><br />
removal <strong>of</strong> pumps from Booster Stations that were susceptible to flooding. In addition, <strong>the</strong><br />
NWC provided <strong>the</strong> JPSCo with a document with NWC “priority systems for restoration”, which<br />
included maps showing <strong>the</strong> locations <strong>of</strong> each <strong>of</strong> <strong>the</strong>se critical facilities 18 .<br />
16 Calculated at approximately 75% <strong>of</strong> JPS claim to OUR for Hurricane Ivan (1.431 billion)<br />
17 In <strong>the</strong> event <strong>of</strong> extreme wea<strong>the</strong>r phenomenon such as Hurricane Dean, <strong>the</strong> isl<strong>and</strong>’s water <strong>and</strong> wastewater systems<br />
are exposed to inherent risks. Many <strong>of</strong> <strong>the</strong> 460 water supply systems across <strong>the</strong> isl<strong>and</strong>, <strong>of</strong> necessity, have intakes in<br />
riverbeds <strong>and</strong> are susceptible to flood damage <strong>and</strong> blockages; wells are <strong>of</strong>ten located in low lying plains <strong>and</strong><br />
susceptible to flooding; most systems are heavily dependent on National Power Grid for operations; more than 5,000<br />
kilometres <strong>of</strong> undulating pipeline susceptible to l<strong>and</strong> slippages, pipeline dislocation <strong>and</strong> breakages; water sources are<br />
at risk <strong>of</strong> contamination <strong>and</strong> muddy inflows (high turbidity) after heavy rainfall; <strong>and</strong> most water systems are at least<br />
partly situated in very remote areas that are difficult to access.<br />
18 Source: NWC Report on <strong>the</strong> Status <strong>of</strong> Water Supply Systems Due to Hurricane Dean, October 08, 2007<br />
50
Table 4.1: Allocation <strong>of</strong> estimated cost incurred each Area due to Hurricane Dean<br />
A. EASTERN DIVISION COST/ESTIMATE $<br />
1 Clarendon 7,117,800.00<br />
2 St. Ca<strong>the</strong>rine 5,924,320.90<br />
3 St. Mary/Portl<strong>and</strong> 22,536,000.00<br />
4 KSA/St.Thomas 41,537,078.00<br />
Sub-total 77,115,198.90<br />
B. WESTERN DIVISION<br />
1 Manchester/St. Elizabeth 1,337,536.00<br />
2 St. Ann 360,000.00<br />
3 Hanover/Westmorel<strong>and</strong> 50,000.00<br />
4 St. James/Trelawny 760,000.00<br />
Sub-total 2,507,536.00<br />
GRAND TOTAL 79,622,734.90<br />
Source: NWC Report on <strong>the</strong> Status <strong>of</strong> Water Supply Systems Due to Hurricane Dean, October 08, 2007<br />
Figure 4.5.: Allocation <strong>of</strong> cost incurred by each Area<br />
Cost Estimate Physical Damage<br />
Hurricane Dean August 2007<br />
45.000<br />
40.000<br />
35.000<br />
30.000<br />
$ Million<br />
25.000<br />
20.000<br />
15.000<br />
10.000<br />
5.000<br />
0.000<br />
Clarendon<br />
St. Ca<strong>the</strong>rine<br />
St. Mary/Portl<strong>and</strong><br />
KSA/St.Thomas<br />
Manchester/St. Elizabeth<br />
St. Ann<br />
Hanover/Westmorel<strong>and</strong><br />
St. James/Trelawny<br />
Source: NWC Report on <strong>the</strong> Status <strong>of</strong> Water Supply Systems Due to Hurricane Dean, October 08, 2007<br />
51
Water supply systems were primarily affected by:-<br />
1. Extremely high turbidity levels especially at systems served by surface water sources (i.e.<br />
rivers <strong>and</strong> springs)<br />
2. Absence <strong>of</strong> Electricity<br />
3. Blocked <strong>and</strong> damaged intake structures<br />
4. Dislocated <strong>and</strong> broken mains<br />
5. Blocked access to critical facilities<br />
Approximately 80% <strong>of</strong> water supply systems stopped operating during or immediately before <strong>the</strong><br />
hurricane’s passage, while some customers continued to receive piped water throughout <strong>the</strong><br />
passing hurricane. Among <strong>the</strong> major systems that operated throughout passage <strong>of</strong> <strong>the</strong> Hurricane<br />
were <strong>the</strong> Bogue Water Treatment Plant (WTP) in St. Ann <strong>and</strong> <strong>the</strong> Roaring River WTP in<br />
Westmorel<strong>and</strong>.<br />
Immediately following <strong>the</strong> passage <strong>of</strong> Hurricane Dean, NWC took steps to restore water supply<br />
systems that could be operated on available st<strong>and</strong>by generators to areas that could be supplied by<br />
means <strong>of</strong> gravity flow. The Constant Spring WTP (18 mgd) <strong>and</strong> Mona WTP (15 mgd) in St.<br />
Andrew, <strong>the</strong> Great River WTP (15 mgd) in St. James <strong>and</strong> <strong>the</strong> Martha Brae (6 mgd) in Trelawny<br />
were re-activated to service <strong>and</strong> were fully operational by mid-morning on Sunday August 19,<br />
2007. These plants were operated using st<strong>and</strong>-by generators. O<strong>the</strong>rs were restored over <strong>the</strong> last 7<br />
days as intakes were cleared <strong>and</strong> <strong>the</strong> electricity grid was energized.<br />
By <strong>the</strong> end <strong>of</strong> <strong>the</strong> day following <strong>the</strong> event, approximately 40% <strong>of</strong> production capacity was<br />
restored. Nearly all <strong>of</strong> <strong>the</strong> largest water supply systems were back in operation using available<br />
st<strong>and</strong>by generators or by means <strong>of</strong> gravity flow distribution. In addition, most wastewater<br />
facilities were also back in operation. As a complement to <strong>the</strong> delivery <strong>of</strong> piped water supply,<br />
NWC initiated a comprehensive water trucking operation utilizing <strong>the</strong> services <strong>of</strong> <strong>the</strong> Rapid<br />
Response Unit <strong>of</strong> <strong>the</strong> Ministry <strong>of</strong> Water <strong>and</strong> Housing, private trucks <strong>and</strong> its own water trucks.<br />
Priority was placed on supplying water to hospitals, health facilities <strong>and</strong> shelters. As more <strong>and</strong><br />
more piped water supply systems are brought back into operation, <strong>the</strong> focus <strong>of</strong> <strong>the</strong> trucking<br />
operations became more concentrated in those areas still without piped service.<br />
52
Figure 4.6: Progress <strong>of</strong> NWC Customers Restored<br />
Source: NWC Report on <strong>the</strong> Status <strong>of</strong> Water Supply Systems Due to Hurricane Dean, October 08, 2007<br />
One week after <strong>the</strong> passing <strong>of</strong> Hurricane Dean (Sunday, August 26, 2007) <strong>the</strong> NWC reported that<br />
it had 84% <strong>of</strong> its production capacity in service. As at Saturday, September 01, 2007 production<br />
capacity was restored to 90.2 per cent. The progress <strong>of</strong> <strong>the</strong> restoration effort is graphically<br />
represented in Figure 4.6. Restoration <strong>of</strong> services to <strong>the</strong> remainder <strong>of</strong> facilities was hindered by<br />
difficulty in accessing communities located in hilly interior areas <strong>of</strong> <strong>the</strong> isl<strong>and</strong>. Three weeks<br />
after <strong>the</strong> event, a number <strong>of</strong> NWC customers <strong>and</strong> pockets within service areas were still<br />
experiencing low water pressure, intermittent water supply <strong>and</strong> no water as a result <strong>of</strong><br />
fluctuations in pressure within <strong>the</strong> system. As at October 08, 2007, <strong>the</strong> National Water<br />
Commission had four (4) potable water supply facilities out <strong>of</strong> operation. This represents 99 %<br />
<strong>of</strong> <strong>the</strong> Commission’s systems for which service has been restored.<br />
The speed <strong>of</strong> restoration <strong>of</strong> NWC’s production facilities was largely effected through <strong>the</strong><br />
coordinated efforts <strong>of</strong> <strong>the</strong> JPSCo in providing energy <strong>and</strong> <strong>the</strong> National Works Agency (NWA) in<br />
assisting with access.<br />
Table 4.2 provides a listing <strong>of</strong> <strong>the</strong> four facilities out <strong>of</strong> operation <strong>and</strong> <strong>the</strong> communities served at<br />
October 08, 2005. Most <strong>of</strong> <strong>the</strong> affected systems are <strong>of</strong> <strong>the</strong> smaller sources serving semi-rural<br />
<strong>and</strong> rural communities with challenging (hilly) terrains.<br />
53
At some <strong>of</strong> <strong>the</strong>se locations, access was still a challenge, heavy siltation occurred (Figure 4.7) <strong>and</strong><br />
<strong>the</strong> restoration <strong>of</strong> JPS power supply was being awaited, at o<strong>the</strong>r facilities power has been<br />
restored however, voltage fluctuations <strong>and</strong> variation including low voltage is being experienced<br />
at <strong>the</strong>se facilities.<br />
Figure 4.7: Silted Catchment – Iterboreale, St. Mary<br />
Source:NWC<br />
The National Water Commission’s facilities in <strong>the</strong> Parishes <strong>of</strong> Kingston, St. Andrew, Portl<strong>and</strong>,<br />
St. Thomas, Clarendon, Manchester, St. Elizabeth <strong>and</strong> sections <strong>of</strong> St. Ca<strong>the</strong>rine were mostly<br />
affected by <strong>the</strong> hurricane.<br />
The Commission did not sustain major structural damage to its facilities, however,<br />
damage/displacement <strong>of</strong> pipelines <strong>and</strong> damage/loss <strong>of</strong> ro<strong>of</strong> to main <strong>and</strong> auxiliary buildings were<br />
reported for some areas.<br />
54
Table 4.2.: List <strong>of</strong> Facilities out <strong>of</strong> operation due to <strong>the</strong> effects <strong>of</strong> Hurricane Dean<br />
No. System Source Areas normally served Remarks<br />
KINGSTON & ST. ANDREW<br />
1 Mahoney Spring Mahoney, Rose Hall, Lawrence Electrical problem exists.<br />
Tavern, Cassava River, Mount Olive,<br />
Assett Hill.<br />
ST CATHERINE<br />
1 Cocoa Ridge /<br />
Goldmine T/P<br />
Filter Plant Bodose Hill, Bellas Gate, Cocoa<br />
Ridge, S<strong>and</strong> Hole, Rhule Town.<br />
Roadway impassible.<br />
JPSCo. Low Voltage.<br />
Planters, S<strong>and</strong>y Ground, Bellfield,<br />
Marlie Hill, Joe Ground, Bamboo<br />
Ridge, Bartons, Wood Hall, Browns<br />
Hall, Blue Hole, Macca Tree<br />
PORTLAND<br />
1 Seaman’s Spring<br />
Seamans Valley<br />
System partially restored - 90%.<br />
Valley<br />
900 m <strong>of</strong> pipeline from source<br />
dislocated/damaged.<br />
Complete service is scheduled to<br />
be restored by October 2007.<br />
2 Long Bay Spring<br />
Long Bay, Long Bay Pen, Rose Restoration <strong>of</strong> service is at 95%.<br />
Garden, Rural Hill, Elmwood New pipelines along roadway<br />
have been laid.<br />
# <strong>of</strong> Systems out <strong>of</strong> operations 4<br />
Source: NWC Report on <strong>the</strong> Status <strong>of</strong> Water Supply Systems Due to Hurricane Dean, October 08, 2007<br />
55
2. Telecommunications<br />
The telecommunications sub-sector 19 remained relatively operational throughout <strong>the</strong> event<br />
although damage to telecommunications network was sustained in <strong>the</strong> parishes <strong>of</strong> Portl<strong>and</strong>, St.<br />
Mary, Clarendon <strong>and</strong> St. Thomas. Direct damage to <strong>the</strong> telecommunications sector was<br />
estimated at $260 million.<br />
a) Telecommunications Service Providers<br />
FLOW reported that while <strong>the</strong>ir backbone infrastructure remained operational throughout <strong>and</strong><br />
after <strong>the</strong> hurricane, damage was sustained to approximately 10% <strong>of</strong> <strong>the</strong>ir distribution network.<br />
This was due to fallen trees <strong>and</strong> utility poles on cable lines. Approximately one-fourth <strong>of</strong> <strong>the</strong><br />
cable plant in Port Royal will need replacement <strong>and</strong> <strong>the</strong>re was loss <strong>of</strong> cable service to The<br />
Norman Manley Airport <strong>and</strong> Port Royal areas. FLOW reported that service was restored to 80%<br />
<strong>of</strong> affected customers within 24 hours <strong>of</strong> <strong>the</strong> event. Disruption <strong>of</strong> service during <strong>the</strong> event was<br />
due to fading due to extremely heavy cloud coverage <strong>and</strong> strong winds <strong>and</strong> flying debris which<br />
caused misalignment <strong>of</strong> some dishes.<br />
Cable <strong>and</strong> Wireless reported that major damage sustained, was to <strong>the</strong>ir overhead transmission<br />
infrastructure, Cellular Sites <strong>and</strong> some <strong>of</strong> <strong>the</strong>ir administrative buildings. The parishes <strong>of</strong> St.<br />
Thomas, Clarendon, St. Elizabeth, <strong>and</strong> Manchester along with St. Andrew were most affected.<br />
Damage was sustained to <strong>the</strong> microwave line connecting St. Thomas into <strong>the</strong> mobile network<br />
<strong>and</strong> to a fibre optic cable which affected service in Manchester, St. Elizabeth <strong>and</strong> Clarendon.<br />
Over 1 000 customers were without fixed line service because <strong>the</strong> M<strong>and</strong>eville Exchange was<br />
flooded <strong>and</strong> equipment damaged; an antennae in Laughl<strong>and</strong>s in St. Ann was blown out <strong>and</strong><br />
ano<strong>the</strong>r antennae at Huntley in St. Elizabeth was also blown out. This affected service in<br />
Whitehouse, Junction, Malvern, Thornton <strong>and</strong> Siloah. In Old Harbour Bay, St Ca<strong>the</strong>rine,<br />
19 According to <strong>the</strong> World Telecommunication Indicators (ITU 2005), Jamaica has 18.7 main telephone lines per<br />
100 inhabitants, 82.2 mobile cellular telephone subscribers per 100 inhabitants <strong>and</strong> 39.9 internet users per 100<br />
inhabitants. Jamaica’s telecommunications l<strong>and</strong>scape also consists <strong>of</strong> some 146 telecommunications licenses,<br />
including 49 Internet Service Providers, 32 Internet Voice Service Providers, <strong>and</strong> 20 Data Service Providers, among<br />
o<strong>the</strong>rs.<br />
56
flooded equipment left <strong>the</strong> area without service; while a problem with a generator affected<br />
service in Tower Isle St. Ann area.<br />
Digicel reported that disruptions in service were experienced in selected communities in eastern<br />
<strong>and</strong> central Jamaica, especially in <strong>the</strong> parishes <strong>of</strong> Manchester <strong>and</strong> St. Thomas. This was as a<br />
result <strong>of</strong> fading due to extremely heavy cloud coverage <strong>and</strong> strong winds <strong>and</strong> flying debris which<br />
caused misalignment <strong>of</strong> some dishes. Over 70% <strong>of</strong> <strong>the</strong>ir customers retained services during <strong>the</strong><br />
peak hours <strong>of</strong> <strong>the</strong> hurricane <strong>and</strong> operations were almost regularized in less than 24 hours after <strong>the</strong><br />
event. Restoration <strong>of</strong> service to badly affected areas like St. Thomas was challenging as roads to<br />
get to affected sites were impassable <strong>and</strong> <strong>the</strong> visibility from helicopter transporting repair teams<br />
was poor due to persistent heavy cloud coverage. Cable & Wireless <strong>and</strong> Digicel both used<br />
roving power trucks to facilitate customers who were unable to recharge <strong>the</strong>ir cellular<br />
instruments due to lack <strong>of</strong> electricity These trucks visited key locations isl<strong>and</strong>wide <strong>and</strong><br />
consumers were able to recharge <strong>the</strong>ir phones free <strong>of</strong> cost.<br />
b) Post Offices <strong>and</strong> Postal Agencies<br />
Damage to post <strong>of</strong>fices amounted to approximately $5.68 million. See Table 4.3. The Post <strong>and</strong><br />
Telecommunications Department reported major damage to 19 post <strong>of</strong>fices in 8 parishes <strong>and</strong><br />
three post <strong>of</strong>fices have had to be relocated due to <strong>the</strong> extent <strong>of</strong> <strong>the</strong> damage. The relocations<br />
affected Old Harbour Bay Post Office in St. Ca<strong>the</strong>rine, <strong>and</strong> <strong>the</strong> Lottery <strong>and</strong> Ken Jones Post<br />
Offices in St. James. Most post <strong>of</strong>fices sustained damage to ro<strong>of</strong>s <strong>and</strong> windows. Services were<br />
also disrupted due to <strong>the</strong> lack <strong>of</strong> electricity <strong>and</strong> water at some locations.<br />
In <strong>the</strong> aftermath <strong>of</strong> Hurricane Dean operations at <strong>the</strong> Central Sorting Office (CSO), <strong>the</strong> postal<br />
service headquarters, resumed on Tuesday, August 21 <strong>and</strong> <strong>the</strong> system was ready to facilitate<br />
airmail dispatch on August 22. Airmail processing was <strong>impact</strong>ed by airline schedules having<br />
been changed, but this subsequently reduced as flights began to return to <strong>the</strong>ir accustomed times.<br />
Although roads blocked by debris caused delays in some <strong>of</strong> <strong>the</strong> more remote geographical<br />
locations, as at September 3, <strong>the</strong> Postmaster General reported that <strong>the</strong>re was 95 per cent mail<br />
access across <strong>the</strong> isl<strong>and</strong>.<br />
57
Table 4.3: List <strong>of</strong> Post Offices Damaged by Hurricane Dean on August 19, 2007<br />
Parish Post Office Nature <strong>of</strong> Damage Estimated Cost<br />
<strong>of</strong> Repairs $<br />
Kingston/<br />
St Andrew<br />
Hagley Park Sections <strong>of</strong> ro<strong>of</strong> 640,000<br />
Denham Town Sections <strong>of</strong> ro<strong>of</strong> 250,000<br />
St Ca<strong>the</strong>rine Ewarton Sections <strong>of</strong> ro<strong>of</strong> 120,000<br />
Old Harbour Sections <strong>of</strong> ro<strong>of</strong> 120,000<br />
Old Harbour Bay Sections <strong>of</strong> ro<strong>of</strong> 446,200<br />
St Ann Laughl<strong>and</strong>s Sections <strong>of</strong> ro<strong>of</strong> 480,000<br />
Manchester Newport Ro<strong>of</strong> sheetings, 520,000<br />
window <strong>and</strong><br />
flooring<br />
Clarendon Lionel Town Ro<strong>of</strong> sheeting 450,000<br />
ceiling<br />
May Pen Ro<strong>of</strong> sheeting 200,000<br />
Toll Gate<br />
Section <strong>of</strong> ro<strong>of</strong> 120,000<br />
ceiling<br />
Race Course Ro<strong>of</strong>/Ceiling 250,000<br />
Hayes Perimeter Fence 100,000<br />
St James Montego Bay #2 Skylights blown <strong>of</strong>f 100,000<br />
Ken Jones<br />
Windows 130,000<br />
[Relocated]<br />
*Lottery (Rented) Ro<strong>of</strong> completely [Relocated]<br />
gone<br />
Westmorel<strong>and</strong> Be<strong>the</strong>l Town Sections <strong>of</strong> Ro<strong>of</strong> 300,000<br />
Bluefields Sections <strong>of</strong> Ro<strong>of</strong> 700,000<br />
Whitehouse Sections <strong>of</strong> Ro<strong>of</strong> 150,000<br />
Ramble Sections <strong>of</strong> Ro<strong>of</strong> 600,000<br />
TOTAL 5,676,200<br />
Source: Post &Telecommunications Division<br />
Closed <strong>and</strong> Relocated Offices:<br />
(1) Lottery relocated <strong>and</strong> operating at Sign P O in Montego Bay<br />
(2) Old Harbour Bay - closed <strong>and</strong> operations are now at <strong>the</strong> Old Harbour Post Office, St Ca<strong>the</strong>rine<br />
(3) Ken Jones - closed <strong>and</strong> operations are now at Hopewell Post Office, Hanover<br />
58
3. Transport, Roads <strong>and</strong> Bridges<br />
Both main roads maintained by <strong>the</strong> National Works Agency (NWA) <strong>and</strong> by Parish Councils<br />
(PCs) suffered heavy damage due to <strong>the</strong> onslaught <strong>of</strong> Hurricane Dean. As in Hurricane Ivan, <strong>the</strong><br />
road connecting Kingston <strong>and</strong> <strong>the</strong> Norman Manley International Airport was affected by storm<br />
surge causing flooding in <strong>the</strong> area <strong>of</strong> <strong>the</strong> Harbour View round-a-bout <strong>and</strong> piling s<strong>and</strong><br />
approximately1.5 meters high along <strong>the</strong> length <strong>of</strong> <strong>the</strong> road. Storm surge also caused heavy<br />
damage to <strong>the</strong> coastal roads in St. Thomas <strong>and</strong> Portl<strong>and</strong>. Some <strong>of</strong> <strong>the</strong> major arterial roads that<br />
sustained damage <strong>and</strong> blockage included <strong>the</strong> following:<br />
1. Goshen Main Road, St. Elizabeth<br />
2. The Yallahs Ford, St. Thomas<br />
3. Junction Main Road, St Mary<br />
The National Works Agency (NWA) reported that a total <strong>of</strong> 446 roadways were blocked by<br />
fallen trees, debris, washed down silt <strong>and</strong> l<strong>and</strong>slips due to <strong>the</strong> hurricane. Parishes hardest hit<br />
were Portl<strong>and</strong>, St. Thomas <strong>and</strong> St. Ca<strong>the</strong>rine with <strong>the</strong> cost to reopen <strong>and</strong> restore amounting to a<br />
high <strong>of</strong> $332.08 million in St. Thomas.<br />
The total cost to reopen NWA <strong>and</strong> PC roads was estimated at $545.97 million while <strong>the</strong> cost to<br />
restore NWA roads is set at $566.38 million. The total effect <strong>of</strong> <strong>the</strong> disaster on <strong>the</strong> road transport<br />
sector was estimated as $1.112 billion. Cost to re-open includes clearing <strong>of</strong> slips/blockages <strong>of</strong><br />
roads, temporary repairs to roads <strong>and</strong> cleaning <strong>of</strong> critical drains. Balance to complete includes<br />
restoration <strong>of</strong> asphaltic <strong>and</strong> unasphaltic roads, cleaning <strong>of</strong> blocked drains, <strong>and</strong> repair <strong>of</strong><br />
kerb/channel, relay culverts <strong>and</strong> construction/reconstruction <strong>of</strong> Retaining wall (see Table 4.4).<br />
NWA has estimated that <strong>the</strong>re will be an additional cost <strong>of</strong> $755.0 million for river training,<br />
gabion works <strong>and</strong> sea defence to correct damage in eight parishes. The cost to repair <strong>and</strong> replace<br />
retaining walls in four parishes is $160.0 million while it is estimated to cost $20.0 million to<br />
refurbish <strong>and</strong>/replace damaged traffic signals across <strong>the</strong> isl<strong>and</strong>.<br />
Twelve days after <strong>the</strong> event <strong>the</strong>re were still 47 affected intersections located in Kingston & St.<br />
Andrew, St. Ca<strong>the</strong>rine, Manchester, St. James, Clarendon <strong>and</strong> St. Elizabeth where traffic signals<br />
were non-operational. This was due to <strong>the</strong> lack <strong>of</strong> electrical supply at 30 <strong>of</strong> <strong>the</strong>se intersections,<br />
59
18 <strong>of</strong> which were located in Kingston & St. Andrew, three in Manchester, eight in St. Ca<strong>the</strong>rine<br />
<strong>and</strong> two in St. Elizabeth, while <strong>the</strong>re was damage to cabinets, cable <strong>and</strong> signal heads at <strong>the</strong> o<strong>the</strong>r<br />
locations. There was also significant damage to <strong>the</strong> seawall along coastal roads in <strong>the</strong><br />
Manchioneal, Portl<strong>and</strong> <strong>and</strong> Roselle in St. Thomas.<br />
Table 4.4: NWA Preliminary Cost Estimate – Hurricane Dean (August 18-20, 2007)<br />
PARISH<br />
COST TO<br />
REOPEN ( $)<br />
TOTAL COST<br />
TO REOPEN<br />
($) A<br />
BALANCE TO<br />
COMPLETE<br />
NWA ROADS<br />
($) B<br />
GRAND TOTAL<br />
REQUIRED ($)<br />
(C=A+B)<br />
NWA ROADS PC ROADS<br />
Kingston 16,339,559 21,769,999 38,109,558 38,109,558<br />
St. Andrew 31,600,000 8,550,000 40,150,000 32,650,000 72,800,000<br />
St. Ca<strong>the</strong>rine 29,698,000 34,843,000 64,541,000 23,210,000 87,751,000<br />
Clarendon 22,665,000 8,140,000 30,805,000 55,015,000 85,820,000<br />
Manchester 30,680,000 7,380,000 38,060,000 69,100,000 107,160,000<br />
St. Elizabeth 12,800,000 800,000 13,600,000 21,700,000 35,300,000<br />
Westmorel<strong>and</strong> 7,670,000 2,000,000 9,670,000 9,330,000 19,000,000<br />
Hanover 13,961,960 2,673,880 16,635,840 13,711,760 30,347,600<br />
St. James 5,671,060 5,671,060 10,750,000 16,421,060<br />
Trelawny 7,000,000 500,000 7,500,000 10,800,000 18,300,000<br />
St. Ann 31,750,000 450,000 32,200,000 5,250,000 37,450,000<br />
St. Mary 26,610,000 4,675,000 31,285,000 50,410,000 81,695,000<br />
Portl<strong>and</strong> 91,916,000 91,916,000 68,200,000 160,116,000<br />
St. Thomas 86,910,000 38,915,000 125,825,000 196,250,000 322,075,000<br />
TOTAL 415,271,579 130,696,879 545,968,458 566,376,760 1,112,345,218<br />
NB: Cost to re-open includes clearing <strong>of</strong> slips/blockages <strong>of</strong> roads, temporary repairs to roads <strong>and</strong> cleaning <strong>of</strong> critical<br />
drains<br />
Balance to complete includes restoration <strong>of</strong> asphaltic <strong>and</strong> unasphaltic roads, cleaning <strong>of</strong> blocked drains, repair <strong>of</strong><br />
kerb/channels, relay culverts <strong>and</strong> construction/reconstruction <strong>of</strong> Retaining walls<br />
Source: National Works Agency<br />
In <strong>the</strong> days following <strong>the</strong> event, <strong>the</strong> NWA with <strong>the</strong> assistance <strong>of</strong> private contractors sought to<br />
clear most roads blocked by fallen trees to ensure at least single lane traffic. Alternative routes<br />
were also assigned in cases where roads were impassable. By August 24, 2007, five days after<br />
<strong>the</strong> event, <strong>the</strong> NWA had restored access to over 95.0 per cent <strong>of</strong> <strong>the</strong> 446 roadways that were<br />
blocked. Of <strong>the</strong> 426 roads re-opened, full access were restored to 314 (70.0 percent) while 112<br />
(25.0 percent) were cleared to single lane access. Twenty roads remain closed.<br />
60
V. IMPACT ON THE ENVIRONMENT<br />
1. General<br />
a) Overview<br />
Natural hazards are an important feature <strong>of</strong> <strong>the</strong> natural <strong>environmental</strong> systems operating in<br />
Jamaica <strong>and</strong> <strong>the</strong> Caribbean. However, <strong>the</strong> occurrence <strong>of</strong> extreme events such as Hurricane Dean<br />
is <strong>of</strong>ten accompanied by disastrous <strong>impact</strong>s on social <strong>and</strong> <strong>economic</strong> well-being <strong>and</strong> extensive<br />
destruction to <strong>the</strong> natural environment. Changing climatic conditions are leading to more<br />
frequent <strong>and</strong> intense wea<strong>the</strong>r events. The <strong>impact</strong> <strong>of</strong> <strong>the</strong>se events is <strong>of</strong>ten exacerbated by<br />
anthropogenic factors which increase <strong>the</strong> vulnerability <strong>of</strong> life <strong>and</strong> l<strong>and</strong>. Extreme events can cause<br />
direct damage to critical costal ecosystems such as, coral reefs, wetl<strong>and</strong>s (mangroves) <strong>and</strong><br />
seagrass beds which act as coastal buffers <strong>and</strong> are habitat, feeding <strong>and</strong> nursery areas for fish <strong>and</strong><br />
o<strong>the</strong>r marine organisms. Strong currents caused by winds can also affect <strong>the</strong> sea floor.<br />
Additionally, beaches <strong>and</strong> coastal infrastructure are also eroded <strong>and</strong> damaged due to storm<br />
surges. Equally vulnerable to extreme storm events are forests <strong>and</strong> o<strong>the</strong>r terrestrial vegetation.<br />
b) Pre-Existing Environmental Conditions<br />
Pre-existing <strong>environmental</strong> conditions can limit or increase <strong>the</strong> potential <strong>impact</strong> <strong>of</strong> natural<br />
hazards such as hurricanes on <strong>the</strong> environment. Pre-existing conditions before <strong>the</strong> passage <strong>of</strong><br />
Hurricane Dean included <strong>the</strong> following:<br />
- The existence <strong>of</strong> formal <strong>and</strong> informal settlements in coastal areas which are highly vulnerable<br />
to flooding <strong>and</strong> storm surge (See Figure 5.1). This problem is <strong>of</strong>ten made worse by poor<br />
housing design in some <strong>of</strong> <strong>the</strong>se areas;<br />
- Coastal ecosystems were already being degraded due to marine <strong>and</strong> l<strong>and</strong>-based pollution,<br />
habitat degradation, over-fishing <strong>and</strong> <strong>the</strong> effects <strong>of</strong> previous storm events (Hurricane Ivan,<br />
2004). For example, <strong>the</strong> destruction <strong>of</strong> wetl<strong>and</strong>s in critical areas (such as Portl<strong>and</strong> Cottage,<br />
Clarendon <strong>and</strong> Old Harbour Bay, St. Ca<strong>the</strong>rine) served to increase <strong>the</strong> risk to storm surge.<br />
61
-<br />
Figure 5.1: Potential Flood Areas Below 10m<br />
Source: MapAction<br />
62
- Traditional agricultural crops such as bananas <strong>and</strong> sugar cane which are grown on low lying<br />
plains making <strong>the</strong>m susceptible to coastal flooding <strong>and</strong> wind damage<br />
- The denudation <strong>of</strong> hillsides <strong>and</strong> continued removal <strong>of</strong> vegetative cover can accelerate erosion<br />
due to rapid run<strong>of</strong>fs. This leads to increased sedimentation <strong>and</strong> turbidity in coastal areas<br />
which threatens marine resources.<br />
- Vulnerability <strong>of</strong> beaches <strong>and</strong> critical coastal infrastructure (such as roads at Roselle, St.<br />
Thomas, <strong>and</strong> Palisadoes, Kingston) are located on <strong>the</strong> coast placing <strong>the</strong>m at risk to wave<br />
action <strong>and</strong> storm surges.<br />
- Accumulation <strong>of</strong> solid waste in water channels due to indiscriminate disposal increased <strong>the</strong><br />
potential for flooding in some areas.<br />
- Saturated ground conditions resulting from rainfall during <strong>the</strong> week prior to <strong>the</strong> hurricane<br />
2. Impact <strong>of</strong> Hurricane<br />
The analysis <strong>of</strong> <strong>environmental</strong> <strong>impact</strong>s is limited by <strong>the</strong> lack <strong>of</strong> good quality data on <strong>the</strong><br />
characteristics <strong>and</strong> conditions <strong>of</strong> <strong>the</strong> environment prior to <strong>the</strong> passage <strong>of</strong> Hurricane Dean. Thus,<br />
<strong>assessment</strong> <strong>of</strong> <strong>environmental</strong> damage <strong>and</strong> loss were mainly qualitative.<br />
The wind strength, direction <strong>and</strong> forward speed <strong>of</strong> <strong>the</strong> hurricane; <strong>and</strong> <strong>the</strong> amount <strong>of</strong> rainfall<br />
associated with <strong>the</strong> event are major determinants <strong>the</strong> type <strong>of</strong> ecosystems <strong>impact</strong>s <strong>and</strong> <strong>the</strong> extent<br />
<strong>and</strong> location <strong>of</strong> <strong>the</strong> <strong>impact</strong>s. In <strong>the</strong> case <strong>of</strong> Hurricane Dean, flooding <strong>and</strong> wind damage were <strong>the</strong><br />
major sources <strong>of</strong> <strong>impact</strong>s. Both terrestrial <strong>and</strong> marine environments were <strong>impact</strong>ed by Hurricane<br />
Dean included. Some specific areas <strong>of</strong> damage included defoliation; destruction <strong>of</strong> wildlife<br />
habitats; l<strong>and</strong>slides; <strong>and</strong> vegetation damage.<br />
Due to <strong>the</strong> sou<strong>the</strong>rly path taken by Hurricane Dean, most <strong>of</strong> <strong>the</strong> <strong>impact</strong>s occurred in <strong>the</strong> sou<strong>the</strong>rn<br />
part <strong>of</strong> <strong>the</strong> country. The parishes experiencing <strong>the</strong> worst <strong>environmental</strong> damage were Portl<strong>and</strong>;<br />
Clarendon; Manchester; St. Elizabeth; Hanover <strong>and</strong> Westmorel<strong>and</strong>; St. Thomas; Kingston & St.<br />
Andrew <strong>and</strong> St. Ca<strong>the</strong>rine.<br />
63
The <strong>environmental</strong> <strong>impact</strong> <strong>of</strong> <strong>the</strong> hurricane was categorized broadly to included Direct Damage<br />
<strong>and</strong> Indirect Loss. The <strong>assessment</strong> was based on field visits undertaken by NEPA, PIOJ, <strong>and</strong> <strong>the</strong><br />
Fisheries Division.<br />
Direct Damage<br />
a) Ecosystem <strong>and</strong> Habitat Damage<br />
Coastal <strong>and</strong> Marine Ecosystems. Seagrass beds <strong>and</strong> mangroves not only act as coastal buffers<br />
but <strong>the</strong>y provide coastal stability <strong>and</strong> habitat <strong>and</strong> nursery for many fish species <strong>and</strong> o<strong>the</strong>r marine<br />
organisms. Hurricane Dean uprooted large mats <strong>of</strong> seagrass beds as seen in Figure 5.2. This is<br />
likely to lead to a reduction in fisheries catch in <strong>the</strong> ensuing months. It will also add to <strong>the</strong> clean<br />
up cost <strong>of</strong> beaches. Mangroves <strong>and</strong> seagrass act as sediment sinks <strong>and</strong> thus reduce turbidity in<br />
coastal waters.<br />
Figure 5.2: Large mats <strong>of</strong> seagrass uprooted in Rocky Point, Clarendon<br />
Several mangroves suffered crown damage by wind shear <strong>and</strong> storm surge especially in<br />
Clarendon, Manchester <strong>and</strong> St. Elizabeth (See Table 5.1). However, despite <strong>the</strong> eye <strong>of</strong> <strong>the</strong><br />
hurricane passing closest to Clarendon, about 40% <strong>of</strong> <strong>the</strong> mangroves in <strong>the</strong> Portl<strong>and</strong> Bight Area<br />
suffered very little or no damage. This is due mainly to <strong>the</strong> young state <strong>of</strong> <strong>the</strong>se mangroves<br />
which are just recovering from Hurricane Ivan in 2004. Debris consisting <strong>of</strong> Gorgonia species<br />
64
(e.g. Sea Fan) was washed ashore along sections <strong>of</strong> <strong>the</strong> Palisadoes strip. The <strong>impact</strong> on <strong>the</strong> coral<br />
reefs by <strong>the</strong> hurricane, although not yet assessed, is believed to be significant given <strong>the</strong><br />
magnitude <strong>of</strong> <strong>the</strong> storm.<br />
High turbidity affects <strong>the</strong> productivity <strong>of</strong> coastal ecosystems by lowering <strong>the</strong> amount <strong>of</strong> sunlight<br />
entering <strong>the</strong> water thus disrupting photosyn<strong>the</strong>sis <strong>and</strong> reducing <strong>the</strong> amount <strong>of</strong> food available for<br />
marine organisms. Loss <strong>of</strong> coastal ecosystems such as coral reefs has a negative <strong>impact</strong> on<br />
marine fish catch since <strong>the</strong>se ecosystems provide food <strong>and</strong> habitat for fish <strong>and</strong> <strong>the</strong> Jamaican<br />
fishery is mainly coralline. Additionally nutrient pollution from l<strong>and</strong> through increase run<strong>of</strong>f can<br />
affect coral reefs leading to excessive growth <strong>of</strong> algae which stifles reef growth.<br />
Table 5.1: Summary <strong>of</strong> Impacts on Ecosystems by Parish<br />
HABITAT<br />
Beaches Marshl<strong>and</strong>s Mangroves Forests<br />
IMPACT Erosion Lateral Compression Crown Damage<br />
PARISH Level % Affected Level % Affected Level % Affected Level % Affected<br />
Clarendon High 100 Low 100 Low 40 Low 90<br />
Moderate 30 High 10<br />
High 30<br />
Manchester Moderate 100 Moderate 100 Low 20 Low 95<br />
Moderate 50 Moderate 5<br />
High 30<br />
St. Ann Low 100<br />
St. Ca<strong>the</strong>rine Moderate 40 Low 95<br />
High 60 Moderate 5<br />
St. Elizabeth Moderate 100 Low 100 Low 50 Low 95<br />
Moderate 30 Moderate 5<br />
High 20<br />
St. James Low 100<br />
St. Thomas Moderate 20 Low 60 Low 95<br />
High 80 Moderate 40 Moderate 5<br />
Portl<strong>and</strong> Moderate 40 Low 90<br />
High 60 Moderate 10<br />
Trelawny Low 100<br />
Westmorel<strong>and</strong> Low 100<br />
St. Mary Low 100<br />
Source: National Environment <strong>and</strong> Planning Agency, 2007<br />
Crown Damage: 0-25% - Low; 26-50% - Moderate; > than 50% - High<br />
65
High water run<strong>of</strong>f from main drainage <strong>and</strong> l<strong>and</strong> led to <strong>the</strong> deposition <strong>of</strong> a significant volume <strong>of</strong><br />
solid waste into coastal waters threatening <strong>the</strong> lives <strong>of</strong> marine organisms. One <strong>of</strong> <strong>the</strong> likely<br />
<strong>impact</strong>s <strong>of</strong> this is that fish <strong>and</strong> turtles can become entangled in plastic bags resulting in<br />
suffocation.<br />
The Fisheries Division has estimated that 52,500 fish traps were lost as result <strong>of</strong> Hurricane Dean.<br />
This implies that <strong>the</strong> potential ‘ghost-fishing’ catch <strong>of</strong> <strong>the</strong> traps is approximately 105 20 MT per<br />
week. A total <strong>of</strong> 3,500 fishers have been directly affected by <strong>the</strong> hurricane due to loss <strong>of</strong> fishing<br />
equipment <strong>and</strong> disruption in <strong>the</strong>ir fishing activities. Coastal <strong>and</strong> marine ecosystems usually take<br />
long time to recover naturally <strong>and</strong> even more so due to <strong>the</strong> added anthropogenic factors<br />
<strong>impact</strong>ing <strong>the</strong>m.<br />
Terrestrial Ecosystems: Marshl<strong>and</strong>s which are home to many freshwater species such as<br />
freshwater birds <strong>and</strong> crocodiles suffered low to moderate damage (lateral compression) within<br />
<strong>the</strong> parishes <strong>of</strong> Clarendon, Manchester <strong>and</strong> St. Elizabeth. Elevated water levels in marshl<strong>and</strong>s<br />
such as in <strong>the</strong> Black River Morass could affect wildlife such as roosting <strong>and</strong> nesting birds<br />
through entrapment or drowning.<br />
The National Environment <strong>and</strong> Planning Agency assessed both coastal <strong>and</strong> inl<strong>and</strong> forests. Based<br />
on <strong>the</strong> sou<strong>the</strong>rly path <strong>of</strong> <strong>the</strong> hurricane, mangrove forests bore <strong>the</strong> brunt <strong>of</strong> <strong>the</strong> damage. While<br />
forest cover was <strong>impact</strong>ed in all <strong>the</strong> affected parishes, crown damage was relatively low being<br />
less than 25% for most parishes (Table 5.1). Overall crown damage ranged from 0 percent (no<br />
effect) to more than 75% (severe). Moderate to heavy crown damage occurred in forests on <strong>the</strong><br />
south coast such as Portl<strong>and</strong> Ridge <strong>and</strong> Brazilleto Mountains. Inl<strong>and</strong> forests experienced<br />
moderate, little or no damage probably due to <strong>the</strong> reduction in wind speed outward <strong>and</strong> away<br />
from <strong>the</strong> eye-wall.<br />
Coastal dry limestone forests in Clarendon showed moderate damage to tree crowns. Several<br />
tree species had broken branches <strong>and</strong> trunks. However, this was more pronounced in <strong>the</strong> Red<br />
Birch (Bersera simaruba) <strong>and</strong> Burnwood (Metopium brownie) which have little resistance to<br />
strong winds due to <strong>the</strong>ir brittleness.<br />
66
Habitat Loss. Both terrestrial <strong>and</strong> coastal vegetation were damaged due to <strong>the</strong> force <strong>and</strong> wind<br />
speeds <strong>of</strong> <strong>the</strong> hurricane. This is likely to affect habitats that are important roosting, foraging<br />
<strong>and</strong> nesting sites for important bird species such as <strong>the</strong> White-crowned Pigeon (Bald Pate). In<br />
addition, under extreme hurricane conditions, <strong>the</strong> loss <strong>of</strong> foraging <strong>and</strong> roosting habitat can result<br />
in high juvenile <strong>and</strong> nestling mortality.<br />
b) Coastal Erosion <strong>and</strong> Sedimentation<br />
Storm surges <strong>of</strong> 7 to 9 feet (2 to 3 meters) battered sections <strong>of</strong> Jamaica’s coastline. Some sections<br />
<strong>of</strong> <strong>the</strong> coastline, especially on <strong>the</strong> eastern <strong>and</strong> sou<strong>the</strong>rn coast were badly eroded <strong>and</strong> damage done<br />
to sea defence structure. Some <strong>of</strong> <strong>the</strong> major <strong>impact</strong>s included:<br />
- Damage to 200 metres <strong>of</strong> seawall <strong>and</strong> adjoining roadway in Manchioneal (Figure 5.3).<br />
- Damage to houses at Old Harbour Bay <strong>and</strong> Rocky Point<br />
- Road failure at Roselle (which was <strong>impact</strong>ed in Hurricane Ivan) caused by extensive<br />
scouring <strong>and</strong> undercutting <strong>of</strong> <strong>the</strong> cliff face <strong>and</strong> shoreline;<br />
- Destruction <strong>of</strong> housing <strong>and</strong> property in <strong>the</strong> Caribbean Terrace area immediately east <strong>of</strong> <strong>the</strong><br />
mouth <strong>of</strong> <strong>the</strong> Hope River <strong>and</strong> south <strong>of</strong> <strong>the</strong> Harbour View housing estate;<br />
- Removal <strong>of</strong> protective boulders <strong>and</strong> destruction <strong>of</strong> s<strong>and</strong> dunes <strong>and</strong> coastal vegetation along<br />
<strong>the</strong> Palisadoes peninsula which connects <strong>the</strong> Norman Manley International Airport <strong>and</strong> <strong>the</strong><br />
settlement <strong>of</strong> Port Royal with <strong>the</strong> rest <strong>of</strong> <strong>the</strong> isl<strong>and</strong>;<br />
- Damage to fishing settlements <strong>and</strong> beaches in Portl<strong>and</strong>, St. Thomas, St. Ca<strong>the</strong>rine <strong>and</strong><br />
Clarendon which includes extensive losses at Old Harbour Bay, Rocky Point <strong>and</strong> Portl<strong>and</strong><br />
Cottage.<br />
20 This is based on <strong>the</strong> assumption that each trap catches <strong>and</strong> average <strong>of</strong> 2 kg <strong>of</strong> fish per week.<br />
67
Figure 5.3: Eroded section <strong>of</strong> seawall along <strong>the</strong> main road in Manchioneal<br />
Estimates <strong>of</strong> sediment deposits were not available during <strong>the</strong> <strong>assessment</strong>. However, sediment<br />
deposits were reported at several locations. The storm surge <strong>and</strong> wave action <strong>of</strong> Hurricane Dean<br />
inundated sections <strong>of</strong> <strong>the</strong> south coast with severe over-wash conditions that produced shoreline<br />
erosion, s<strong>and</strong> dune damage <strong>and</strong> sedimentation. The areas <strong>of</strong> greatest erosion produced by<br />
Hurricane Dean occurred along sections <strong>of</strong> <strong>the</strong> south coast <strong>and</strong> north eastern areas <strong>of</strong> Portl<strong>and</strong>,<br />
St. Thomas <strong>and</strong> St. Andrew.<br />
There was significant flooding <strong>and</strong> deposition <strong>of</strong> s<strong>and</strong> on <strong>the</strong> Palisadoes Road caused by wave<br />
action which made <strong>the</strong> road impassable for two days (Figure 5.4). The increased accretion <strong>of</strong> <strong>the</strong><br />
beach on <strong>the</strong> harbour side caused by Hurricane Ivan in 2004 extended even fur<strong>the</strong>r as a result <strong>of</strong><br />
Hurricane Dean. This implies that <strong>the</strong> extent <strong>of</strong> <strong>the</strong> beach on <strong>the</strong> seaward side is reducing while<br />
<strong>the</strong> width <strong>of</strong> beach on <strong>the</strong> harbour side is increasing. Given <strong>the</strong> usually high currents experienced<br />
on <strong>the</strong> seaward side, <strong>the</strong> road is now more vulnerable. Also a pond approximately 20m from <strong>the</strong><br />
shoreline (created by Hurricane Ivan) on <strong>the</strong> seaward side has increased even fur<strong>the</strong>r by<br />
Hurricane Dean.<br />
There was significant accretion <strong>of</strong> s<strong>and</strong> <strong>and</strong> debris on some beaches (up to 30m inl<strong>and</strong>) such as<br />
Old Harbour Bay, Rocky Point <strong>and</strong> along <strong>the</strong> Manchester coastline while erosion or starvation <strong>of</strong><br />
68
s<strong>and</strong> on o<strong>the</strong>r beaches such as Rollings Bay, Clarendon <strong>and</strong> Treasure Beach, St. Elizabeth. At<br />
<strong>the</strong> Gunboat Beach, St. Andrew, <strong>the</strong>re were several areas <strong>of</strong> accretion along <strong>the</strong> harbour side.<br />
The hurricane also contributed to significant levels <strong>of</strong> sedimentation which flooded sea-grass<br />
beds <strong>and</strong> coral reefs along <strong>the</strong> south coast particularly in Old Harbour Bay <strong>and</strong> Rocky Point.<br />
Mangroves (Black <strong>and</strong> White) were also exposed to high levels <strong>of</strong> salinity in some areas which<br />
can eventually lead to stunted growth or death.<br />
Figure 5.4: The Palisadoes Road in Kingston covered with s<strong>and</strong> after Hurricane Dean<br />
c) Indirect Loss<br />
The reduction or loss <strong>of</strong> <strong>the</strong> protective effect <strong>of</strong> coastal ecosystems such as coral reefs,<br />
mangroves <strong>and</strong> seagrass can lead to significant erosion <strong>of</strong> coastline threatening coastal<br />
infrastructure <strong>and</strong> livelihoods. The loss <strong>of</strong> <strong>the</strong>se ecosystems will also affect marine fish<br />
production <strong>and</strong> disrupt <strong>the</strong> livelihoods <strong>of</strong> fishers <strong>and</strong> o<strong>the</strong>r individuals <strong>and</strong> businesses that<br />
directly or indirectly benefit from fishing since <strong>the</strong>se areas act as habitat <strong>and</strong> nursery areas for<br />
fish <strong>and</strong> o<strong>the</strong>r marine organisms. Although fish abundance may increase shortly after a<br />
hurricane, this is short-lived because <strong>the</strong> coastal <strong>and</strong> marine ecosystems have been damaged<br />
which may eventually lead to migration (fish look for better locations) or death <strong>of</strong> fish.<br />
69
O<strong>the</strong>r sectors such as tourism will be <strong>impact</strong>ed from changes in beach morphology, beach<br />
erosion <strong>and</strong> loss <strong>of</strong> beach due to loss <strong>of</strong> coral reefs. The high turbidity <strong>of</strong> coastal waters <strong>and</strong><br />
debris on beaches affect tourism by reducing aes<strong>the</strong>tic appeal. Run<strong>of</strong>f bearing diverse pollutants<br />
including sewage not only affects coastal ecosystems but also threatens <strong>the</strong> health <strong>of</strong> people<br />
living near <strong>the</strong> coast.<br />
Changes in habitats resulting from natural hazards threaten <strong>the</strong> lives <strong>of</strong> organisms dependent on<br />
<strong>the</strong>se habitats for survival. Wind damage to trees even if moderate can lead to loss <strong>of</strong> roosting,<br />
foraging <strong>and</strong> nesting areas for organisms. Also <strong>the</strong> wind can dislodge flowers <strong>and</strong> fruits,<br />
interrupting pollination <strong>and</strong> affect birds <strong>and</strong> bees <strong>and</strong> even honey production. Fruit eating birds<br />
such as <strong>the</strong> White-crowned Pigeon would be most threatened fruit loss. Loss <strong>of</strong> canopy may also<br />
trigger migration <strong>of</strong> birds <strong>and</strong> o<strong>the</strong>r organisms which can disrupt <strong>the</strong> ecosystem.<br />
70
VI.<br />
SUMMARY OF DAMAGE AND LOSSES AND<br />
MACROECONOMIC EFFECTS<br />
Preliminary <strong>assessment</strong> <strong>the</strong> <strong>impact</strong> <strong>of</strong> Hurricane Dean on Jamaica amounted to $23,053.92<br />
million. Of this total, $14,392.15 refers to direct damage while $8,661.78 million refers to<br />
indirect losses. (Table 6.1)<br />
Table 6.1: Preliminary Costs <strong>of</strong> Damage <strong>and</strong> Losses caused by Hurricane Dean ($million)<br />
Sector <strong>and</strong> Sub-sector<br />
$million<br />
Direct Indirect Total Private Public<br />
Total 14,392.15 8,661.78 23,053.92 18,753.69 4,300.24<br />
Social 6,994.24 80.18 7,074.42 5,961.68 1,112.74<br />
Housing 5,961.68 5,961.68 5,961.68<br />
Education <strong>and</strong> Culture 727.86 727.86 727.86<br />
Health 218.35 80.18 298.53 298.53<br />
Correctional Facilities 77.08 77.08 77.08<br />
Heritage Sites 9.27 9.27 9.27<br />
Productive 3,957.68 7,708.60 11,666.28 11,451.08 215.20<br />
Domestic Crop 904.37 904.37 904.37<br />
Livestock 74.50 74.50 74.50<br />
Greenhouse/Protected Cultivation 52.47 52.47 52.47<br />
Agricultural Crops*1 2,357.45 5,603.00 7,960.45 7,960.45<br />
Fisheries*2 310.00 75.60 385.60 385.60<br />
Irrigation 17.20 0.00 17.20 0.00 17.20<br />
Mining 2,030.00 2,030.00 2,030.00<br />
Tourism 43.69 0.00 43.69 43.69<br />
Manufacturing 0.00 0.00 0.00<br />
Relief Assistance (Agriculture)*3 198.00 0.00 198.00 0.00 198.00<br />
Infrastructure 3,440.23 150.00 3,590.23 1,340.93 2,249.30<br />
Electricity*4 1,073.25 1,073.25 1,073.25<br />
Water Supply <strong>and</strong> Sanitation 52.00 150.00 202.00 202.00<br />
Transport/Roads <strong>and</strong> Bridges 2,047.30 2,047.30 2,047.30<br />
Telecommunications*5 267.68 267.68 267.68<br />
Environment 0.00 120.00 120.00 120.00<br />
Forestry 0.00 0.00<br />
Waste Management 120.00 120.00 120.00<br />
Emergency Operations 603.00 603.00 603.00<br />
Government Relief Assistance 580.00 580.00 580.00<br />
ODPEM Recovery Activities 23.00 23.00 23.00<br />
Source: Compiled by <strong>the</strong> PIOJ with data from various agencies<br />
*1 Agricultural crops include citrus, c<strong>of</strong>fee, cocoa, banana <strong>and</strong> sugar<br />
*2 Calculations for Indirect cost based on 52,500 lost fish traps with an average catch 2kg <strong>of</strong> fish <strong>and</strong><br />
harvested 3 times within a 2 week period at a cost <strong>of</strong> $240/kg<br />
*3 Includes funds provided by <strong>the</strong> MOA to purchase <strong>and</strong> distribute fertilizer, assistance to farmers who lost greenhouses,<br />
rehabilitation <strong>of</strong> fruit trees, assistance to fishermen <strong>and</strong> banana farmers <strong>and</strong> a grant to <strong>the</strong> Sugar Industry<br />
*4 Calculated at approximately 75% <strong>of</strong> JPS claim to OUR for Hurricane Ivan (1.431 billion)<br />
*5 Includes preliminary estimates <strong>of</strong> damage to Cable & Wireless, Digicel <strong>and</strong> Post & Telecommunications infrastructure<br />
71
1. The Macroeconomy<br />
Overview <strong>of</strong> Domestic Policies<br />
The fiscal policy for 2007/08 was established within <strong>the</strong> context <strong>of</strong> <strong>the</strong> revised Medium Term<br />
Socio-Economic Framework 2006/07–2009/10 (Table 6.2). Some key macro<strong>economic</strong> targets<br />
that were established for FY 2007/08 included:<br />
• inflation <strong>of</strong> 6.0–7.0 per cent;<br />
• real GDP growth <strong>of</strong> 3.0 – 4.0 per cent;<br />
• fiscal deficit <strong>of</strong> 4.5 per cent <strong>of</strong> GDP;<br />
• debt to GDP ratio <strong>of</strong> 125.1 per cent; <strong>and</strong><br />
• Primary Surplus <strong>of</strong> 8.5 per cent <strong>of</strong> GDP.<br />
Table 6.2: Medium Term Economic Indicators 2002/03 – 2009/10<br />
INDICATORS<br />
Actual<br />
Targets<br />
2002/03 2003/04 2004/05 2005/06 2006/07 2007/08 2008/09 2009/10<br />
Real GDP Growth Rate 1.7 2.1 0.4 1.9 2.5 3-4 3-4 4-5<br />
(%)<br />
Inflation (%) 6.2 16.8 13.2 114 6.6 6-7 5-6 4-5<br />
Fiscal Balance (% GDP) -7.6 -5.6 -4.6 -3.3 -5.3 -4.5 -2—3 0.0<br />
Primary Surplus 7.2 12.5 11.8 10.4 8.5 8.5 9-10 10-11<br />
(% GDP)<br />
Debt/GDP (%) 143.9 142.5 136.6 131.5 130.4 125.12 119.91 110.89<br />
NIR<br />
1,339.7 1,568.7 1,901.6 2,078.1 2,329.3 2,131.9 2,181.9 2,232.0<br />
(US$ million)<br />
Source: Ministry <strong>of</strong> Finance & Planning<br />
The fiscal targets were to be achieved through <strong>the</strong> Government’s continued utilization <strong>of</strong> a<br />
combination <strong>of</strong> aggressive revenue enhancement measures <strong>and</strong> more efficient utilization <strong>of</strong><br />
expenditure.<br />
The Expenditure Budget for FY 2007/08 was set at $380.4 billion, an increase <strong>of</strong> $10.3 billion<br />
compared with <strong>the</strong> revised estimates for FY 2006/07. Debt Servicing at $203.8 billion accounted<br />
for 53.6 per cent <strong>of</strong> <strong>the</strong> total FY 2007/08 budget compared with $219.3 billion or 59.3 per cent<br />
72
for FY 2006/07 budget. Central Government’s operation for <strong>the</strong> FY 2007/08 budget was<br />
expected to be financed by <strong>the</strong> anticipated Revenue & Grants inflows <strong>of</strong> $243,091.7 billion, 15.0<br />
per cent higher than <strong>the</strong> actual out-turn for FY 2006/07.<br />
The Debt Management Strategy for FY 2007/08 (a continuation <strong>of</strong> <strong>the</strong> policy initiated in FY<br />
1998/99) places increased emphasis on liability management aimed at reducing long-term<br />
financing costs <strong>and</strong> maintaining a sustainable level <strong>of</strong> risk. Additionally, <strong>the</strong> debt strategy will<br />
continue to focus on:<br />
• maintaining a mix <strong>of</strong> fixed <strong>and</strong> variable interest-rate debt to fur<strong>the</strong>r diversify <strong>and</strong><br />
minimize interest-rate risk;<br />
• extending <strong>and</strong> smoothing <strong>the</strong> maturity pr<strong>of</strong>ile <strong>of</strong> <strong>the</strong> debt to better manage refinancing<br />
risk;<br />
• improving <strong>the</strong> transparency <strong>and</strong> predictability <strong>of</strong> primary market debt issuance; <strong>and</strong><br />
• promoting <strong>and</strong> building a liquid <strong>and</strong> efficient market for Government securities.<br />
2. The Economy in <strong>the</strong> year <strong>of</strong> <strong>the</strong> Disaster: January – June 2007<br />
Fiscal Accounts<br />
Central Government operations for <strong>the</strong> first quarter <strong>of</strong> Fiscal Year 2007/08 generated a deficit <strong>of</strong><br />
$8 967.3 million, which was $4 752.5 million lower than programmed. Inflows resulting from<br />
Revenue & Grants were $200.2 million lower than expected. The intake from Revenue <strong>and</strong><br />
Grants occurred against <strong>the</strong> background <strong>of</strong> lower than expected inflows from all subcategories<br />
with <strong>the</strong> exception <strong>of</strong> Bauxite Levy which was $339.0 million higher than programmed. Total<br />
expenditure at $64 661.9 million was $4 952.7 million lower than budgeted. Capital Expenditure<br />
<strong>and</strong> Recurrent Expenditure were $3 888.0 million <strong>and</strong> $1 064.7 million lower than planned,<br />
respectively.<br />
Gross Domestic Product<br />
For <strong>the</strong> first six months <strong>of</strong> 2007, real GDP increased by 1.8 per cent a deceleration in <strong>the</strong> growth<br />
rate compared with January - June 2006 when <strong>the</strong> economy grew by 2.4 per cent. The Goods<br />
Producing sector exp<strong>and</strong>ed by 1.6 per cent while <strong>the</strong> Services sector grew by 2.1 per cent ( see<br />
73
Table 6.3). Growth was recorded for all Goods producing sectors. However, in <strong>the</strong> Services<br />
sector lower levels <strong>of</strong> activities were estimated for <strong>the</strong> Miscellaneous Services Sectors. The<br />
sectors which had <strong>the</strong> largest <strong>impact</strong> on <strong>the</strong> economy were <strong>the</strong> Construction & Installation,<br />
Transport Storage & Communication, Electricity & Water <strong>and</strong> Finance & Insurance sectors. The<br />
improved performance in <strong>the</strong> economy was influenced by: (i) increased alumina, bauxite <strong>and</strong><br />
agricultural exports; (ii) normalization <strong>of</strong> activities in <strong>the</strong> Construction & Installation sector<br />
compared with <strong>the</strong> corresponding six months <strong>of</strong> 2006 when <strong>the</strong> sector was affected by a severe<br />
cement shortage; <strong>and</strong> (iii) increased electricity generation.<br />
Table 6.3: Change in GDP<br />
YEAR ON YEAR CHANGE IN GROSS DOMESTIC PRODUCT IN<br />
PRODUCERS' VALUES, AT CONSTANT 1996 PRICES (PER CENT)<br />
Jan-Mar<br />
2007<br />
Apr –Jun<br />
2007<br />
Jan-Jun<br />
2007<br />
Estimates<br />
GOODS PRODUCING SECTORS 1.4 1.8 1.6<br />
Agriculture, Forestry & Fishing 1.7 3.0 2.3<br />
Mining & Quarrying 0.8 -0.7 0.0<br />
Manufacturing -0.9 1.2 0.2<br />
<strong>of</strong> which: Food, Beverages & Tobacco -1.6 1.4 -0.1<br />
O<strong>the</strong>r Manufacturing 0.1 1.0 0.5<br />
Construction & Installation 4.5 3.6 4.1<br />
SERVICES SECTORS 2.5 1.7 2.1<br />
Electricity & Water 4.5 3.9 4.2<br />
Transport, Storage & Communication 3.8 2.2 3.0<br />
Distributive Trade 2.8 2.8 2.8<br />
Finance & Insurance Services 4.1 3.0 3.6<br />
Real Estate & Business Services 2.5 2.5 2.5<br />
Producers <strong>of</strong> Government Services 0.7 0.7 0.7<br />
Miscellaneous Services (incl. Household & -0.3 -2.3 -1.3<br />
Private Non-Pr<strong>of</strong>it Institutions)<br />
<strong>of</strong> which: Hotels, Restaurants & Clubs -1.1 -3.5 -2.3<br />
Less Imputed Bank Service Charge 8.5 1.5 5.0<br />
TOTAL GDP AT CONSTANT PRICES 1.7 1.8 1.8<br />
Source: Statistical Institute <strong>of</strong> Jamaica <strong>and</strong> Planning Institute <strong>of</strong> Jamaica<br />
74
The performance <strong>of</strong> <strong>the</strong> economy during <strong>the</strong> first half <strong>of</strong> <strong>the</strong> year was constrained by <strong>the</strong> 1.3 per<br />
cent decline in <strong>the</strong> Miscellaneous Services sector 21 . This can be explained by <strong>the</strong> subcategory<br />
Hotels, Restaurants & Clubs, which captures a large share <strong>of</strong> tourism activity, declining by 2.3<br />
per cent. The number <strong>of</strong> Stopover visitors that arrived during January-June 2007 declined by 3.4<br />
per cent, due in part to <strong>the</strong> recovery <strong>of</strong> competing destinations, particularly Cancun.<br />
Inflation<br />
Inflation for <strong>the</strong> first six months <strong>of</strong> calendar year 2007 was 2.9 per cent. This was 0.1 percentage<br />
points below <strong>the</strong> same period <strong>of</strong> 2006. The inflation indices for all eight major groups increased<br />
<strong>and</strong> was heavily concentrated in <strong>the</strong> groups Food & Drink <strong>and</strong> Housing & O<strong>the</strong>r Housing<br />
Expenses which toge<strong>the</strong>r accounted for approximately 55.8 per cent <strong>of</strong> overall price movement.<br />
Movements in <strong>the</strong> Food & Drink group were pushed by increases in <strong>the</strong> indices <strong>of</strong> <strong>the</strong> subgroups,<br />
Meat, Poultry & Fish, Dairy Products, Oils & Fats <strong>and</strong> Baked Products, Cereals &<br />
Breakfast Drinks. These sub-groups were heavily influenced by:<br />
• Rising grain prices 22 consequently leading to an increase in <strong>the</strong> prices <strong>of</strong> meat, dairy<br />
<strong>and</strong> baked products; <strong>and</strong><br />
• Supply constraints for <strong>the</strong> domestic cattle <strong>and</strong> fishing industry.<br />
Balance <strong>of</strong> Payments<br />
For <strong>the</strong> period, January - April 2007, <strong>the</strong> Balance <strong>of</strong> Payments Current Account balance was<br />
negative US$391.3 million, a deterioration <strong>of</strong> US$108.0 million compared with <strong>the</strong><br />
corresponding period <strong>of</strong> 2006. The Goods Balance deteriorated by US$57.8 million to negative<br />
US$1 006.7 million, <strong>and</strong> reflected <strong>the</strong> net result <strong>of</strong> an increase <strong>of</strong> US$58.5 million in export<br />
revenue which was <strong>of</strong>fset by an increase <strong>of</strong> US$116.3 million in expenditure on imports. The<br />
growth in expenditure on imports primarily reflected net outflows for Machinery & Transport<br />
Equipment <strong>and</strong> Manufactured Goods.<br />
The Services Balance, though positive, contracted to US$269.6 million from US$332.5 million.<br />
21 This compares with <strong>the</strong> 11.6 per cent growth during January – June 2006.<br />
22 A strong dem<strong>and</strong> for ethanol production resulted in corn prices reaching its highest level in ten years. Wheat<br />
prices were pushed upward by strong dem<strong>and</strong> from major consuming countries <strong>and</strong> droughts in some wheat growing<br />
areas.<br />
75
This reflected an expansion in <strong>the</strong> deficit on <strong>the</strong> Transportation sub-account with a simultaneous<br />
contraction in <strong>the</strong> surplus from Travel. Increased expenditure on shipping/freight <strong>and</strong> a<br />
reduction in stopover tourist arrivals over <strong>the</strong> period contributed to <strong>the</strong>se changes.<br />
External Trade<br />
For <strong>the</strong> January - April period Jamaica=s external trade deficit widened by US$93.2 million or 8.0<br />
per cent to US$1 264.9 million relative to <strong>the</strong> corresponding period <strong>of</strong> 2006. The value <strong>of</strong><br />
Traditional Domestic Exports increased by US$13.5 million (or 3.0 per cent) to US$461.0<br />
million, compared with January - April 2006. Non-Traditional Exports were valued at US$223.2<br />
million, approximately US$41.3 million (or 22.7 percent), more than <strong>the</strong> corresponding period in<br />
2006. Total Merch<strong>and</strong>ise Imports for January - April 2007 increased by US$150.8 million (8.3<br />
per cent) to US$1 965.6 million, compared with <strong>the</strong> corresponding period in 2006.<br />
Exchange Rate<br />
At <strong>the</strong> end <strong>of</strong> June 2007, <strong>the</strong> monthly nominal exchange rate was $68.42 per US$1.00, compared<br />
with $65.87 per US$1.00 <strong>and</strong> $67.70 per US$1.00 at <strong>the</strong> end June 2006 <strong>and</strong> <strong>the</strong> end <strong>of</strong> March<br />
2007, respectively.<br />
The expected performance <strong>of</strong> <strong>the</strong> economy without <strong>the</strong> disaster<br />
For 2007, <strong>the</strong> economy was projected to grow by 2.1 per cent in <strong>the</strong> absence <strong>of</strong> Hurricane Dean<br />
(Table 6.4). All sectors were forecasted to grow with both <strong>the</strong> Goods - producing <strong>and</strong> Services<br />
sectors projected to increase by 2.2 per cent. The Construction & Installation, Electricity &<br />
Water, Transport, Storage & Communication <strong>and</strong> <strong>the</strong> Finance & Insurance sectors were expected<br />
to be <strong>the</strong> main drivers <strong>of</strong> growth for 2007.<br />
Output during July-December was expected to exp<strong>and</strong> at a faster pace (2.4 per cent) than in <strong>the</strong><br />
January – June period when <strong>the</strong> economy grew by 1.8 per cent. This was partly based on an<br />
expected higher level <strong>of</strong> activity in <strong>the</strong> Mining & Quarrying <strong>and</strong> Miscellaneous Services sectors<br />
resulting in a projected growth <strong>of</strong> 5.2 per cent <strong>and</strong> 2.4 per cent, respectively for <strong>the</strong> final six<br />
months <strong>of</strong> <strong>the</strong> year 23 . O<strong>the</strong>r sectors that were expected to contribute to <strong>the</strong> country’s expansion<br />
23 During January-June 2007, <strong>the</strong> Mining & Quarrying sector registered a flat performance while <strong>the</strong> Miscellaneous<br />
sector declined by 1.3 per cent.<br />
76
during <strong>the</strong> final half <strong>of</strong> <strong>the</strong> year were <strong>the</strong> Construction & Installation, Electricity & Water <strong>and</strong><br />
transport Storage & Communication.<br />
Table 6.4: Pre-Dean GDP Projections<br />
YEAR ON YEAR CHANGE IN GROSS DOMESTIC PRODUCT IN PRODUCERS' VALUES AT<br />
CONSTANT 1996 PRICES (PER CENT)<br />
Jul-Sept Oct-Dec Jul-Dec Jan-Dec<br />
2007 2007 2007 2007<br />
GOODS PRODUCING SECTORS 2.6 2.9 2.8 2.2<br />
Agriculture, Forestry & Fishing 1.0 1.5 1.3 1.8<br />
Mining & Quarrying 5.1 5.3 5.2 2.6<br />
Manufacturing 1.7 2.2 2.0 1.0<br />
<strong>of</strong> which: Food, Beverages & Tobacco 2.0 2.5 2.2 0.9<br />
O<strong>the</strong>r Manufacturing 1.5 2.0 1.7 1.2<br />
Construction & Installation 3.0 3.2 3.1 3.6<br />
SERVICES SECTORS 2.2 2.2 2.2 2.2<br />
Electricity & Water 4.4 4.0 4.2 4.2<br />
Transport, Storage & Communication 2.5 3.0 2.7 2.9<br />
Distributive Trade 2.0 1.8 1.9 2.4<br />
Finance & Insurance Services 2.4 2.5 2.5 3.0<br />
Real Estate & Business Services 2.5 2.4 2.4 2.5<br />
Producers <strong>of</strong> Government Services 0.5 0.5 0.5 0.6<br />
Miscellaneous Services (incl. Household & Private 2.4 2.3 2.4 0.4<br />
Non-Pr<strong>of</strong>it Institutions)<br />
<strong>of</strong> which: Hotels, Restaurants & Clubs 2.5 2.3 2.4 -0.1<br />
Less Imputed Bank Service Charge 1.2 1.0 1.1 3.1<br />
TOTAL GDP AT CONSTANT PRICES 2.4 2.5 2.4 2.1<br />
Source: Planning Institute <strong>of</strong> Jamaica<br />
The Evolution <strong>of</strong> <strong>the</strong> Economy with <strong>the</strong> Disaster<br />
Due to <strong>the</strong> <strong>impact</strong> <strong>of</strong> Hurricane Dean <strong>the</strong> economy is expected to grow by 1.1 per cent for 2007<br />
instead <strong>of</strong> <strong>the</strong> 2.1 per cent forecasted prior to <strong>the</strong> passage <strong>of</strong> <strong>the</strong> hurricane. This will result from<br />
losses in output flows primarily in <strong>the</strong> Agriculture Forestry & Fishing, Mining & Quarrying <strong>and</strong><br />
Electricity & Water sectors. However <strong>the</strong> Construction & Installation <strong>and</strong> Distributive Trade<br />
77
sectors are estimated to be positively <strong>impact</strong>ed by <strong>the</strong> effects <strong>of</strong> <strong>the</strong> hurricane. The Construction<br />
& Installation sector is expected to benefit from reconstruction activity. An expansion in activity<br />
in <strong>the</strong> Distributive Trade sector is predicated on projected higher gross sales associated with<br />
preparations prior to <strong>the</strong> hurricane <strong>and</strong> reconstructive work in <strong>the</strong> aftermath <strong>of</strong> <strong>the</strong> passage <strong>of</strong> <strong>the</strong><br />
hurricane.<br />
Prior to Hurricane Dean it was projected that inflation would be contained within <strong>the</strong> single digit<br />
range <strong>of</strong> 7.0 per cent – 9.0 per cent. Given <strong>the</strong> hurricane <strong>and</strong> <strong>the</strong> influence <strong>of</strong> o<strong>the</strong>r global events<br />
projections have been revised. It is now anticipated that inflation for calendar year 2007 will<br />
fall between 9.0 per cent – 10.0 per cent. For <strong>the</strong> remainder <strong>of</strong> year, inflation impulses are likely<br />
to be derived from:<br />
• a shortage <strong>of</strong> domestic food crops, resulting from <strong>the</strong> <strong>impact</strong> <strong>of</strong> Hurricane Dean on <strong>the</strong><br />
agricultural sector;<br />
• higher prices for meat <strong>and</strong> poultry due to increased international grain prices <strong>and</strong> supplyside<br />
restrictions for beef. The marine sub-sector was also affected by <strong>the</strong> passage <strong>of</strong><br />
Hurricane Dean;<br />
• increased international crude oil prices, driven by tight supplies in <strong>the</strong> US given <strong>the</strong><br />
closure <strong>of</strong> several refineries in <strong>the</strong> path <strong>of</strong> Hurricane Humberto. It is also expected that<br />
concerns about <strong>the</strong> effect <strong>of</strong> <strong>the</strong> Atlantic Hurricane season on <strong>the</strong> Gulf <strong>of</strong> Mexico could<br />
affect supplies <strong>and</strong> by extension, prices.<br />
78
VII. GUIDELINES FOR A REHABILITAION<br />
AND RECONSTRUCTION PROGAMME<br />
1. Rehabilitation Stage<br />
This initial phase is focused on normalizing <strong>the</strong> living conditions <strong>of</strong> victims, while also<br />
continuing to reactivate <strong>economic</strong> activity in <strong>the</strong> areas affected. Vital needs had to be met <strong>and</strong><br />
basic services delivered. The victims’ food, health care <strong>and</strong> employment needs should take<br />
priority <strong>and</strong> were met expeditiously through <strong>the</strong> following actions done both by <strong>the</strong> public sector<br />
<strong>and</strong> with private sector, international donors <strong>and</strong> NGOs:<br />
• Provision <strong>of</strong> food<br />
• Provision <strong>of</strong> potable water<br />
• Medical attention to those at risk<br />
• Control <strong>and</strong> prevention <strong>of</strong> diseases, especially contagious diseases<br />
• Housing repair<br />
• Establishment <strong>of</strong> improved sanitation services<br />
• Generation <strong>of</strong> productive jobs<br />
• Provisional repair <strong>of</strong> access roads to affected areas<br />
• Supply <strong>of</strong> seeds <strong>and</strong> basic inputs into farming for small <strong>and</strong> medium-scale<br />
farmers, along with s<strong>of</strong>t loans <strong>and</strong> o<strong>the</strong>r financial support<br />
• Repair <strong>of</strong> affected infrastructure<br />
The suggested rehabilitation programme met vital <strong>and</strong> basic needs, control <strong>and</strong> check <strong>the</strong> spread<br />
<strong>of</strong> diseases <strong>and</strong> epidemics in order to prevent hardships from becoming more acute. These<br />
actions will certainly overlap with <strong>the</strong> reconstruction stage.<br />
79
2. Reconstruction Stage<br />
This is <strong>the</strong> most crucial stage in <strong>economic</strong> <strong>and</strong> social terms, since it will lead to <strong>the</strong> full reestablishment<br />
<strong>of</strong> normal living conditions <strong>and</strong> <strong>the</strong> country’s <strong>economic</strong> <strong>and</strong> social development<br />
momentum <strong>and</strong> increase <strong>the</strong> resilience reducing <strong>the</strong> vulnerability that Hurricane Ivan made<br />
evident.<br />
This phase ought to bring about <strong>the</strong> implementation <strong>of</strong> specific projects that are matched to<br />
available resources <strong>and</strong> that can be assimilated by <strong>the</strong> different <strong>economic</strong> sectors <strong>and</strong> <strong>the</strong><br />
country’s government <strong>and</strong> financial sector. The main aim <strong>of</strong> <strong>the</strong> reconstruction stage <strong>and</strong> <strong>the</strong><br />
projects <strong>the</strong>re<strong>of</strong> is to effectively overcome <strong>the</strong> direct <strong>and</strong> indirect losses stemming from <strong>the</strong><br />
disasters, while increasing <strong>the</strong> mitigation against a recurrence <strong>of</strong> <strong>the</strong> event that took place. For<br />
example, <strong>the</strong> approaches to bridges have been exposed as being vulnerable to <strong>the</strong> type <strong>of</strong> water<br />
that descended on <strong>the</strong>m.<br />
Reduced vulnerability <strong>of</strong> housing, infrastructure reconstruction that improves on current<br />
exposure as evidenced by <strong>the</strong> damage suffered agricultural recovery <strong>and</strong> income-generating<br />
programmes are all part <strong>of</strong> this phase.<br />
Most importantly, on designing <strong>the</strong> reconstruction programme it will be important to take into<br />
account macro<strong>economic</strong> principles so as to prevent <strong>the</strong> undesirable consequences <strong>of</strong> overly<br />
ambitious reconstruction programmes that impinge on <strong>the</strong> overall <strong>economic</strong> performance or<br />
absorptive capacity.<br />
The <strong>impact</strong> <strong>of</strong> Hurricane Dean highlighted issues relating to l<strong>and</strong> use <strong>and</strong> building practices <strong>and</strong><br />
coastal roads. These issues are discussed below:<br />
L<strong>and</strong> Use. A considerable portion <strong>of</strong> <strong>the</strong> <strong>impact</strong> <strong>of</strong> Hurricane Dean resulted from inappropriate<br />
location <strong>of</strong> settlements. In particular, communities such as Portl<strong>and</strong> Cottage, <strong>and</strong> Rocky Point in<br />
Clarendon <strong>and</strong> Caribbean Terrace, St. Andrew, <strong>the</strong> areas affected in Clarendon, St. Ca<strong>the</strong>rine,<br />
80
Kingston, St. Thomas St. Elizabeth are below <strong>the</strong> 10 metre threshold <strong>and</strong> are <strong>the</strong>refore prone to<br />
flooding.<br />
Building Practices <strong>and</strong> St<strong>and</strong>ards. Planning <strong>and</strong> design defects were contributory factors cited<br />
in <strong>the</strong> damage to housing in Rocky Point, Clarendon, Portl<strong>and</strong> Cottage, Clarendon, Old Harbour,<br />
St. Ca<strong>the</strong>rine <strong>and</strong> White Horses, St. Thomas. In <strong>the</strong> past, building practices incorporated more<br />
mitigation measures to withst<strong>and</strong> wind <strong>and</strong> flood <strong>impact</strong>. Older buildings were likely to be built<br />
on stilts with a finish ground levels <strong>of</strong> >2ft above ground level compared with newer buildings<br />
with a finish <strong>of</strong> < 1 ft above ground level (Figure 1.7).<br />
Coastal Roads. A common feature <strong>of</strong> coastal roads in Jamaica is that <strong>the</strong>y are constructed in low<br />
lying areas <strong>and</strong> are <strong>the</strong>refore prone to flooding <strong>and</strong> subsequent damage. As a consequence, roads<br />
such as Roselle <strong>and</strong> Palisadoes have been subjected to frequent. Coastal roads should be<br />
engineered with adequate height (above sea level), drainage, central slope <strong>and</strong> protective<br />
structures to minimize effects from coastal hazards.<br />
Coastal Ecosystems. Coastal ecosystems not only play an ecological role but <strong>the</strong>y provide<br />
habitat for many commercial species <strong>and</strong> o<strong>the</strong>r marine organisms <strong>and</strong> acts as sediment traps <strong>and</strong><br />
buffers to reduce storm surge. The coastal ecosystems are being frequently <strong>impact</strong>ed by storm<br />
events. Within <strong>the</strong> last five years more than five storms have affected <strong>the</strong>se ecosystems, two <strong>of</strong><br />
which have been intense hurricanes. Hence, <strong>the</strong>y have had little time to recover which makes<br />
<strong>the</strong>m quite vulnerable. The continued loss <strong>of</strong> <strong>the</strong>se ecosystems has increased <strong>the</strong> vulnerability <strong>of</strong><br />
coastal areas <strong>and</strong> infrastructure <strong>and</strong> threatens one <strong>of</strong> <strong>the</strong> country’s main industries, tourism.<br />
Rehabilitative <strong>and</strong> protective measures are <strong>the</strong>refore important to preserve <strong>the</strong>se ecosystems.<br />
81
3. Recommendations<br />
Based on <strong>the</strong> experience with Hurricane Dean <strong>and</strong> previous events, it is evident that steps are<br />
urgently needed to reduce vulnerability <strong>of</strong> housing, coastal infrastructure, <strong>the</strong> agriculture sector;<br />
<strong>and</strong> threats to livelihood.<br />
Some <strong>of</strong> <strong>the</strong> measures required include:<br />
i. A review <strong>of</strong> st<strong>and</strong>ards to reduce <strong>the</strong> vulnerability <strong>of</strong> housing developments to<br />
hurricane. These stakeholders include ODPEM, NEPA, Water Resources Authority,<br />
National Housing Trust, National Housing Development Corporation, Construction<br />
Resource <strong>and</strong> Development Centre.<br />
ii. A review <strong>of</strong> coastal setback on an on-going basis. Developers must be made to<br />
conform to approved st<strong>and</strong>ards.<br />
iii. Improvements in enforcement <strong>of</strong> building regulations while taking into consideration<br />
<strong>the</strong> need for affordable housing <strong>and</strong> <strong>the</strong> capacity required for carrying out<br />
enforcement.<br />
iv. The provision <strong>of</strong> training in appropriate building techniques for <strong>the</strong> buildings<br />
v. Implementation <strong>of</strong> a programme <strong>of</strong> retr<strong>of</strong>itting for housing, incorporating hurricane<br />
resistant techniques.<br />
vi. Assessment <strong>of</strong> <strong>the</strong> <strong>impact</strong> <strong>of</strong> storm events on coastal ecosystems with a view to<br />
designing rehabilitation strategies.<br />
vii. Development <strong>of</strong> best management practices to address <strong>the</strong> vulnerability <strong>of</strong> specific<br />
coastal areas such as <strong>the</strong> Palisadoes Road, St. Andrew, Roselle, St. Thomas <strong>and</strong><br />
Manchioneal, Portl<strong>and</strong>; <strong>and</strong><br />
viii. Development <strong>and</strong> implementation <strong>of</strong> a structured hazard mapping programme.<br />
ix. The development <strong>of</strong> affordable risk transfer mechanisms to reduce <strong>the</strong> burden on<br />
government at <strong>the</strong> answer <strong>of</strong> last resort.<br />
Below is a list <strong>of</strong> suggested projects to address some <strong>of</strong> <strong>the</strong> issues highlighted by this recent<br />
event.<br />
82
PROJECT TITLE: MAPPING OF COASTAL CHANGE HAZARDS<br />
The Problem<br />
Coastal damage resulting from storm surge that occur during hurricanes pose significant hazards<br />
to buildings <strong>and</strong> infrastructure that are close to vulnerable shorelines. The increased frequency<br />
<strong>and</strong> intensity <strong>of</strong> hurricanes has triggered significant storm surge activity Jamaica’s coasts have<br />
resulted in loss <strong>of</strong> lives <strong>and</strong> damage to coastal infrastructure. The cost to <strong>the</strong> country has been in<br />
billions <strong>of</strong> dollars <strong>and</strong> lives <strong>and</strong> livelihoods are constantly under threat. Mitigating <strong>the</strong> risk from<br />
storm surges is important because approximately 1.8 million <strong>of</strong> Jamaica’s 2.6 million inhabitants<br />
live in coastal areas. In addition, <strong>the</strong>se areas have important <strong>economic</strong> assets including port<br />
facilities, <strong>and</strong> tourism infrastructure.<br />
In order to manage coastal hazards adequate data are required for decision-making. National<br />
Hazard Maps <strong>and</strong> to some extent hazard management plans <strong>and</strong> policies exist at <strong>the</strong> national<br />
level. However, <strong>the</strong>re is a need for <strong>the</strong>se tools to be fur<strong>the</strong>r developed, established, <strong>and</strong> utilized<br />
at parish/municipal levels. This will enable disaster managers to predict where <strong>and</strong> how much<br />
coastal change will occur in order to locate new construction l<strong>and</strong>ward <strong>of</strong> coastal hazards.<br />
Developing this predictive capability requires quantifying how coasts respond to extreme storm<br />
events.<br />
Project Objective<br />
To determine possible storm surge inundation <strong>and</strong> run up levels which may occur in <strong>the</strong> passage<br />
<strong>of</strong> a hurricane in selected coastal towns. This information will serve to guide <strong>the</strong> decision making<br />
process as it relates to development planning, resource <strong>and</strong> l<strong>and</strong> management, mitigation,<br />
emergency preparedness <strong>and</strong> evacuation planning.<br />
Major Components<br />
1. Preparation <strong>of</strong> digitized <strong>and</strong> geo-reference existing bathymetric charts, topographic contours<br />
<strong>and</strong> satellite imagery.<br />
83
2. Undertaking Oceanographic Survey to determine <strong>and</strong> document <strong>the</strong> condition <strong>and</strong><br />
characteristics <strong>of</strong> coastal resources. This will include:<br />
- Bathymetric Survey from <strong>the</strong> nearshore to 30 metres water depths for <strong>the</strong> relevant towns.<br />
- Topographic survey <strong>of</strong> selected towns as follows <strong>and</strong><br />
- S<strong>and</strong> sampling to determine erosion potential<br />
3. Identification <strong>and</strong> mapping <strong>of</strong> national resources/infrastructure/facilities including<br />
i. Emergency Shelters<br />
ii. Police stations; Hospitals (beds); Fire stations <strong>and</strong> o<strong>the</strong>r Critical Facilities<br />
iii. Bridges <strong>and</strong> Coastal roads<br />
iv. Properties <strong>and</strong> populations at risk<br />
4. Site specific storm surge analysis to determine storm surge levels for 10, 25, 50 <strong>and</strong> 100 Year<br />
Return Period; <strong>and</strong> Category 4 <strong>and</strong> 5 hurricanes on worst-case track<br />
5. Preparation <strong>of</strong> Hazard vulnerability maps in GIS format <strong>and</strong> report for all major coastal<br />
towns<br />
Key Project Output(s)<br />
Storm Surge Vulnerability Maps<br />
Duration<br />
3 months<br />
84
PROJECT TITLE: COASTAL ECOSYSTEM STUDY<br />
The Problem<br />
The Jamaican coastal ecosystems are characterized by mangroves, seagrass beds <strong>and</strong> coral reefs.<br />
The ecosystems provide habitat, nursery <strong>and</strong> food for many commercial fish species <strong>and</strong> o<strong>the</strong>r<br />
marine organisms. They also act as sediment traps <strong>and</strong> buffers to reduce storm surge <strong>and</strong> also<br />
replenish s<strong>and</strong> on beaches. Besides <strong>the</strong> ecological role <strong>of</strong> <strong>the</strong>se ecosystems, <strong>the</strong>y provide social<br />
<strong>and</strong> <strong>economic</strong> benefits such as livelihood for many coastal dwellers (such as in Hellshire, Rocky<br />
Point <strong>and</strong> Old Harbour Bay) <strong>and</strong> is integral to our ‘sun sea <strong>and</strong> s<strong>and</strong>’ style <strong>of</strong> tourism.<br />
However, <strong>the</strong> coastal ecosystems are not only being <strong>impact</strong>ed by anthropogenic factors but by<br />
frequent storm events. Within <strong>the</strong> last five years (2002-2007), more than five storms have<br />
affected <strong>the</strong>se ecosystems, two <strong>of</strong> which have been intense hurricanes, Hurricane Ivan (2004)<br />
<strong>and</strong> Hurricane Dean (2007). Due to <strong>the</strong> frequent <strong>impact</strong> from storms events, <strong>the</strong>se ecosystems<br />
have had little time to recover which makes <strong>the</strong>m even more vulnerable. Their continued loss has<br />
reduced marine biodiversity, increased <strong>the</strong> vulnerability <strong>of</strong> coastal areas <strong>and</strong> infrastructure <strong>and</strong><br />
threatens tourism, one <strong>of</strong> <strong>the</strong> country’s main <strong>economic</strong> sectors. Also fish traps <strong>and</strong> o<strong>the</strong>r fishing<br />
gears are usually lost at sea after a storm <strong>and</strong> continue to “ghost” fish which can contribute to<br />
significant over-fishing. So far, <strong>the</strong>re has been inadequate <strong>assessment</strong> <strong>of</strong> <strong>the</strong> <strong>impact</strong> <strong>of</strong> storm<br />
events on <strong>the</strong> ecosystems due to inadequate financial <strong>and</strong> technical capacity. Additionally, <strong>the</strong><br />
<strong>socio</strong>-<strong>economic</strong> value <strong>of</strong> coastal ecosystems is unknown but this information is pivotal to<br />
assessing <strong>the</strong> <strong>impact</strong> <strong>of</strong> natural hazards <strong>and</strong> encouraging protection. Information on <strong>the</strong> status <strong>of</strong><br />
<strong>the</strong>se ecosystems is sparse or absent.<br />
The study is expected to provide a framework for <strong>the</strong> improved management <strong>and</strong> rehabilitation<br />
<strong>of</strong> coastal ecosystems. Better underst<strong>and</strong>ing <strong>of</strong> <strong>the</strong> social, <strong>economic</strong> <strong>and</strong> ecological value <strong>of</strong> <strong>the</strong>se<br />
ecosystems will enable better <strong>assessment</strong> <strong>of</strong> <strong>the</strong> <strong>impact</strong> <strong>of</strong> storm events on <strong>the</strong> ecosystems<br />
<strong>the</strong>mselves <strong>and</strong> on <strong>the</strong> country’s economy. Information gained through this project will not only<br />
aid in creating an ecosystems database but will also assist in developing a natural hazards <strong>and</strong><br />
risk management strategy for coastal ecosystems.<br />
85
Project Objective<br />
To develop a framework for <strong>the</strong> rehabilitation <strong>and</strong> improved management <strong>of</strong> coastal ecosystems<br />
Components<br />
The overall goal <strong>of</strong> <strong>the</strong> study is to preserve <strong>the</strong> coastal ecosystems’ goods <strong>and</strong> services by<br />
providing valuable information for improved management <strong>and</strong> rehabilitation. Specific<br />
components are:<br />
1) The valuation <strong>of</strong> coastal ecosystems: mangroves, seagrass beds <strong>and</strong> coral reefs<br />
2) Determination <strong>of</strong> <strong>the</strong> pre-Hurricane Dean status <strong>of</strong> coastal ecosystems<br />
3) Assessment <strong>of</strong> <strong>the</strong> <strong>impact</strong> <strong>of</strong> Hurricane Dean on <strong>the</strong> coastal ecosystem<br />
4) Development <strong>of</strong> rehabilitative measures for <strong>the</strong> ecosystems<br />
Key Project Outputs<br />
The key outputs expected are:<br />
1. Data/Information on <strong>the</strong> pre-Hurricane Dean status <strong>of</strong> coastal ecosystems.<br />
2. Value <strong>of</strong> coastal ecosystems to Jamaica.<br />
3. Information on <strong>the</strong> Impact <strong>of</strong> Hurricane Dean on <strong>the</strong> coastal ecosystems.<br />
4. Recommended measures to rehabilitate damaged ecosystems.<br />
5. Removal <strong>of</strong> lost fishing gears.<br />
Geographic Scope<br />
Port Royal <strong>and</strong> Port Royal Cays (Kingston), Port Antonio (Portl<strong>and</strong>), Old Harbour Bay (St.<br />
Ca<strong>the</strong>rine), Rocky Point (Clarendon), Ocho Rios <strong>and</strong> Discovery Bay (St. Ann), Negril<br />
(Westmorel<strong>and</strong> & Hanover), Montego Bay (St. James).<br />
Duration: 6 months<br />
86
PROJECT TITLE: TO REHABILITATE DRAINAGE NETWORK<br />
Sector - Infrastructure<br />
Hurricane Dean caused extensive damage to road <strong>and</strong> drainage infrastructure in <strong>the</strong> parishes <strong>of</strong><br />
St. Thomas, St. Andrew, St. Ca<strong>the</strong>rine, Clarendon, St. Mary, Portl<strong>and</strong>, St. Ann <strong>and</strong> St. James. In<br />
addition to limiting access to some areas, <strong>the</strong>re were threats to lives <strong>and</strong> property. The main<br />
objective <strong>of</strong> <strong>the</strong> project is to undertake river training <strong>and</strong> gabion works to protect drainage<br />
network in <strong>the</strong> affected parishes. Specific activities include: bunding, desilting, gabion works,<br />
sea defence, <strong>and</strong> road restoration.<br />
PROJECT: HOUSING REHABILITATION<br />
Sector - Housing<br />
The considerable damage in <strong>the</strong> housing sector was mainly to houses where <strong>the</strong> ro<strong>of</strong> was<br />
designed <strong>and</strong> built by tradesmen. In order to streng<strong>the</strong>n <strong>the</strong> building tradition <strong>of</strong> builders,<br />
training in hurricane resistant construction practices should be available to <strong>the</strong>m. Efforts are<br />
underway to carry out training in <strong>the</strong> affected areas, but this needs streng<strong>the</strong>ning <strong>and</strong> application<br />
across <strong>the</strong> country. An area <strong>of</strong> emphasis should be promoting <strong>the</strong> use <strong>of</strong> certified/qualified<br />
builders or tradesmen during construction.<br />
Objectives<br />
1. To develop relevant courses for building tradesmen in disaster resistant construction<br />
methods <strong>and</strong> <strong>of</strong>fer <strong>the</strong> courses at <strong>the</strong> local <strong>and</strong> national levels<br />
2. To upgrade <strong>and</strong> reprint <strong>and</strong> disseminate training manual<br />
3. To create a register <strong>of</strong> qualified construction workers<br />
HEART Trust NTA will be integral to <strong>the</strong> designing; delivery <strong>and</strong> institutionalization <strong>of</strong> <strong>the</strong><br />
courses.<br />
87
PROJECT TITLE:<br />
REDUCING VULNERABILITY IN SELECTED COASTAL COMMUNITIES –<br />
TOWARDS INTEGRATED PLANNING FOR THE COASTAL FISHING<br />
COMMUNITIES<br />
The Problem<br />
The coastal zone in Jamaica is rich in natural resources <strong>and</strong> <strong>the</strong>y attract many Jamaicans who<br />
exploit <strong>the</strong>m for a livelihood. As a result many settlements have developed within <strong>the</strong> coastal<br />
areas evolving into communities directly or indirectly dependent on <strong>the</strong> coastal resources.<br />
Coastal areas are, in general, highly vulnerable to natural hazards such as hurricanes <strong>and</strong> storm<br />
surges. Fur<strong>the</strong>r, exacerbating this vulnerability is <strong>the</strong> fact that many <strong>of</strong> <strong>the</strong>se areas are<br />
characterised by high levels <strong>of</strong> poverty <strong>and</strong> indiscriminate l<strong>and</strong> use practices.<br />
Over <strong>the</strong> years, many <strong>of</strong> <strong>the</strong>se coastal settlements have been frequently damaged by storm<br />
events, resulting in loss <strong>of</strong> lives, livelihood, <strong>and</strong> infrastructure. Among <strong>the</strong> communities that<br />
have been most affected are: Old Harbour Bay, St. Ca<strong>the</strong>rine; <strong>and</strong> Rocky Point/Portl<strong>and</strong> Cottage,<br />
Clarendon. Over <strong>the</strong> last five years <strong>the</strong>se areas have been <strong>impact</strong>ed by two intense hurricanes,<br />
Hurricane Ivan (2004) <strong>and</strong> Hurricane Dean (2007). These communities which are dependent on<br />
fishing for <strong>economic</strong> survival have suffered significant disruptions to <strong>the</strong>ir livelihood. O<strong>the</strong>r<br />
<strong>impact</strong>s included loss <strong>of</strong> lives, widespread damage to ro<strong>of</strong>s <strong>and</strong> roads, damage to infrastructure<br />
<strong>and</strong> fishing equipment, <strong>and</strong> coastal ecosystem damage. Without appropriate interventions to<br />
improve <strong>the</strong> resilience <strong>of</strong> <strong>the</strong>se communities, <strong>the</strong>ir sustainability (social, <strong>economic</strong> <strong>and</strong><br />
<strong>environmental</strong>) will be threatened.<br />
Project Objective<br />
To improve <strong>the</strong> resilience <strong>of</strong> selected coastal communities through implementation <strong>of</strong> a multisector<br />
integrated project with measures to mitigate <strong>and</strong> adapt to hazard risks, improve <strong>socio</strong><strong>economic</strong><br />
status<br />
88
Major Components<br />
1. Evaluation <strong>of</strong> housing stock to determine resistance to multiple hazards.<br />
2. Assessment <strong>of</strong> <strong>environmental</strong> conditions <strong>of</strong> Rocky Point <strong>and</strong> Old Harbour Bay Fishing<br />
Beaches.<br />
3. Examination <strong>of</strong> livelihoods structure Rocky Point <strong>and</strong> Old Harbour Bay Fishers<br />
Key Project Outputs<br />
1. Coastal residential construction manual<br />
2. Environmental Management Plan<br />
3. Livelihoods Improvement Strategy<br />
Duration: 6 months<br />
PROJECT TITLE: AGRICULTURAL CROP REHABILITATION<br />
Sector - Agriculture<br />
The direct <strong>and</strong> indirect <strong>assessment</strong> <strong>of</strong> <strong>the</strong> agricultural sector revealed a loss to <strong>the</strong> sector <strong>of</strong> $3.76<br />
billion. Domestic crop production was <strong>the</strong> major area <strong>of</strong> devastation which suffered losses <strong>of</strong><br />
just over $900 million, <strong>and</strong> c<strong>of</strong>fee, sugar <strong>and</strong> banana with $855, $802 <strong>and</strong> $525 million<br />
respectively. Approximately 80 per cent <strong>of</strong> <strong>the</strong> isl<strong>and</strong>’s greenhouses were destroyed. The main<br />
goal <strong>of</strong> <strong>the</strong> project is to allow farmers to recover from <strong>the</strong> damage <strong>and</strong> to build more resilience<br />
into <strong>the</strong>ir operations. The project will focus on a programme <strong>of</strong> resuscitation <strong>of</strong> domestic<br />
agriculture <strong>and</strong> tree crop rehabilitation, restoration <strong>of</strong> damaged greenhouses <strong>and</strong> introduction <strong>of</strong><br />
some resistant greenhouse construction techniques.<br />
89
PROJECT: SCHOOL REHABILITATION<br />
Sector - Education<br />
Damage to <strong>the</strong> education sector amounted to $727.86 million. The <strong>impact</strong> <strong>of</strong> <strong>the</strong> Hurricane was<br />
extensive with 518 schools being affected across 13 parishes. Most <strong>of</strong> <strong>the</strong> <strong>impact</strong> to schools<br />
involved ro<strong>of</strong> damage. The temporary measures put in place to address <strong>the</strong> problem have helped<br />
considerably to facilitate <strong>the</strong> reopening <strong>of</strong> schools. However, <strong>the</strong>re needs to be a structured<br />
programme to facilitate more sustained repair to <strong>the</strong> schools.<br />
These projects should include a component for <strong>the</strong> rehabilitation <strong>of</strong> recognized basic schools as a<br />
large number <strong>of</strong> <strong>the</strong>se schools were damaged. Investment here would be consistent with <strong>the</strong><br />
GOJ’s emphasis on improving educational facilities, <strong>and</strong> especially early childhood facilities.<br />
90