assessment of the socio-economic and environmental impact
assessment of the socio-economic and environmental impact
assessment of the socio-economic and environmental impact

Create successful ePaper yourself
Turn your PDF publications into a flip-book with our unique Google optimized e-Paper software.
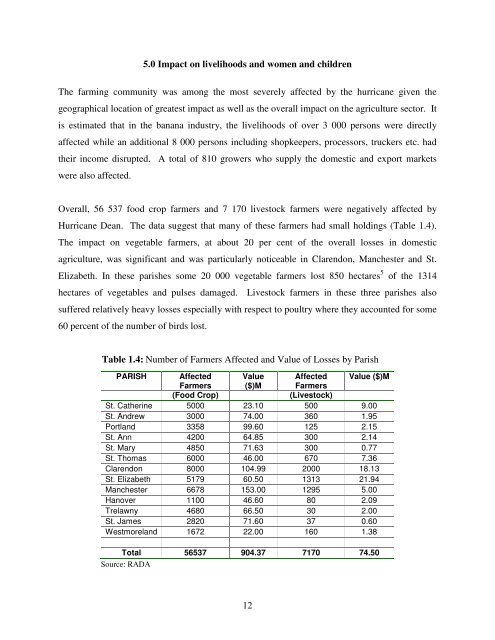
5.0 Impact on livelihoods <strong>and</strong> women <strong>and</strong> children<br />
The farming community was among <strong>the</strong> most severely affected by <strong>the</strong> hurricane given <strong>the</strong><br />
geographical location <strong>of</strong> greatest <strong>impact</strong> as well as <strong>the</strong> overall <strong>impact</strong> on <strong>the</strong> agriculture sector. It<br />
is estimated that in <strong>the</strong> banana industry, <strong>the</strong> livelihoods <strong>of</strong> over 3 000 persons were directly<br />
affected while an additional 8 000 persons including shopkeepers, processors, truckers etc. had<br />
<strong>the</strong>ir income disrupted. A total <strong>of</strong> 810 growers who supply <strong>the</strong> domestic <strong>and</strong> export markets<br />
were also affected.<br />
Overall, 56 537 food crop farmers <strong>and</strong> 7 170 livestock farmers were negatively affected by<br />
Hurricane Dean. The data suggest that many <strong>of</strong> <strong>the</strong>se farmers had small holdings (Table 1.4).<br />
The <strong>impact</strong> on vegetable farmers, at about 20 per cent <strong>of</strong> <strong>the</strong> overall losses in domestic<br />
agriculture, was significant <strong>and</strong> was particularly noticeable in Clarendon, Manchester <strong>and</strong> St.<br />
Elizabeth. In <strong>the</strong>se parishes some 20 000 vegetable farmers lost 850 hectares 5 <strong>of</strong> <strong>the</strong> 1314<br />
hectares <strong>of</strong> vegetables <strong>and</strong> pulses damaged. Livestock farmers in <strong>the</strong>se three parishes also<br />
suffered relatively heavy losses especially with respect to poultry where <strong>the</strong>y accounted for some<br />
60 percent <strong>of</strong> <strong>the</strong> number <strong>of</strong> birds lost.<br />
Table 1.4: Number <strong>of</strong> Farmers Affected <strong>and</strong> Value <strong>of</strong> Losses by Parish<br />
PARISH Affected Value Affected Value ($)M<br />
Farmers ($)M Farmers<br />
(Food Crop)<br />
(Livestock)<br />
St. Ca<strong>the</strong>rine 5000 23.10 500 9.00<br />
St. Andrew 3000 74.00 360 1.95<br />
Portl<strong>and</strong> 3358 99.60 125 2.15<br />
St. Ann 4200 64.85 300 2.14<br />
St. Mary 4850 71.63 300 0.77<br />
St. Thomas 6000 46.00 670 7.36<br />
Clarendon 8000 104.99 2000 18.13<br />
St. Elizabeth 5179 60.50 1313 21.94<br />
Manchester 6678 153.00 1295 5.00<br />
Hanover 1100 46.60 80 2.09<br />
Trelawny 4680 66.50 30 2.00<br />
St. James 2820 71.60 37 0.60<br />
Westmorel<strong>and</strong> 1672 22.00 160 1.38<br />
Total 56537 904.37 7170 74.50<br />
Source: RADA<br />
12