assessment of the socio-economic and environmental impact
assessment of the socio-economic and environmental impact
assessment of the socio-economic and environmental impact

You also want an ePaper? Increase the reach of your titles
YUMPU automatically turns print PDFs into web optimized ePapers that Google loves.
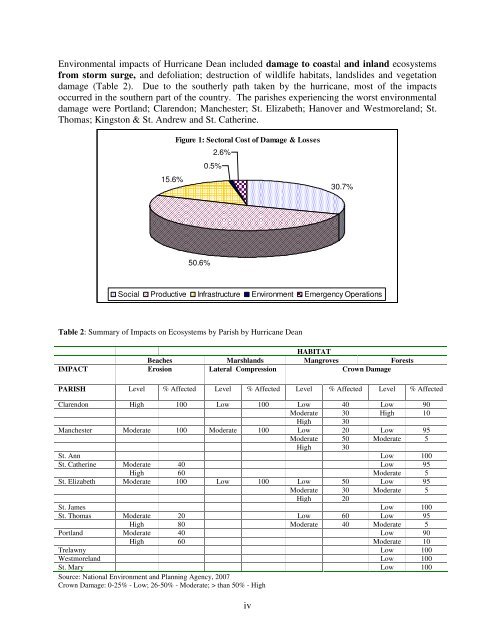
Environmental <strong>impact</strong>s <strong>of</strong> Hurricane Dean included damage to coastal <strong>and</strong> inl<strong>and</strong> ecosystems<br />
from storm surge, <strong>and</strong> defoliation; destruction <strong>of</strong> wildlife habitats, l<strong>and</strong>slides <strong>and</strong> vegetation<br />
damage (Table 2). Due to <strong>the</strong> sou<strong>the</strong>rly path taken by <strong>the</strong> hurricane, most <strong>of</strong> <strong>the</strong> <strong>impact</strong>s<br />
occurred in <strong>the</strong> sou<strong>the</strong>rn part <strong>of</strong> <strong>the</strong> country. The parishes experiencing <strong>the</strong> worst <strong>environmental</strong><br />
damage were Portl<strong>and</strong>; Clarendon; Manchester; St. Elizabeth; Hanover <strong>and</strong> Westmorel<strong>and</strong>; St.<br />
Thomas; Kingston & St. Andrew <strong>and</strong> St. Ca<strong>the</strong>rine.<br />
Figure 1: Sectoral Cost <strong>of</strong> Damage & Losses<br />
2.6%<br />
0.5%<br />
15.6%<br />
30.7%<br />
50.6%<br />
Social Productive Infrastructure Environment Emergency Operations<br />
Table 2: Summary <strong>of</strong> Impacts on Ecosystems by Parish by Hurricane Dean<br />
HABITAT<br />
Beaches Marshl<strong>and</strong>s Mangroves Forests<br />
IMPACT Erosion Lateral Compression Crown Damage<br />
PARISH Level % Affected Level % Affected Level % Affected Level % Affected<br />
Clarendon High 100 Low 100 Low 40 Low 90<br />
Moderate 30 High 10<br />
High 30<br />
Manchester Moderate 100 Moderate 100 Low 20 Low 95<br />
Moderate 50 Moderate 5<br />
High 30<br />
St. Ann Low 100<br />
St. Ca<strong>the</strong>rine Moderate 40 Low 95<br />
High 60 Moderate 5<br />
St. Elizabeth Moderate 100 Low 100 Low 50 Low 95<br />
Moderate 30 Moderate 5<br />
High 20<br />
St. James Low 100<br />
St. Thomas Moderate 20 Low 60 Low 95<br />
High 80 Moderate 40 Moderate 5<br />
Portl<strong>and</strong> Moderate 40 Low 90<br />
High 60 Moderate 10<br />
Trelawny Low 100<br />
Westmorel<strong>and</strong> Low 100<br />
St. Mary Low 100<br />
Source: National Environment <strong>and</strong> Planning Agency, 2007<br />
Crown Damage: 0-25% - Low; 26-50% - Moderate; > than 50% - High<br />
iv