assessment of the socio-economic and environmental impact
assessment of the socio-economic and environmental impact
assessment of the socio-economic and environmental impact

Create successful ePaper yourself
Turn your PDF publications into a flip-book with our unique Google optimized e-Paper software.
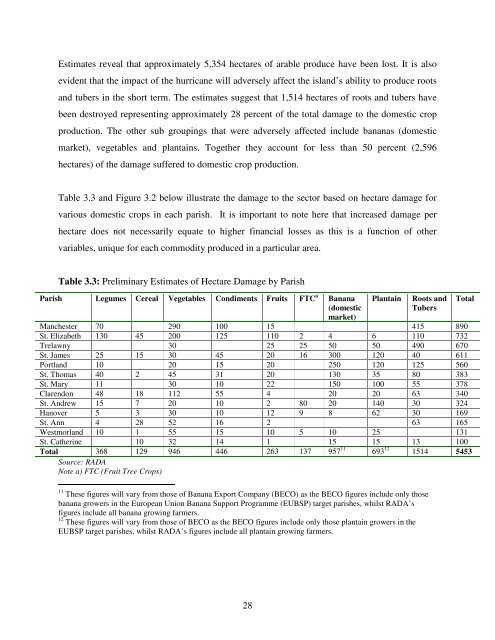
Estimates reveal that approximately 5,354 hectares <strong>of</strong> arable produce have been lost. It is also<br />
evident that <strong>the</strong> <strong>impact</strong> <strong>of</strong> <strong>the</strong> hurricane will adversely affect <strong>the</strong> isl<strong>and</strong>’s ability to produce roots<br />
<strong>and</strong> tubers in <strong>the</strong> short term. The estimates suggest that 1,514 hectares <strong>of</strong> roots <strong>and</strong> tubers have<br />
been destroyed representing approximately 28 percent <strong>of</strong> <strong>the</strong> total damage to <strong>the</strong> domestic crop<br />
production. The o<strong>the</strong>r sub groupings that were adversely affected include bananas (domestic<br />
market), vegetables <strong>and</strong> plantains. Toge<strong>the</strong>r <strong>the</strong>y account for less than 50 percent (2,596<br />
hectares) <strong>of</strong> <strong>the</strong> damage suffered to domestic crop production.<br />
Table 3.3 <strong>and</strong> Figure 3.2 below illustrate <strong>the</strong> damage to <strong>the</strong> sector based on hectare damage for<br />
various domestic crops in each parish. It is important to note here that increased damage per<br />
hectare does not necessarily equate to higher financial losses as this is a function <strong>of</strong> o<strong>the</strong>r<br />
variables, unique for each commodity produced in a particular area.<br />
Table 3.3: Preliminary Estimates <strong>of</strong> Hectare Damage by Parish<br />
Parish Legumes Cereal Vegetables Condiments Fruits FTC a Banana<br />
(domestic<br />
market)<br />
Plantain<br />
Roots <strong>and</strong><br />
Tubers<br />
Manchester 70 290 100 15 415 890<br />
St. Elizabeth 130 45 200 125 110 2 4 6 110 732<br />
Trelawny 30 25 25 50 50 490 670<br />
St. James 25 15 30 45 20 16 300 120 40 611<br />
Portl<strong>and</strong> 10 20 15 20 250 120 125 560<br />
St. Thomas 40 2 45 31 20 130 35 80 383<br />
St. Mary 11 30 10 22 150 100 55 378<br />
Clarendon 48 18 112 55 4 20 20 63 340<br />
St. Andrew 15 7 20 10 2 80 20 140 30 324<br />
Hanover 5 3 30 10 12 9 8 62 30 169<br />
St. Ann 4 28 52 16 2 63 165<br />
Westmorl<strong>and</strong> 10 1 55 15 10 5 10 25 131<br />
St. Ca<strong>the</strong>rine 10 32 14 1 15 15 13 100<br />
Total 368 129 946 446 263 137 957 11 693 12 1514 5453<br />
Source: RADA<br />
Note a) FTC (Fruit Tree Crops)<br />
Total<br />
11 These figures will vary from those <strong>of</strong> Banana Export Company (BECO) as <strong>the</strong> BECO figures include only those<br />
banana growers in <strong>the</strong> European Union Banana Support Programme (EUBSP) target parishes, whilst RADA’s<br />
figures include all banana growing farmers.<br />
12 These figures will vary from those <strong>of</strong> BECO as <strong>the</strong> BECO figures include only those plantain growers in <strong>the</strong><br />
EUBSP target parishes, whilst RADA’s figures include all plantain growing farmers.<br />
28