assessment of the socio-economic and environmental impact
assessment of the socio-economic and environmental impact
assessment of the socio-economic and environmental impact

Create successful ePaper yourself
Turn your PDF publications into a flip-book with our unique Google optimized e-Paper software.
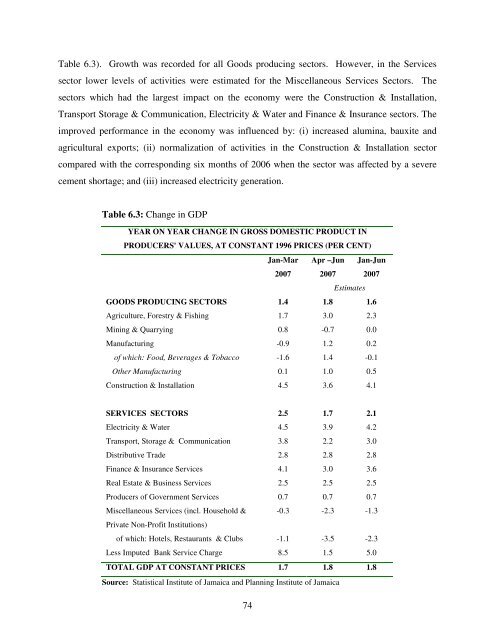
Table 6.3). Growth was recorded for all Goods producing sectors. However, in <strong>the</strong> Services<br />
sector lower levels <strong>of</strong> activities were estimated for <strong>the</strong> Miscellaneous Services Sectors. The<br />
sectors which had <strong>the</strong> largest <strong>impact</strong> on <strong>the</strong> economy were <strong>the</strong> Construction & Installation,<br />
Transport Storage & Communication, Electricity & Water <strong>and</strong> Finance & Insurance sectors. The<br />
improved performance in <strong>the</strong> economy was influenced by: (i) increased alumina, bauxite <strong>and</strong><br />
agricultural exports; (ii) normalization <strong>of</strong> activities in <strong>the</strong> Construction & Installation sector<br />
compared with <strong>the</strong> corresponding six months <strong>of</strong> 2006 when <strong>the</strong> sector was affected by a severe<br />
cement shortage; <strong>and</strong> (iii) increased electricity generation.<br />
Table 6.3: Change in GDP<br />
YEAR ON YEAR CHANGE IN GROSS DOMESTIC PRODUCT IN<br />
PRODUCERS' VALUES, AT CONSTANT 1996 PRICES (PER CENT)<br />
Jan-Mar<br />
2007<br />
Apr –Jun<br />
2007<br />
Jan-Jun<br />
2007<br />
Estimates<br />
GOODS PRODUCING SECTORS 1.4 1.8 1.6<br />
Agriculture, Forestry & Fishing 1.7 3.0 2.3<br />
Mining & Quarrying 0.8 -0.7 0.0<br />
Manufacturing -0.9 1.2 0.2<br />
<strong>of</strong> which: Food, Beverages & Tobacco -1.6 1.4 -0.1<br />
O<strong>the</strong>r Manufacturing 0.1 1.0 0.5<br />
Construction & Installation 4.5 3.6 4.1<br />
SERVICES SECTORS 2.5 1.7 2.1<br />
Electricity & Water 4.5 3.9 4.2<br />
Transport, Storage & Communication 3.8 2.2 3.0<br />
Distributive Trade 2.8 2.8 2.8<br />
Finance & Insurance Services 4.1 3.0 3.6<br />
Real Estate & Business Services 2.5 2.5 2.5<br />
Producers <strong>of</strong> Government Services 0.7 0.7 0.7<br />
Miscellaneous Services (incl. Household & -0.3 -2.3 -1.3<br />
Private Non-Pr<strong>of</strong>it Institutions)<br />
<strong>of</strong> which: Hotels, Restaurants & Clubs -1.1 -3.5 -2.3<br />
Less Imputed Bank Service Charge 8.5 1.5 5.0<br />
TOTAL GDP AT CONSTANT PRICES 1.7 1.8 1.8<br />
Source: Statistical Institute <strong>of</strong> Jamaica <strong>and</strong> Planning Institute <strong>of</strong> Jamaica<br />
74