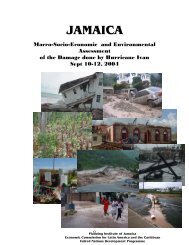
assessment of the socio-economic and environmental impact
assessment of the socio-economic and environmental impact
assessment of the socio-economic and environmental impact

You also want an ePaper? Increase the reach of your titles
YUMPU automatically turns print PDFs into web optimized ePapers that Google loves.
esulting from falling concrete block, flying debris, wind effect <strong>and</strong> ro<strong>of</strong> collapse <strong>and</strong> two<br />
indirect deaths from electrocution. Hospital <strong>and</strong> sentinel surveillance sites reported 628 injuries<br />
between August 19 <strong>and</strong> 25.<br />
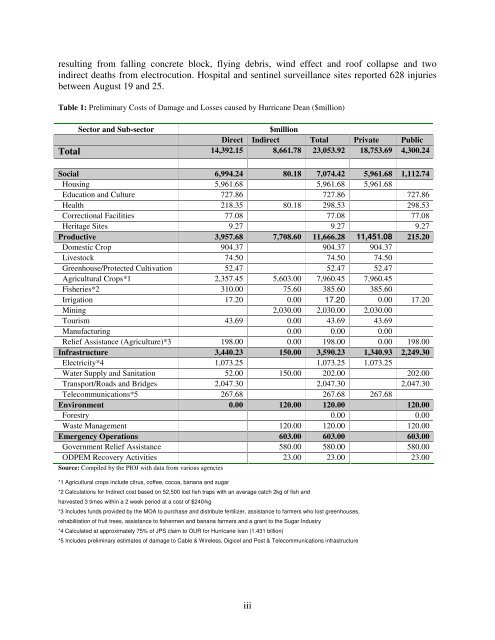
Table 1: Preliminary Costs <strong>of</strong> Damage <strong>and</strong> Losses caused by Hurricane Dean ($million)<br />
Sector <strong>and</strong> Sub-sector<br />
$million<br />
Direct Indirect Total Private Public<br />
Total 14,392.15 8,661.78 23,053.92 18,753.69 4,300.24<br />
Social 6,994.24 80.18 7,074.42 5,961.68 1,112.74<br />
Housing 5,961.68 5,961.68 5,961.68<br />
Education <strong>and</strong> Culture 727.86 727.86 727.86<br />
Health 218.35 80.18 298.53 298.53<br />
Correctional Facilities 77.08 77.08 77.08<br />
Heritage Sites 9.27 9.27 9.27<br />
Productive 3,957.68 7,708.60 11,666.28 11,451.08 215.20<br />
Domestic Crop 904.37 904.37 904.37<br />
Livestock 74.50 74.50 74.50<br />
Greenhouse/Protected Cultivation 52.47 52.47 52.47<br />
Agricultural Crops*1 2,357.45 5,603.00 7,960.45 7,960.45<br />
Fisheries*2 310.00 75.60 385.60 385.60<br />
Irrigation 17.20 0.00 17.20 0.00 17.20<br />
Mining 2,030.00 2,030.00 2,030.00<br />
Tourism 43.69 0.00 43.69 43.69<br />
Manufacturing 0.00 0.00 0.00<br />
Relief Assistance (Agriculture)*3 198.00 0.00 198.00 0.00 198.00<br />
Infrastructure 3,440.23 150.00 3,590.23 1,340.93 2,249.30<br />
Electricity*4 1,073.25 1,073.25 1,073.25<br />
Water Supply <strong>and</strong> Sanitation 52.00 150.00 202.00 202.00<br />
Transport/Roads <strong>and</strong> Bridges 2,047.30 2,047.30 2,047.30<br />
Telecommunications*5 267.68 267.68 267.68<br />
Environment 0.00 120.00 120.00 120.00<br />
Forestry 0.00 0.00<br />
Waste Management 120.00 120.00 120.00<br />
Emergency Operations 603.00 603.00 603.00<br />
Government Relief Assistance 580.00 580.00 580.00<br />
ODPEM Recovery Activities 23.00 23.00 23.00<br />
Source: Compiled by <strong>the</strong> PIOJ with data from various agencies<br />
*1 Agricultural crops include citrus, c<strong>of</strong>fee, cocoa, banana <strong>and</strong> sugar<br />
*2 Calculations for Indirect cost based on 52,500 lost fish traps with an average catch 2kg <strong>of</strong> fish <strong>and</strong><br />
harvested 3 times within a 2 week period at a cost <strong>of</strong> $240/kg<br />
*3 Includes funds provided by <strong>the</strong> MOA to purchase <strong>and</strong> distribute fertilizer, assistance to farmers who lost greenhouses,<br />
rehabilitation <strong>of</strong> fruit trees, assistance to fishermen <strong>and</strong> banana farmers <strong>and</strong> a grant to <strong>the</strong> Sugar Industry<br />
*4 Calculated at approximately 75% <strong>of</strong> JPS claim to OUR for Hurricane Ivan (1.431 billion)<br />
*5 Includes preliminary estimates <strong>of</strong> damage to Cable & Wireless, Digicel <strong>and</strong> Post & Telecommunications infrastructure<br />
iii