BCG Clean Truck Program Analysis - The Port of Los Angeles
BCG Clean Truck Program Analysis - The Port of Los Angeles
BCG Clean Truck Program Analysis - The Port of Los Angeles

Create successful ePaper yourself
Turn your PDF publications into a flip-book with our unique Google optimized e-Paper software.
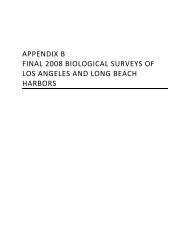
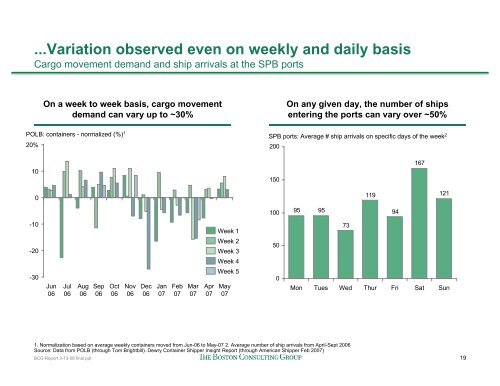
...Variation observed even on weekly and daily basis<br />
Cargo movement demand and ship arrivals at the SPB ports<br />
On a week to week basis, cargo movement<br />
demand can vary up to ~30%<br />
POLB: containers - normalized (%) 1<br />
20%<br />
On any given day, the number <strong>of</strong> ships<br />
entering the ports can vary over ~50%<br />
SPB ports: Average # ship arrivals on specific days <strong>of</strong> the week 2<br />
200<br />
10<br />
150<br />
167<br />
0<br />
119<br />
121<br />
100<br />
95<br />
95<br />
94<br />
-10<br />
-20<br />
-30<br />
Jun<br />
06<br />
Jul<br />
06<br />
Aug<br />
06<br />
Sep<br />
06<br />
Oct<br />
06<br />
Nov<br />
06<br />
Dec<br />
06<br />
Jan<br />
07<br />
Feb<br />
07<br />
Mar<br />
07<br />
Apr<br />
07<br />
Week 1<br />
Week 2<br />
Week 3<br />
Week 4<br />
Week 5<br />
May<br />
07<br />
50<br />
0<br />
73<br />
Mon Tues Wed Thur Fri Sat Sun<br />
1. Normalization based on average weekly containers moved from Jun-06 to May-07 2. Average number <strong>of</strong> ship arrivals from April-Sept 2006<br />
Source: Data from POLB (through Tom Brightbill). Dewry Container Shipper Insight Report (through American Shipper Feb 2007)<br />
<strong>BCG</strong> Report 3-13-08 final.ppt<br />
19