BCG Clean Truck Program Analysis - The Port of Los Angeles
BCG Clean Truck Program Analysis - The Port of Los Angeles
BCG Clean Truck Program Analysis - The Port of Los Angeles

Create successful ePaper yourself
Turn your PDF publications into a flip-book with our unique Google optimized e-Paper software.
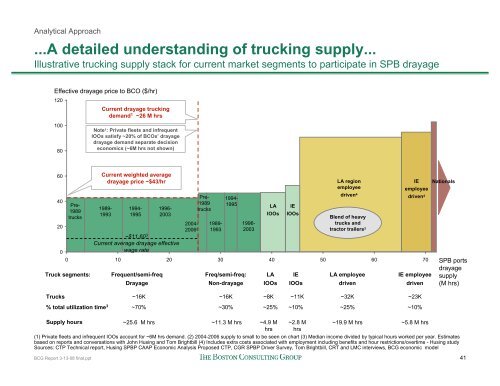
Analytical Approach<br />
...A detailed understanding <strong>of</strong> trucking supply...<br />
Illustrative trucking supply stack for current market segments to participate in SPB drayage<br />
Effective drayage price to BCO ($/hr)<br />
120<br />
100<br />
80<br />
Current drayage trucking<br />
demand 1 ~26 M hrs<br />
Note 1 : Private fleets and infrequent<br />
IOOs satisfy ~20% <strong>of</strong> BCOs’ drayage<br />
drayage demand separate decision<br />
economics (~6M hrs not shown)<br />
60<br />
40<br />
20<br />
0<br />
Pre-<br />
1989<br />
trucks<br />
Current weighted average<br />
drayage price ~$43/hr<br />
1989-<br />
1993<br />
1994-<br />
1995<br />
1996-<br />
2003<br />
~$11.60 3<br />
Current average drayage effective<br />
wage rate<br />
2004-<br />
Pre-<br />
1989<br />
trucks<br />
1989-<br />
1993<br />
1994-<br />
1995<br />
1996-<br />
2003<br />
0 10 20 30 40 50 60 70 SPB ports<br />
drayage<br />
<strong>Truck</strong> segments: Frequent/semi-freq<br />
Drayage<br />
Freq/semi-freq:<br />
Non-drayage<br />
LA<br />
IOOs<br />
IE<br />
IOOs<br />
LA employee<br />
driven<br />
IE employee<br />
driven<br />
supply<br />
(M hrs)<br />
LA<br />
IOOs<br />
IE<br />
IOOs<br />
LA region<br />
employee<br />
driven 4<br />
Blend <strong>of</strong> heavy<br />
trucks and<br />
tractor trailers 3<br />
IE Nationals<br />
employee<br />
driven 4<br />
2006 2 ~25%<br />
<strong>Truck</strong>s ~16K<br />
~16K ~8K ~11K ~32K ~23K<br />
% total utilization time 3 ~70%<br />
Supply hours<br />
~25.6 M hrs<br />
(1) Private fleets and infrequent IOOs account for ~6M hrs demand. (2) 2004-2006 supply to small to be seen on chart (3) Median income divided by typical hours worked per year. Estimates<br />
based on reports and conversations with John Husing and Tom Brightbill (4) Includes extra costs associated with employment including benefits and hour restrictions/overtime - Husing study<br />
Sources: CTP Technical report, Husing SPBP CAAP Economic <strong>Analysis</strong> Proposed CTP, CGR SPBP Driver Survey, Tom Brightbill, CRT and LMC interviews, <strong>BCG</strong> economic model<br />
<strong>BCG</strong> Report 3-13-08 final.ppt<br />
~30%<br />
~11.3 M hrs<br />
~4.9 M<br />
hrs<br />
~10%<br />
~2.8 M<br />
hrs<br />
~25%<br />
~19.9 M hrs<br />
~10%<br />
~5.8 M hrs<br />
41