Section 2 – Historic and Forecast Data Statewide Review <strong>Pennsylvania</strong>’s aggregate retail electricity sales in 2010 totaled 144,119 gigawatthours (GWh), 46 a 3.3 percent increase from that of 2009, while the number of customers increased by 0.3 percent. Residential sales represented 36.1 percent of the total sales, followed by industrial (35.1 percent) and commercial (26.9 percent). Aggregate non-coincident peak load 47 increased to 29,515 MW in 2010, an increase of 7.0 percent over 2009. Tables 5 and 6 provide statistics for 2010 and 2009. It is noted that several EDCs have redefined their commercial and industrial (C&I) customers into small C&I and large C&I. Thus, comparisons with historical data are not valid for these sectors. Table 5 PA EDCs' energy demand, peak load and customers served (2010) Total Sales For Total System Company Net Energy Peak Customers Residential Commercial Industrial Other Resale Consumption Losses Use For Load Load Company Served (MWh) (MWh) (MWh) (MWh) (MWh) (MWh) (MWh) (MWh) (MWh) (MW) Duquesne 578,094 4,326,761 6,712,326 2,987,278 63,598 19,998 14,109,961 701,201 29,199 14,840,361 2,889 Met-Ed 552,594 5,666,240 3,006,378 5,288,187 35,436 0 13,996,241 793,215 12,563 14,802,019 2,715 Penelec 590,712 4,655,812 3,670,566 5,748,044 41,969 0 14,116,391 955,381 4,141 15,075,913 2,659 Penn <strong>Power</strong> 160,116 1,696,442 1,311,186 1,488,033 6,434 0 4,502,095 191,470 1,947 4,695,512 903 PPL 1,401,274 14,205,788 10,667,407 12,045,496 0 0 36,918,691 2,662,968 66,975 39,648,634 7,365 PECO 1,566,873 13,895,996 8,472,056 15,823,964 924,797 808,446 39,925,259 2,225,117 53,184 42,203,560 8,864 West Penn 716,115 7,401,268 4,983,018 7,617,476 48,923 768,307 20,818,992 1,447,475 -- 22,266,467 3,838 UGI 62,250 533,472 332,493 108,999 5,683 98 980,745 53,600 2,092 1,036,437 198 Citizens' 6,814 80,611 28,303 49,007 653 0 158,574 8,139 202 166,915 46 Pike County 4,661 29,110 44,743 0 419 0 74,272 4,112 16 78,400 18 Wellsboro 6,151 42,539 29,543 42,598 227 9 114,916 7,985 302 123,203 20 Total 5,645,654 52,534,039 39,258,019 51,199,082 1,128,139 1,596,858 145,716,137 9,050,663 170,621 154,937,421 29,515 % of Total 36.05% 26.94% 35.14% 0.77% 1.10% 100.00% Table 6 PA EDCs' energy demand, peak load and customers served (2009) Total Sales For Total System Company Net Energy Peak Customers Residential Commercial Industrial Other Resale Consumption Losses Use For Load Load Company Served (MWh) (MWh) (MWh) (MWh) (MWh) (MWh) (MWh) (MWh) (MWh) (MW) Duquesne 586,616 3,945,655 6,537,414 2,616,153 64,351 21,849 13,185,422 662,150 30,441 13,878,013 2,732 Met-Ed 551,283 5,448,240 4,568,227 3,438,601 34,487 0 13,489,555 895,908 13,633 14,399,096 2,739 Penelec 589,959 4,471,133 5,018,687 4,044,173 41,421 0 13,575,414 773,805 4,347 14,353,566 2,451 Penn <strong>Power</strong> 159,692 1,634,012 1,366,828 1,228,844 6,464 1,018 4,237,166 128,641 1,970 4,367,777 901 PPL 1,398,461 14,218,100 13,817,800 8,417,700 237,000 931,937 37,622,537 2,475,685 69,656 40,167,878 6,845 PECO 1,564,433 12,893,426 8,404,059 15,888,955 927,616 587,586 38,701,642 2,010,187 45,420 40,757,249 7,994 West Penn 714,974 7,100,611 4,880,026 7,285,694 49,114 739,915 20,055,360 1,118,642 -- 21,174,002 3,667 UGI 62,166 518,028 328,583 102,981 5,603 92 955,287 53,569 1,912 1,010,768 193 Citizens' 6,814 79,818 27,487 52,237 667 0 160,209 7,205 190 167,604 39 Pike County 4,649 28,077 44,699 0 404 0 73,180 4,954 17 78,151 15 Wellsboro 6,133 40,171 31,051 33,600 229 130 105,182 9,106 300 114,587 21 Total 5,627,584 50,229,205 44,921,624 43,023,101 1,366,056 2,282,397 141,822,383 8,118,587 167,379 150,108,349 27,597 % of Total 35.42% 31.67% 30.34% 0.96% 1.61% 100.00% 46 A GWh is equivalent to 1,000 MWh or 1,000,000 kWh. 47 Non-coincident peak load is the sum of EDCs’ annual peak loads regardless of their date or time of occurrence. <strong>Electric</strong> <strong>Power</strong> <strong>Outlook</strong> for <strong>Pennsylvania</strong> 2010-15 21
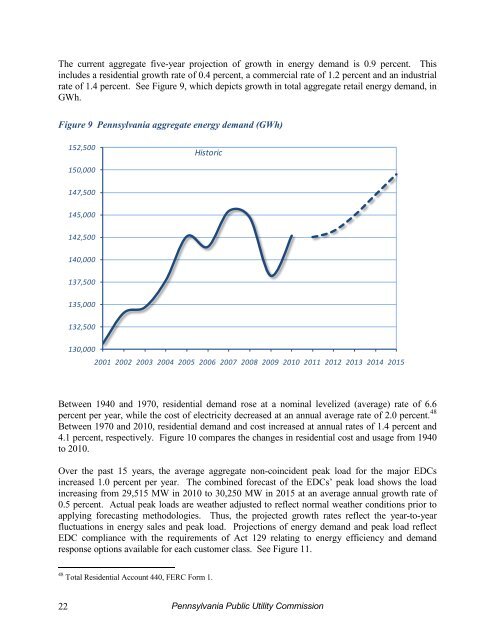
The current aggregate five-year projection of growth in energy demand is 0.9 percent. This includes a residential growth rate of 0.4 percent, a commercial rate of 1.2 percent and an industrial rate of 1.4 percent. See Figure 9, which depicts growth in total aggregate retail energy demand, in GWh. Figure 9 <strong>Pennsylvania</strong> aggregate energy demand (GWh) 152,500 Historic 150,000 147,500 145,000 142,500 140,000 137,500 135,000 132,500 130,000 2001 2002 2003 2004 2005 2006 2007 2008 2009 2010 2011 2012 2013 2014 2015 Between 1940 and 1970, residential demand rose at a nominal levelized (average) rate of 6.6 percent per year, while the cost of electricity decreased at an annual average rate of 2.0 percent. 48 Between 1970 and 2010, residential demand and cost increased at annual rates of 1.4 percent and 4.1 percent, respectively. Figure 10 compares the changes in residential cost and usage from 1940 to 2010. Over the past 15 years, the average aggregate non-coincident peak load for the major EDCs increased 1.0 percent per year. The combined forecast of the EDCs’ peak load shows the load increasing from 29,515 MW in 2010 to 30,250 MW in 2015 at an average annual growth rate of 0.5 percent. Actual peak loads are weather adjusted to reflect normal weather conditions prior to applying forecasting methodologies. Thus, the projected growth rates reflect the year-to-year fluctuations in energy sales and peak load. Projections of energy demand and peak load reflect EDC compliance with the requirements of Act 129 relating to energy efficiency and demand response options available for each customer class. See Figure 11. 48 Total Residential Account 440, FERC Form 1. 22 <strong>Pennsylvania</strong> <strong>Public</strong> <strong>Utility</strong> <strong>Commission</strong>