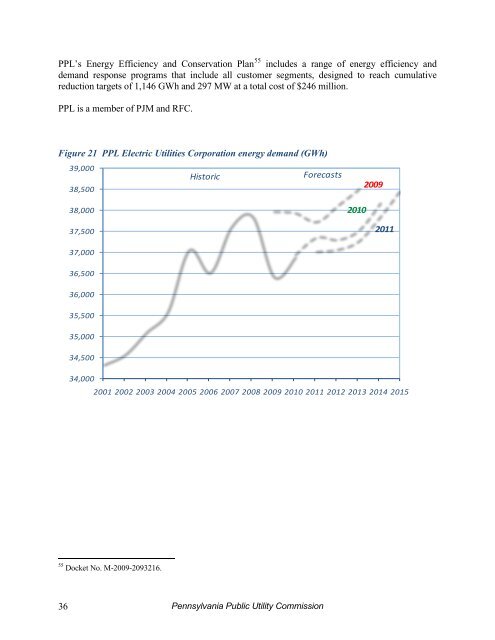
PPL <strong>Electric</strong> Utilities Corporation PPL <strong>Electric</strong> Utilities Corporation (PPL), a subsidiary of PPL Corporation, provides service to 1,401,274 homes and businesses over a 10,000- square-mile area in all or portions of 29 counties in Central Eastern <strong>Pennsylvania</strong>. In 2010, PPL had energy sales totaling 36,919 GWh—down 1.9 percent from 2009. Residential sales continued to dominate PPL's market with 38.5 percent of the total sales, followed by industrial (32.6 percent) and commercial (28.9 percent). These figures reflect a reclassification of commercial and industrial (C&I) customers; i.e., the commercial class now includes small C&I (non-residential secondary voltage), and the industrial class includes large C&I (primary and transmission voltage). Average annual use per residential customer was 11,666 kWh at an average cost of 10.27 cents per kWh; operating revenues totaled $2.5 billion. The current five-year projection of average growth in energy demand is 0.9 percent. This includes growth rates of 0.2 percent for residential, 1.5 percent for commercial and 1.0 percent for industrial, based on the redefined rate groups. See Figure 21. PPL's summer peak load, occurring on July 7, 2010, was 7,214 MW compared to the previous summer’s peak of 6,845 MW, or a 5.4 percent increase. The 2010-11 winter peak load was 7,365 MW, representing an increase of 8.3 percent from last year's winter peak of 6,800 MW. The actual average annual peak load growth rate over the past 15 years was 0.7 percent. PPL’s five-year winter peak load forecast scenario shows the peak load decreasing from 7,365 MW in 2010 to 7,101 MW in 2011 and then increasing to 7,282 MW in 2015 at an average annual rate of 0.5 percent. The current forecast for 2011 is 126 MW or 1.7 percent lower than the previous forecast. It is noted that PPL is normally winter peaking, but in some years the summer peak has exceeded the previous winter peak; the current forecast represents the annual peak load. See Figure 22. Tables A17-A20 in Appendix A provide PPL’s forecasts of peak load and residential, commercial and industrial energy demand, filed with the <strong>Commission</strong> in years 2001 through 2011. In 2010, PPL purchased 63 GWh from cogeneration and independent power production facilities, or 0.2 percent of net energy for load. For Calendar Year 2010, 45 EGSs supplied 23.7 GWh to retail customers in PPL’s service territory, representing 64.3 percent of total consumption. PPL has identified several transmission projects, including new construction and rebuilding of existing lines, with in-service dates through 2020. The projects involve 796 circuit miles at a total cost of $1.14 billion. The single largest project is the Susquehanna-Roseland Project, described in Section 1. <strong>Electric</strong> <strong>Power</strong> <strong>Outlook</strong> for <strong>Pennsylvania</strong> 2010-15 35
PPL’s Energy Efficiency and Conservation Plan 55 includes a range of energy efficiency and demand response programs that include all customer segments, designed to reach cumulative reduction targets of 1,146 GWh and 297 MW at a total cost of $246 million. PPL is a member of PJM and RFC. Figure 21 PPL <strong>Electric</strong> Utilities Corporation energy demand (GWh) 39,000 Historic Forecasts 38,500 38,000 37,500 2010 2009 2011 37,000 36,500 36,000 35,500 35,000 34,500 34,000 2001 2002 2003 2004 2005 2006 2007 2008 2009 2010 2011 2012 2013 2014 2015 55 Docket No. M-2009-2093216. 36 <strong>Pennsylvania</strong> <strong>Public</strong> <strong>Utility</strong> <strong>Commission</strong>