here - Rock Valley College
here - Rock Valley College
here - Rock Valley College

Create successful ePaper yourself
Turn your PDF publications into a flip-book with our unique Google optimized e-Paper software.
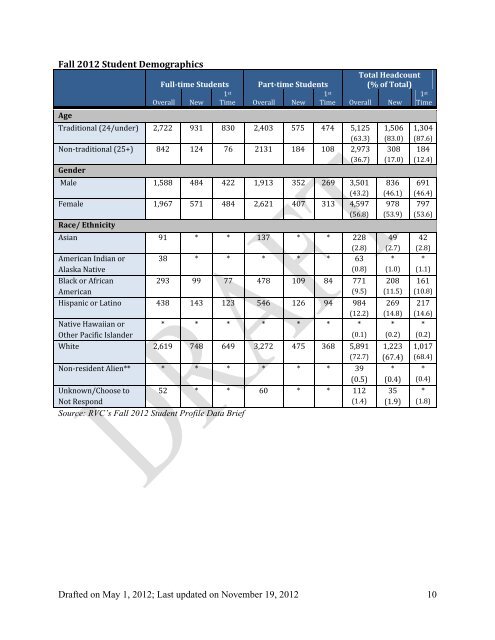
Fall 2012 Student Demographics<br />
Full‐time Students Part‐time Students<br />
Total Headcount<br />
(% of Total)<br />
1 st<br />
1 st<br />
1 st<br />
Overall New Time Overall New Time Overall New Time<br />
Age<br />
Traditional (24/under) 2,722 931 830 2,403 575 474 5,125<br />
(63.3)<br />
Non‐traditional (25+) 842 124 76 2131 184 108 2,973<br />
(36.7)<br />
Gender<br />
Male 1,588 484 422 1,913 352 269 3,501<br />
(43.2)<br />
Female 1,967 571 484 2,621 407 313 4,597<br />
(56.8)<br />
Race/ Ethnicity<br />
Asian 91 * * 137 * * 228<br />
(2.8)<br />
American Indian or 38 * * * * * 63<br />
Alaska Native<br />
(0.8)<br />
Black or African<br />
293 99 77 478 109 84 771<br />
American<br />
(9.5)<br />
Hispanic or Latino 438 143 123 546 126 94 984<br />
(12.2)<br />
Native Hawaiian or * * * * * * *<br />
Other Pacific Islander<br />
(0.1)<br />
White 2,619 748 649 3,272 475 368 5,891<br />
(72.7)<br />
Non‐resident Alien** * * * * * * 39<br />
(0.5)<br />
Unknown/Choose to 52 * * 60 * * 112<br />
Not Respond<br />
(1.4)<br />
Source: RVC’s Fall 2012 Student Profile Data Brief<br />
1,506<br />
(83.0)<br />
308<br />
(17.0)<br />
836<br />
(46.1)<br />
978<br />
(53.9)<br />
49<br />
(2.7)<br />
*<br />
(1.0)<br />
208<br />
(11.5)<br />
269<br />
(14.8)<br />
*<br />
(0.2)<br />
1,223<br />
(67.4)<br />
*<br />
(0.4)<br />
35<br />
(1.9)<br />
1,304<br />
(87.6)<br />
184<br />
(12.4)<br />
691<br />
(46.4)<br />
797<br />
(53.6)<br />
42<br />
(2.8)<br />
*<br />
(1.1)<br />
161<br />
(10.8)<br />
217<br />
(14.6)<br />
*<br />
(0.2)<br />
1,017<br />
(68.4)<br />
*<br />
(0.4)<br />
*<br />
(1.8)<br />
Drafted on May 1, 2012; Last updated on November 19, 2012 10