Global Tuberculosis Control 2010 - Florida Department of Health
Global Tuberculosis Control 2010 - Florida Department of Health
Global Tuberculosis Control 2010 - Florida Department of Health

You also want an ePaper? Increase the reach of your titles
YUMPU automatically turns print PDFs into web optimized ePapers that Google loves.
α=Ī Ī (1– Ī )<br />
– 1<br />
V<br />
β=(1– Ī ) Ī (1– Ī )<br />
– 1<br />
V<br />
ĪNV<br />
<br />
V= 0.3<br />
4<br />
N<br />
2<br />
<br />
<br />
α= – x – x (1– – x )<br />
V<br />
– 1<br />
β=(1– – x ) – x (1– – x )<br />
V<br />
– 1<br />
x – V<br />
(u – l) 2<br />
V=<br />
4<br />
l = 1, u = 4<br />
<br />
l = 0.01, u = 0.2<br />
<br />
l = 0.2, u = 2<br />
<br />
l = 0.01, u = 1<br />
<br />
<br />
<br />
ƒ (x; α, β) =<br />
x α–1 (1– x) β–1<br />
u α–1 (1– u) β–1 du<br />
1<br />
0<br />
<br />
<br />
<br />
<br />
Data were assessed using a three-step process. This<br />
started with a systematic assessment <strong>of</strong> data quality,<br />
including an assessment <strong>of</strong> the over-dispersion <strong>of</strong> count<br />
data over time and across regions/districts (or similar<br />
geographical areas). This was followed by exploration <strong>of</strong><br />
potential factors driving time-changes in case notifications<br />
(such as improvements in diagnostic capacity and<br />
the HIV epidemic), and then by assessment <strong>of</strong> the likely<br />
number <strong>of</strong> TB cases that are not notified. To facilitate<br />
the documentation <strong>of</strong> expert opinion, an “onion” framework<br />
1 was used. In this framework, different “layers”<br />
<strong>of</strong> the onion represent distinct populations <strong>of</strong> TB cases<br />
that are not captured by national TB information systems<br />
(for example, cases with no access to health care<br />
and cases with access to private health-care services but<br />
not reported to NTPs – see ).<br />
These methods are documented in a workbook available<br />
on the web site <strong>of</strong> the WHO <strong>Global</strong> Task Force on TB<br />
Impact Measurement. 2<br />
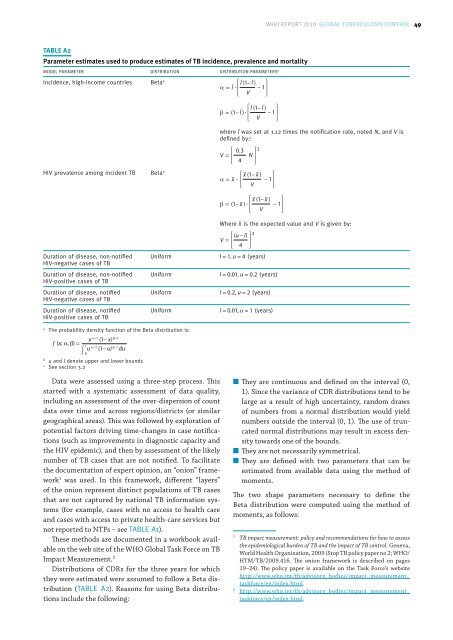
Distributions <strong>of</strong> CDRs for the three years for which<br />
they were estimated were assumed to follow a Beta distribution<br />
( ). Reasons for using Beta distributions<br />
include the following:<br />
They are continuous and defined on the interval (0,<br />
1). Since the variance <strong>of</strong> CDR distributions tend to be<br />
large as a result <strong>of</strong> high uncertainty, random draws<br />
<strong>of</strong> numbers from a normal distribution would yield<br />
numbers outside the interval (0, 1). The use <strong>of</strong> truncated<br />
normal distributions may result in excess density<br />
towards one <strong>of</strong> the bounds.<br />
They are not necessarily symmetrical.<br />
They are defined with two parameters that can be<br />
estimated from available data using the method <strong>of</strong><br />
moments.<br />
The two shape parameters necessary to define the<br />
Beta distribution were computed using the method <strong>of</strong><br />
moments, as follows:<br />
1<br />
TB impact measurement: policy and recommendations for how to assess<br />
the epidemiological burden <strong>of</strong> TB and the impact <strong>of</strong> TB control. Geneva,<br />
World <strong>Health</strong> Organization, 2009 (Stop TB policy paper no 2; WHO/<br />
HTM/TB/2009.416. The onion framework is described on pages<br />
19–24). The policy paper is available on the Task Force’s website<br />
http://www.who.int/tb/advisory_bodies/impact_measurement_<br />
taskforce/en/index.html.<br />
2<br />
http://www.who.int/tb/advisory_bodies/impact_measurement_<br />
taskforce/en/index.html.