Global Tuberculosis Control 2010 - Florida Department of Health
Global Tuberculosis Control 2010 - Florida Department of Health
Global Tuberculosis Control 2010 - Florida Department of Health

Create successful ePaper yourself
Turn your PDF publications into a flip-book with our unique Google optimized e-Paper software.
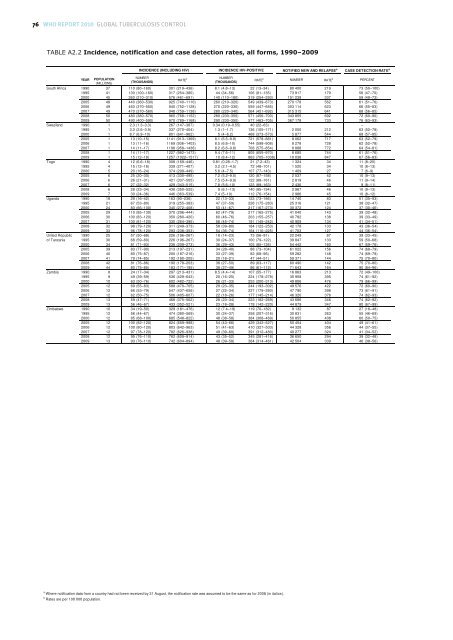
Estimated values are shown as best estimates followed<br />
by lower and upper bounds. The lower and upper<br />
bounds are defined as the 2.5th and 97.5th centiles <strong>of</strong><br />
outcome distributions produced in simulations.<br />
See for further details.<br />
Estimated numbers are shown rounded to two<br />
significant figures. Estimated rates are shown rounded<br />
to three significant figures unless the value is under<br />
100, in which case rates are shown rounded to two<br />
significant figures.<br />
Estimates for all years are recalculated as new<br />
information becomes available and techniques are<br />
refined, so they may differ from those published in<br />
previous reports in this series. Estimates published in<br />
previous global TB control reports should no longer be<br />
used.<br />
<br />
Graphs where displayed show data from all years within<br />
the range stated.<br />
<br />
Data shown in this annex are taken from the WHO<br />
global TB database on 31 August <strong>2010</strong>. Data shown<br />
in the main part <strong>of</strong> the report were taken from the<br />
database on 17 June <strong>2010</strong>. As a result, data in this<br />
annex may differ slightly from those in the main part <strong>of</strong><br />
the report.<br />
Data can be downloaded from www.who.int/tb/data.