Annual Monitoring Report 2007(6.6MB) - Scarborough Borough ...
Annual Monitoring Report 2007(6.6MB) - Scarborough Borough ...
Annual Monitoring Report 2007(6.6MB) - Scarborough Borough ...

Create successful ePaper yourself
Turn your PDF publications into a flip-book with our unique Google optimized e-Paper software.
<strong>Annual</strong> <strong>Monitoring</strong> <strong>Report</strong> <strong>2007</strong><br />
Total<br />
2000/2003<br />
9217<br />
2003/2004<br />
3287<br />
2004/2005<br />
2790<br />
Table 4.2 Completions on Committed and Allocated Sites (Square Metres)<br />
2005/2006<br />
0<br />
2006/<strong>2007</strong><br />
4.8 Completions on allocated and committed sites has comprised of B1 and mixed use over<br />
recent years, however, the rate of completions has slowed over recent years whilst progress<br />
was made with releasing the next phase of the Business Park. The rate of completions is likely<br />
to accelerate as the aforementioned Phase 2 of the <strong>Scarborough</strong> Business Park now in<br />
pre-development.<br />
Core Output Indicator 1c - Employment Completions on Previously Developed Land<br />
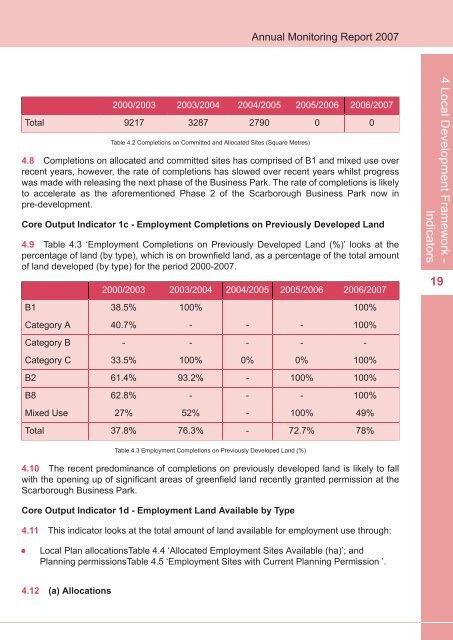
4.9 Table 4.3 ‘Employment Completions on Previously Developed Land (%)’ looks at the<br />
percentage of land (by type), which is on brownfield land, as a percentage of the total amount<br />
of land developed (by type) for the period 2000-<strong>2007</strong>.<br />
2000/2003<br />
2003/2004<br />
2004/2005<br />
2005/2006<br />
0<br />
2006/<strong>2007</strong><br />
4 Local Development Framework -<br />
Indicators<br />
19<br />
B1<br />
38.5%<br />
100%<br />
100%<br />
Category A<br />
40.7%<br />
-<br />
-<br />
-<br />
100%<br />
Category B<br />
-<br />
-<br />
-<br />
-<br />
-<br />
Category C<br />
33.5%<br />
100%<br />
0%<br />
0%<br />
100%<br />
B2<br />
61.4%<br />
93.2%<br />
-<br />
100%<br />
100%<br />
B8<br />
62.8%<br />
-<br />
-<br />
-<br />
100%<br />
Mixed Use<br />
27%<br />
52%<br />
-<br />
100%<br />
49%<br />
Total<br />
37.8%<br />
76.3%<br />
-<br />
72.7%<br />
78%<br />
Table 4.3 Employment Completions on Previously Developed Land (%)<br />
4.10 The recent predominance of completions on previously developed land is likely to fall<br />
with the opening up of significant areas of greenfield land recently granted permission at the<br />
<strong>Scarborough</strong> Business Park.<br />
Core Output Indicator 1d - Employment Land Available by Type<br />
4.11 This indicator looks at the total amount of land available for employment use through:<br />
Local Plan allocationsTable 4.4 ‘Allocated Employment Sites Available (ha)’; and<br />
Planning permissionsTable 4.5 ‘Employment Sites with Current Planning Permission ’.<br />
4.12 (a) Allocations