Annual Monitoring Report 2007(6.6MB) - Scarborough Borough ...
Annual Monitoring Report 2007(6.6MB) - Scarborough Borough ...
Annual Monitoring Report 2007(6.6MB) - Scarborough Borough ...

You also want an ePaper? Increase the reach of your titles
YUMPU automatically turns print PDFs into web optimized ePapers that Google loves.
<strong>Annual</strong> <strong>Monitoring</strong> <strong>Report</strong> <strong>2007</strong><br />
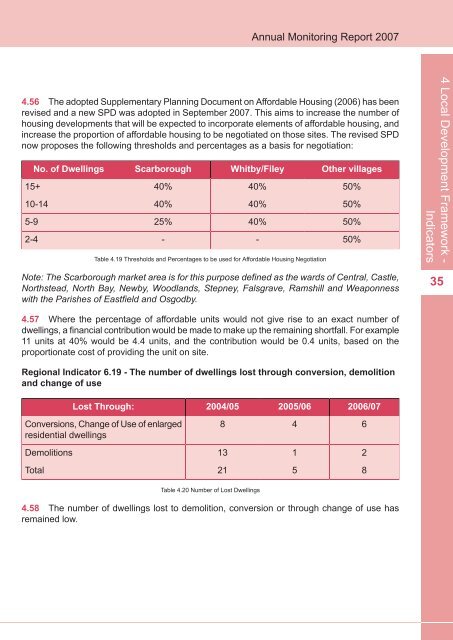
4.56 The adopted Supplementary Planning Document on Affordable Housing (2006) has been<br />
revised and a new SPD was adopted in September <strong>2007</strong>. This aims to increase the number of<br />
housing developments that will be expected to incorporate elements of affordable housing, and<br />
increase the proportion of affordable housing to be negotiated on those sites. The revised SPD<br />
now proposes the following thresholds and percentages as a basis for negotiation:<br />
15+<br />
No. of Dwellings<br />
10-14<br />
5-9<br />
2-4<br />
<strong>Scarborough</strong><br />
40%<br />
40%<br />
25%<br />
-<br />
Whitby/Filey<br />
40%<br />
40%<br />
40%<br />
Table 4.19 Thresholds and Percentages to be used for Affordable Housing Negotiation<br />
-<br />
Other villages<br />
Note: The <strong>Scarborough</strong> market area is for this purpose defined as the wards of Central, Castle,<br />
Northstead, North Bay, Newby, Woodlands, Stepney, Falsgrave, Ramshill and Weaponness<br />
with the Parishes of Eastfield and Osgodby.<br />
50%<br />
50%<br />
50%<br />
50%<br />
4 Local Development Framework -<br />
Indicators<br />
35<br />
4.57 Where the percentage of affordable units would not give rise to an exact number of<br />
dwellings, a financial contribution would be made to make up the remaining shortfall. For example<br />
11 units at 40% would be 4.4 units, and the contribution would be 0.4 units, based on the<br />
proportionate cost of providing the unit on site.<br />
Regional Indicator 6.19 - The number of dwellings lost through conversion, demolition<br />
and change of use<br />
Lost Through:<br />
2004/05<br />
2005/06<br />
2006/07<br />
Conversions, Change of Use of enlarged<br />
residential dwellings<br />
8<br />
4<br />
6<br />
Demolitions<br />
13<br />
1<br />
2<br />
Total<br />
21<br />
5<br />
8<br />
Table 4.20 Number of Lost Dwellings<br />
4.58 The number of dwellings lost to demolition, conversion or through change of use has<br />
remained low.