Annual Monitoring Report 2007(6.6MB) - Scarborough Borough ...
Annual Monitoring Report 2007(6.6MB) - Scarborough Borough ...
Annual Monitoring Report 2007(6.6MB) - Scarborough Borough ...

Create successful ePaper yourself
Turn your PDF publications into a flip-book with our unique Google optimized e-Paper software.
<strong>Annual</strong> <strong>Monitoring</strong> <strong>Report</strong> <strong>2007</strong><br />
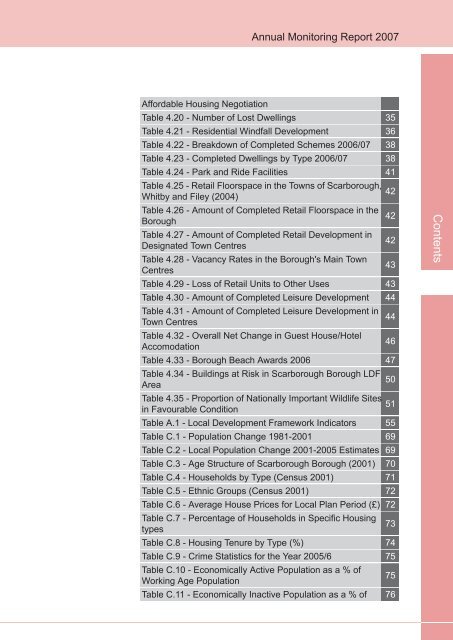
Affordable Housing Negotiation<br />
Table 4.20 - Number of Lost Dwellings<br />
Table 4.21 - Residential Windfall Development<br />
Table 4.22 - Breakdown of Completed Schemes 2006/07<br />
Table 4.23 - Completed Dwellings by Type 2006/07<br />
Table 4.24 - Park and Ride Facilities<br />
Table 4.25 - Retail Floorspace in the Towns of <strong>Scarborough</strong>,<br />
Whitby and Filey (2004)<br />
Table 4.26 - Amount of Completed Retail Floorspace in the<br />
<strong>Borough</strong><br />
Table 4.27 - Amount of Completed Retail Development in<br />
Designated Town Centres<br />
Table 4.28 - Vacancy Rates in the <strong>Borough</strong>'s Main Town<br />
Centres<br />
Table 4.29 - Loss of Retail Units to Other Uses<br />
Table 4.30 - Amount of Completed Leisure Development<br />
Table 4.31 - Amount of Completed Leisure Development in<br />
Town Centres<br />
Table 4.32 - Overall Net Change in Guest House/Hotel<br />
Accomodation<br />
Table 4.33 - <strong>Borough</strong> Beach Awards 2006<br />
Table 4.34 - Buildings at Risk in <strong>Scarborough</strong> <strong>Borough</strong> LDF<br />
Area<br />
Table 4.35 - Proportion of Nationally Important Wildlife Sites<br />
in Favourable Condition<br />
Table A.1 - Local Development Framework Indicators<br />
Table C.1 - Population Change 1981-2001<br />
Table C.2 - Local Population Change 2001-2005 Estimates<br />
Table C.3 - Age Structure of <strong>Scarborough</strong> <strong>Borough</strong> (2001)<br />
Table C.4 - Households by Type (Census 2001)<br />
Table C.5 - Ethnic Groups (Census 2001)<br />
Table C.6 - Average House Prices for Local Plan Period (£)<br />
Table C.7 - Percentage of Households in Specific Housing<br />
types<br />
Table C.8 - Housing Tenure by Type (%)<br />
Table C.9 - Crime Statistics for the Year 2005/6<br />
Table C.10 - Economically Active Population as a % of<br />
Working Age Population<br />
Table C.11 - Economically Inactive Population as a % of<br />
35<br />
36<br />
38<br />
38<br />
41<br />
42<br />
42<br />
42<br />
43<br />
43<br />
44<br />
44<br />
46<br />
47<br />
50<br />
51<br />
55<br />
69<br />
69<br />
70<br />
71<br />
72<br />
72<br />
73<br />
74<br />
75<br />
75<br />
76<br />
Contents