Annual Monitoring Report 2007(6.6MB) - Scarborough Borough ...
Annual Monitoring Report 2007(6.6MB) - Scarborough Borough ...
Annual Monitoring Report 2007(6.6MB) - Scarborough Borough ...

You also want an ePaper? Increase the reach of your titles
YUMPU automatically turns print PDFs into web optimized ePapers that Google loves.
<strong>Annual</strong> <strong>Monitoring</strong> <strong>Report</strong> <strong>2007</strong><br />
There is a clear need to support the sustainability of villages throughout the <strong>Borough</strong> by<br />
safeguarding and enhancing the supply of employment land in rural areas. Rural areas<br />
need an adequate supply of employment land in order to attract businesses and investment<br />
and maintain a healthy number of rural jobs.<br />
The current level of employment land supply should be retained and safeguarded throughout<br />
the <strong>Borough</strong>. In the case of small, fragmented town centre employment sites, future policy<br />
should consider the potential for re-use on a site-by-site basis, based on their physical<br />
characteristics, role in the local economy and demand by businesses and customers. Any<br />
releases of low quality urban employment sites should be matched by the allocation of<br />
new, high-quality employment sites within urban areas.<br />
In general, there is no evident justification for significant release of employment land in the<br />
<strong>Borough</strong>, other than on a selective, site by site consideration basis. It is also recommended<br />
that any release of employment land (because of physical and market constraints) should<br />
be accompanied by a respective allocation of new sites that meet the geographical and<br />
qualitative needs of the market at the time.<br />
4 Local Development Framework -<br />
Indicators<br />
25<br />
Housing<br />
4.26 This section looks specifically at progress with new housing provision and provides an<br />
estimate of likely future provision (a 'housing trajectory') over the next 5 years. The chapter<br />
incorporates historical data and targets.<br />
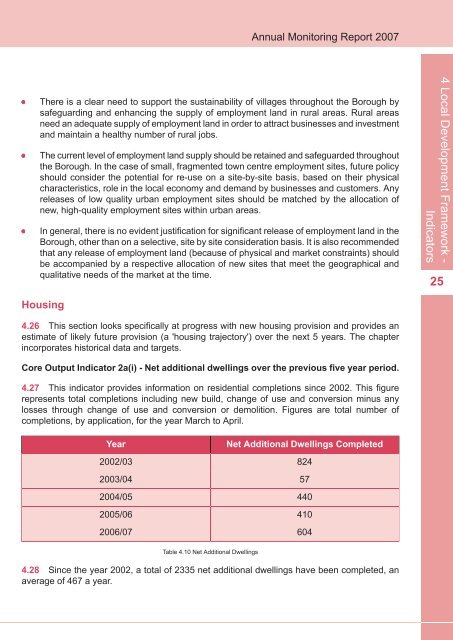
Core Output Indicator 2a(i) - Net additional dwellings over the previous five year period.<br />
4.27 This indicator provides information on residential completions since 2002. This figure<br />
represents total completions including new build, change of use and conversion minus any<br />
losses through change of use and conversion or demolition. Figures are total number of<br />
completions, by application, for the year March to April.<br />
Year<br />
2002/03<br />
2003/04<br />
2004/05<br />
2005/06<br />
2006/07<br />
Net Additional Dwellings Completed<br />
824<br />
57<br />
440<br />
410<br />
604<br />
Table 4.10 Net Additional Dwellings<br />
4.28 Since the year 2002, a total of 2335 net additional dwellings have been completed, an<br />
average of 467 a year.