Performance Tuning Siebel Software on the Sun Platform
Performance Tuning Siebel Software on the Sun Platform
Performance Tuning Siebel Software on the Sun Platform

You also want an ePaper? Increase the reach of your titles
YUMPU automatically turns print PDFs into web optimized ePapers that Google loves.
Count indv cuml rcnt nsec Lock Caller<br />
----------------------------------------------------------------------------<br />
5 10% 10% 1.00 131488 0x300274e5600 segvn_fault+0x38<br />
3 6% 15% 1.00 111840 0x3001a62b940 segvn_fault+0x38<br />
3 6% 21% 1.00 139253 0x3002792f2a0 segvn_fault+0x38<br />
…<br />
1 2% 98% 1.00 98400 0x3001e296650 segvn_fault+0x38<br />
1 2% 100% 1.00 100640 0x300295764e0 segvn_fault+0x38<br />
----------------------------------------------------------------------------<br />
Lockstat record failure: 5 events in 4.998 sec<strong>on</strong>ds (1 events/sec)<br />
Count indv cuml rcnt Lock Caller<br />
----------------------------------------------------------------------------<br />
5 100% 100% 0.00 lockstat_lock lockstat_record<br />
----------------------------------------------------------------------------<br />
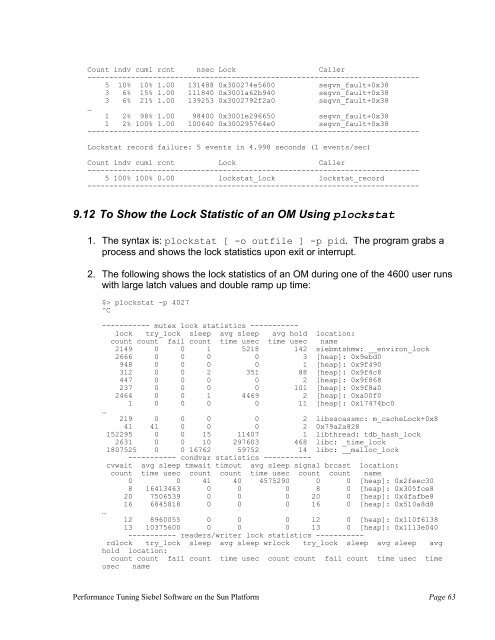
9.12 To Show <strong>the</strong> Lock Statistic of an OM Using plockstat<br />
1. The syntax is: plockstat [ -o outfile ] -p pid. The program grabs a<br />
process and shows <strong>the</strong> lock statistics up<strong>on</strong> exit or interrupt.<br />
2. The following shows <strong>the</strong> lock statistics of an OM during <strong>on</strong>e of <strong>the</strong> 4600 user runs<br />
with large latch values and double ramp up time:<br />
$> plockstat -p 4027<br />
^C<br />
----------- mutex lock statistics -----------<br />
lock try_lock sleep avg sleep avg hold locati<strong>on</strong>:<br />
count count fail count time usec time usec name<br />
2149 0 0 1 5218 142 siebmtshmw: __envir<strong>on</strong>_lock<br />
2666 0 0 0 0 3 [heap]: 0x9ebd0<br />
948 0 0 0 0 1 [heap]: 0x9f490<br />
312 0 0 2 351 88 [heap]: 0x9f4c8<br />
447 0 0 0 0 2 [heap]: 0x9f868<br />
237 0 0 0 0 101 [heap]: 0x9f8a0<br />
2464 0 0 1 4469 2 [heap]: 0xa00f0<br />
1 0 0 0 0 11 [heap]: 0x17474bc0<br />
…<br />
219 0 0 0 0 2 libsscassmc: m_cacheLock+0x8<br />
41 41 0 0 0 2 0x79a2a828<br />
152295 0 0 15 11407 1 libthread: tdb_hash_lock<br />
2631 0 0 10 297603 468 libc: _time_lock<br />
1807525 0 0 16762 59752 14 libc: __malloc_lock<br />
----------- c<strong>on</strong>dvar statistics -----------<br />
cvwait avg sleep tmwait timout avg sleep signal brcast locati<strong>on</strong>:<br />
count time usec count count time usec count count name<br />
0 0 41 40 4575290 0 0 [heap]: 0x2feec30<br />
8 16413463 0 0 0 8 0 [heap]: 0x305fce8<br />
20 7506539 0 0 0 20 0 [heap]: 0x4fafbe8<br />
16 6845818 0 0 0 16 0 [heap]: 0x510a8d8<br />
…<br />
12 8960055 0 0 0 12 0 [heap]: 0x110f6138<br />
13 10375600 0 0 0 13 0 [heap]: 0x1113e040<br />
----------- readers/writer lock statistics -----------<br />
rdlock try_lock sleep avg sleep wrlock try_lock sleep avg sleep avg<br />
hold locati<strong>on</strong>:<br />
count count fail count time usec count count fail count time usec time<br />
usec name<br />
<str<strong>on</strong>g>Performance</str<strong>on</strong>g> <str<strong>on</strong>g>Tuning</str<strong>on</strong>g> <str<strong>on</strong>g>Siebel</str<strong>on</strong>g> <str<strong>on</strong>g>Software</str<strong>on</strong>g> <strong>on</strong> <strong>the</strong> <strong>Sun</strong> <strong>Platform</strong> Page 63