Performance Tuning Siebel Software on the Sun Platform
Performance Tuning Siebel Software on the Sun Platform
Performance Tuning Siebel Software on the Sun Platform

You also want an ePaper? Increase the reach of your titles
YUMPU automatically turns print PDFs into web optimized ePapers that Google loves.
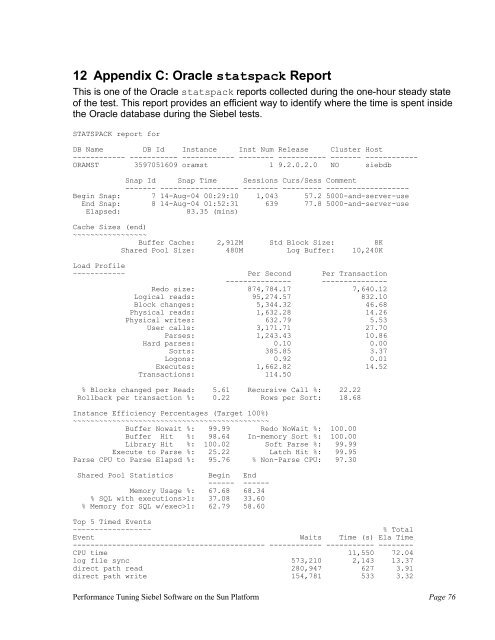
12 Appendix C: Oracle statspack Report<br />
This is <strong>on</strong>e of <strong>the</strong> Oracle statspack reports collected during <strong>the</strong> <strong>on</strong>e-hour steady state<br />
of <strong>the</strong> test. This report provides an efficient way to identify where <strong>the</strong> time is spent inside<br />
<strong>the</strong> Oracle database during <strong>the</strong> <str<strong>on</strong>g>Siebel</str<strong>on</strong>g> tests.<br />
STATSPACK report for<br />
DB Name DB Id Instance Inst Num Release Cluster Host<br />
------------ ----------- ------------ -------- ----------- ------- ------------<br />
ORAMST 3597051609 oramst 1 9.2.0.2.0 NO siebdb<br />
Snap Id Snap Time Sessi<strong>on</strong>s Curs/Sess Comment<br />
------- ------------------ -------- --------- -------------------<br />
Begin Snap: 7 14-Aug-04 00:29:10 1,043 57.2 5000-and-server-use<br />
End Snap: 8 14-Aug-04 01:52:31 639 77.8 5000-and-server-use<br />
Elapsed:<br />
83.35 (mins)<br />
Cache Sizes (end)<br />
~~~~~~~~~~~~~~~~~<br />
Buffer Cache: 2,912M Std Block Size: 8K<br />
Shared Pool Size: 480M Log Buffer: 10,240K<br />
Load Profile<br />
~~~~~~~~~~~~ Per Sec<strong>on</strong>d Per Transacti<strong>on</strong><br />
--------------- ---------------<br />
Redo size: 874,784.17 7,640.12<br />
Logical reads: 95,274.57 832.10<br />
Block changes: 5,344.32 46.68<br />
Physical reads: 1,632.28 14.26<br />
Physical writes: 632.79 5.53<br />
User calls: 3,171.71 27.70<br />
Parses: 1,243.43 10.86<br />
Hard parses: 0.10 0.00<br />
Sorts: 385.85 3.37<br />
Log<strong>on</strong>s: 0.92 0.01<br />
Executes: 1,662.82 14.52<br />
Transacti<strong>on</strong>s: 114.50<br />
% Blocks changed per Read: 5.61 Recursive Call %: 22.22<br />
Rollback per transacti<strong>on</strong> %: 0.22 Rows per Sort: 18.68<br />
Instance Efficiency Percentages (Target 100%)<br />
~~~~~~~~~~~~~~~~~~~~~~~~~~~~~~~~~~~~~~~~~~~~~<br />
Buffer Nowait %: 99.99 Redo NoWait %: 100.00<br />
Buffer Hit %: 98.64 In-memory Sort %: 100.00<br />
Library Hit %: 100.02 Soft Parse %: 99.99<br />
Execute to Parse %: 25.22 Latch Hit %: 99.95<br />
Parse CPU to Parse Elapsd %: 95.76 % N<strong>on</strong>-Parse CPU: 97.30<br />
Shared Pool Statistics Begin End<br />
------ ------<br />
Memory Usage %: 67.68 68.34<br />
% SQL with executi<strong>on</strong>s>1: 37.08 33.60<br />
% Memory for SQL w/exec>1: 62.79 58.60<br />
Top 5 Timed Events<br />
~~~~~~~~~~~~~~~~~~ % Total<br />
Event Waits Time (s) Ela Time<br />
-------------------------------------------- ------------ ----------- --------<br />
CPU time 11,550 72.04<br />
log file sync 573,210 2,143 13.37<br />
direct path read 280,947 627 3.91<br />
direct path write 154,781 533 3.32<br />
<str<strong>on</strong>g>Performance</str<strong>on</strong>g> <str<strong>on</strong>g>Tuning</str<strong>on</strong>g> <str<strong>on</strong>g>Siebel</str<strong>on</strong>g> <str<strong>on</strong>g>Software</str<strong>on</strong>g> <strong>on</strong> <strong>the</strong> <strong>Sun</strong> <strong>Platform</strong> Page 76