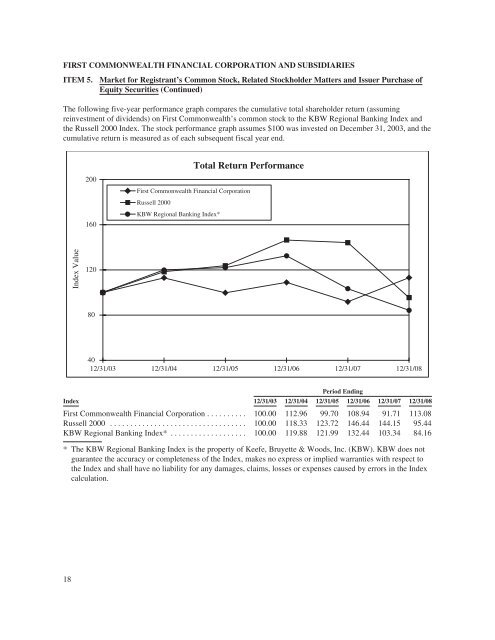
FIRST COMMONWEALTH FINANCIAL CORPORATION AND SUBSIDIARIES ITEM 5. Market for Registrant’s Common Stock, Related Stockholder Matters <strong>and</strong> Issuer Purchase of Equity Securities (Continued) The following five-year performance graph compares the cumulative total shareholder return (assuming reinvestment of dividends) on First Commonwealth’s common stock to the KBW Regional Banking Index <strong>and</strong> the Russell 2000 Index. The stock performance graph assumes $100 was invested on December 31, 2003, <strong>and</strong> the cumulative return is measured as of each subsequent fiscal year end. Total Return Performance 200 First Commonwealth <strong>Financial</strong> Corporation Russell 2000 160 KBW Regional Banking Index* Index Value 120 80 40 12/31/03 12/31/04 12/31/05 12/31/06 12/31/07 12/31/08 Period Ending Index 12/31/03 12/31/04 12/31/05 12/31/06 12/31/07 12/31/08 First Commonwealth <strong>Financial</strong> Corporation .......... 100.00 112.96 99.70 108.94 91.71 113.08 Russell 2000 .................................. 100.00 118.33 123.72 146.44 144.15 95.44 KBW Regional Banking Index* ................... 100.00 119.88 121.99 132.44 103.34 84.16 * The KBW Regional Banking Index is the property of Keefe, Bruyette & Woods, Inc. (KBW). KBW does not guarantee the accuracy or completeness of the Index, makes no express or implied warranties with respect to the Index <strong>and</strong> shall have no liability for any damages, claims, losses or expenses caused by errors in the Index calculation. 18
FIRST COMMONWEALTH FINANCIAL CORPORATION AND SUBSIDIARIES ITEM 6. Selected <strong>Financial</strong> Data The following selected financial data is not covered by the auditor’s report <strong>and</strong> should be read in conjunction with Management’s Discussion <strong>and</strong> Analysis of <strong>Financial</strong> Condition <strong>and</strong> Results of Operations, which follows, <strong>and</strong> with the Consolidated <strong>Financial</strong> Statements <strong>and</strong> related notes. Years Ended December 31, 2008 2007 2006 2005 2004 (dollars in thous<strong>and</strong>s, except share data) Interest income ....................... $ 327,596 $ 331,095 $ 333,070 $ 312,068 $ 278,025 Interest expense ...................... 138,998 169,713 166,107 138,618 110,690 Net interest income ............... 188,598 161,382 166,963 173,450 167,335 Provision for credit losses .............. 23,095 10,042 11,544 8,628 8,070 Net interest income after provision for credit losses ................... 165,503 151,340 155,419 164,822 159,265 Net securities (losses) gains ............. (11,494) 1,174 697 (7,673) 4,077 Gain on sale of branches ............... -0- -0- -0- 11,832 -0- Gain on sale of merchant services business .......................... -0- -0- -0- 1,991 -0- Other income ........................ 54,325 47,696 43,550 44,075 43,572 Restructuring charges ................. -0- -0- -0- 5,437 -0- Merger <strong>and</strong> related charges ............. -0- -0- -0- -0- 2,125 (Gain) loss on extinguishment of debt ..... -0- -0- (410) -0- 29,495 Other expenses ....................... 158,615 148,007 138,093 138,517 132,935 Income before taxes ............... 49,719 52,203 61,983 71,093 42,359 Applicable income taxes ............... 6,632 5,953 9,029 13,257 3,707 Net income .......................... $ 43,087 $ 46,250 $ 52,954 $ 57,836 $ 38,652 Per Share Data Net income ...................... $ 0.580 $ 0.640 $ 0.750 $ 0.830 $ 0.590 Dividends declared ............... $ 0.680 $ 0.680 $ 0.680 $ 0.665 $ 0.645 Average shares outst<strong>and</strong>ing ......... 74,477,795 72,816,208 70,766,348 69,276,141 65,887,611 Per Share Data Assuming Dilution Net income ...................... $ 0.580 $ 0.630 $ 0.740 $ 0.830 $ 0.580 Dividends declared ............... $ 0.680 $ 0.680 $ 0.680 $ 0.665 $ 0.645 Average shares outst<strong>and</strong>ing ......... 74,583,236 72,973,259 71,133,562 69,835,285 66,487,516 At End of Period Total assets ...................... $ 6,425,880 $ 5,883,618 $ 6,043,916 $ 6,026,320 $ 6,198,478 Investment securities .............. 1,452,191 1,645,714 1,723,191 1,939,743 2,240,477 Loans <strong>and</strong> leases, net of unearned income ....................... 4,418,377 3,697,819 3,783,817 3,624,259 3,514,833 Allowance for credit losses ......... 52,759 42,396 42,648 39,492 41,063 Deposits ........................ 4,280,343 4,347,219 4,326,440 3,996,552 3,844,475 Short-term borrowings ............. 1,152,700 354,201 500,014 665,665 946,474 Subordinated debentures ........... 105,750 105,750 108,250 108,250 108,250 Other long-term debt .............. 170,530 442,196 485,170 691,494 731,324 Shareholders’ equity .............. 652,779 568,788 571,361 521,045 531,978 Key Ratios Return on average assets ........... 0.70% 0.80% 0.89% 0.94% 0.66% Return on average equity ........... 7.45% 8.08% 9.76% 10.89% 7.82% Net loans to deposits ratio .......... 101.99% 84.09% 86.47% 89.70% 90.36% Dividend payout ratio ............. 117.24% 106.25% 90.67% 80.12% 109.32% Average equity to average assets ratio ......................... 9.35% 9.87% 9.08% 8.60% 8.47% 19